Abstract
Digital pathology, including image analysis and automatic diagnosis of pathological tissue, has been developed remarkably. HALO is an image analysis platform specialized for the study of pathological tissues, which enables tissue segmentation by using artificial intelligence. In this study, we used HALO to quantify various histopathological changes and findings that were difficult to analyze using conventional image processing software. Using the tissue classifier module, the morphological features of degeneration/necrosis of the hepatocytes and muscle fibers, bile duct in the liver, basophilic tubules and hyaline casts in the kidney, cortex in the thymus, and red pulp, white pulp, and marginal zone in the spleen were learned and separated, and areas of interest were quantified. Furthermore, using the cytonuclear module and vacuole module in combination with the tissue classifier module, the number of erythroblasts in the red pulp of the spleen and each area of acinar cells in the parotid gland were quantified. The results of quantitative analysis were correlated with the histopathological grades evaluated by pathologists. By using artificial intelligence and other functions of HALO, we recognized morphological features, analyzed histopathological changes, and quantified the histopathological grades of various findings. The analysis of histopathological changes using HALO is expected to support pathology evaluations.
Keywords: morphometry, quantitative analysis, HALO, digital pathology
Introduction
Pathological evaluation is typically conducted by observing tissue specimens. The evaluation results are very important from the viewpoint of examining histopathological changes directly. However, pathological evaluation often generates bias among facilities or observers. One of the means for reducing the bias is to quantify the histopathological changes. Appropriate quantification of histopathological changes consistent with the observation results enables pathological evaluation with objectivity and high reproducibility. Furthermore, it is possible to quantify the degree of subtle histopathological changes that cannot be distinguished by observers. An objective and highly accurate quantitative analysis can lead to an improvement in reliability and persuasiveness. If quantitative analysis is automated, the efficiency of the pathological evaluation is expected to be improved.
Recently, with the development of information technology, digital pathology has also developed remarkably. An increasing number of researchers have been attempting to analyze and diagnose pathological tissues using machine learning or artificial intelligence (AI)1, 2, 3, 4, 5, 6. Particularly, in the clinical field, automatic recognition of morphologically complex cancer tissues has become possible with high accuracy7, 8, 9. On the other hand, in the nonclinical field, there are many cases of simply quantifying specific stained regions, but there are not so many cases of analyzing and quantifying complex tissue morphology.
We have attempted to analyze and quantify various histopathological findings using conventional image processing software in order to turn the quantitative results into indicators of drug efficacy or toxicity6, 10. Several findings were quantified by devising innovative means of morphological processing and functions of image processing software. These quantitative findings were correlated with evaluations by pathologists. However, quantitative analysis requires high expertise in the setting of conditions and construction of algorithms for image processing software. Therefore, it is not easy for everyone to analyze a tissue image, and this practice tends to be of low versatility.
Recent reports have used the image analysis platform HALO, which can easily separate tissue classes and quantify various morphological features in pathological tissue11, 12, 13. This makes many morphometric measurements of pathological tissue possible. Using HALO, we attempted to quantify various findings, including hepatocellular degeneration/necrosis and atrophy of the marginal zone in the spleen, that were hard or impossible to analyze with conventional image processing software6. In this report, we introduce quantifiable examples of several histopathological findings and mention future prospects.
Methods, Results, and Discussion
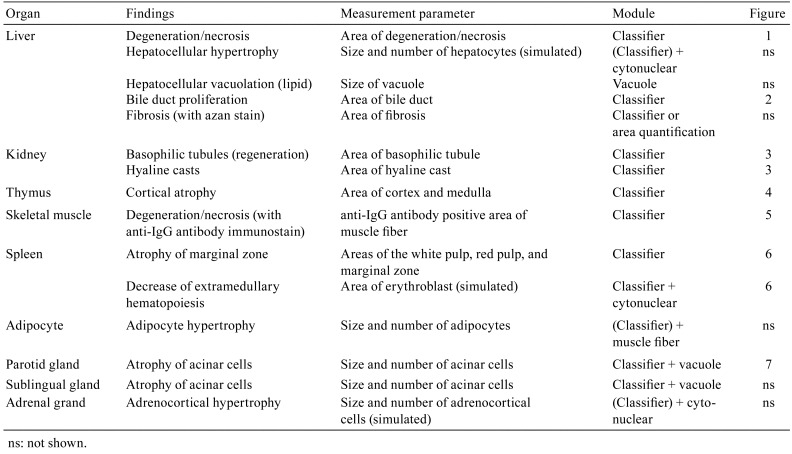
In this study, we used tissue specimens that were fixed in formalin, embedded in paraffin, and stained with hematoxylin and eosin (HE) or immunostained. Whole digital slide images were obtained using virtual microscopy (Aperio AT2, Leica Biosystems, Wetzlar, Germany). Using HALO (v2.2.1870.17, Indica Labs, Albuquerque, NM, USA), histopathological features of target findings were analyzed and quantified. Table 1 shows a summary of target findings, measurement parameters, and the applied HALO modules. The tissue classifier module has a random forests algorithm, which is one of the machine learning methods for constructing a multitude of decision trees during training14. In each experiment, the number of specimens per grade was one (n=1), and tissue classes were separated based on learning from several representative images. The detailed methods of each analysis are described in the following section.
Table 1. Summary of Quantified Findings, Measurement Parameters, and the Applied HALO Module.
Hepatocellular degeneration/necrosis in the liver
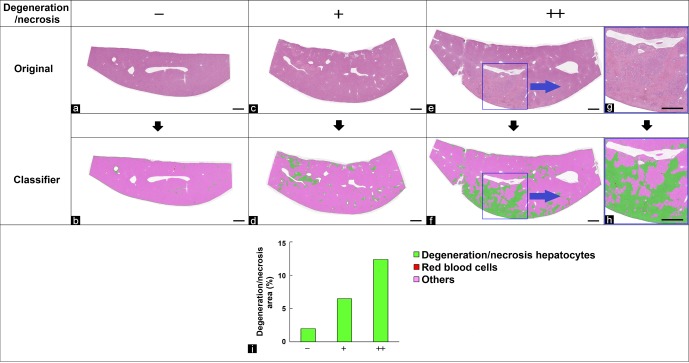
Hepatocellular degeneration/necrosis in a specimen stained with HE is relatively easy to recognize because morphological changes such as eosinophilic cytoplasm and atrophied nuclei are comprehensively observed. However, when analyzing detailed morphological features, the eosinophilic color tone present within hepatocytes undergoing degeneration/necrosis is also present in normal hepatocytes. This makes it hard to distinguish them clearly using conventional image analysis6. In this study, the morphological features of hepatocytes undergoing degeneration/necrosis, red blood cells, and the other components (mainly normal hepatocytes) were learned and separated by the tissue classifier module (random forest algorithm) of HALO using specimens graded as − (no change), + (slight), or ++ (moderate) for the degree of hepatocellular degeneration/necrosis. The area of interest was then quantified. Fig. 1b, d, f, and h show the images separated using the tissue classifier module. Degeneration/necrosis area is expressed as a ratio to the whole liver area analyzed. The results of the quantitative analysis were correlated with the degree of degeneration/necrosis graded by pathologists (Fig. 1i).
Fig. 1.
Quantification of hepatocellular degeneration/necrosis area. (a, c, e, g) Original images. (b, d, f, h) Segmented images of degeneration/necrosis (green), red blood cells (red), and the other regions (pink) through the use of the tissue classifier module. (g, h) Enlarged images of blue frames in (e) and (f), respectively. Grade of degeneration/necrosis evaluated by pathologists: (a, b) no change, −; (c, d) slight, +; (e–h) moderate, ++. Bar = 1 mm. (i) Quantitative results for degeneration/necrosis area (% of the whole area of the liver section).
Bile duct proliferation in the liver
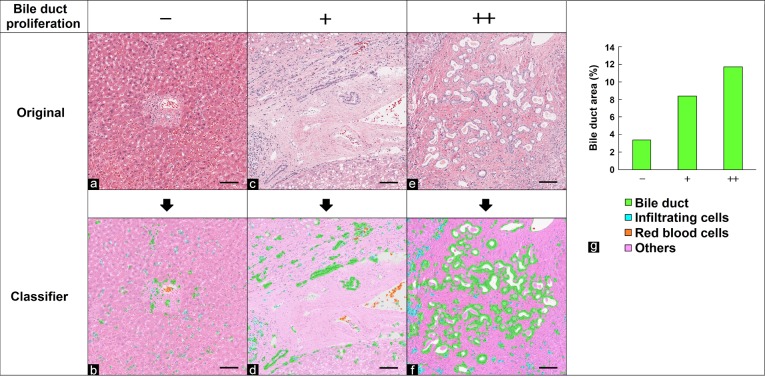
The bile duct is a stimulus-sensitive tissue component known to proliferate in many hepatobiliary disorders. The morphological features of the bile duct, infiltrating cells with form similar to the bile duct, red blood cells, and other components (mainly normal hepatocytes) were learned and separated by the tissue classifier module using HE-stained specimens graded as −, +, or ++ for the degree of bile duct proliferation. The area of interest was then quantified. Figure 2b, d, and f show the images separated using the tissue classifier module. Bile duct area is expressed as a ratio to the whole liver area analyzed. The results of the quantitative analysis showed that the area (number) of the bile duct increased in correlation with the degree of bile duct proliferation graded by pathologists (Fig. 2g). Although this did not occur in the present study, it should be noted that if an extremely large bile duct is present within the analyzed region, it is necessary to exclude it by limiting the size of bile duct because the area of such a large bile duct may be equal to that of the proliferated bile duct.
Fig. 2.
Quantification of the bile duct area in the liver. (a, c, e) Original images. (b, d, f) Segmented images of bile duct (green), infiltrating cells (light blue), red blood cells (orange), and other regions (pink) using the tissue classifier module. Grade of proliferation of bile duct evaluated by pathologists: (a, b) no change, −; (c, d) slight, +; (e, f) moderate, ++. Bar = 100 μm. (g) Quantitative results for bile duct area (% of the whole area of the liver section).
Basophilic tubules and hyaline casts in the kidney
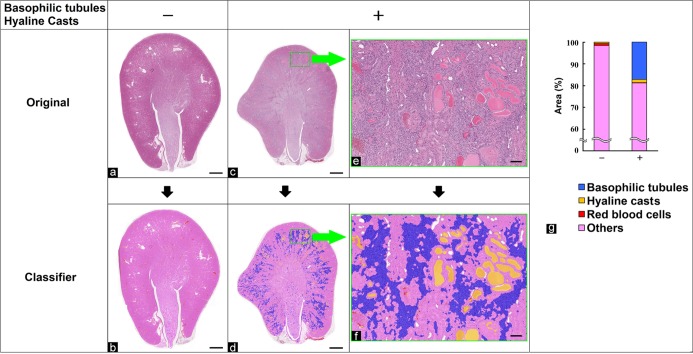
Various pathological changes in the kidney stained with HE can be observed due to renal dysfunction. Basophilization of the renal tubule is a regenerative pathological change that occurs in the process of repairing renal tubule injury. Hyaline casts are often caused by impairment of the glomerular filtration barrier. The morphological features of basophilic tubules, hyaline casts, red blood cells, and other components (normal tubules, glomeruli, and the renal pelvis) were learned and separated by the tissue classifier module using HE-stained specimens in which the degree of basophilic tubules was graded as − or + and that of hyaline casts was graded as − or +. Each area of interest was then quantified. Each area is expressed as a ratio to the whole kidney area analyzed. Figure 3b, d, and f show the separated images. The results of the quantitative analysis showed that basophilic tubules and hyaline casts increased in correlation with the degree graded by pathologists (Fig. 3g).
Fig. 3.
Quantification of the areas of basophilic tubules and hyaline casts in the kidney. (a, c, e) Original images. (b, d, f) Segmented images of basophilic tubules (blue), hyaline casts (yellow), red blood cells (red), and other regions (pink) using the tissue classifier module. (e, f) Enlarged images of green frames in (c) and (d), respectively. Grade of basophilic tubules and hyaline casts evaluated by pathologists: (a, b) no change, −; (c–f) slight, +. Bar = 1 mm (a–d) and 100 μm (e, f). (g) Quantitative results for segmented areas (% of the whole area of the kidney section).
It was not possible to segment tissue classes included in the other components using the tissue classifier module. Automated detection of glomeruli using the histogram of oriented gradients (HOG) has been reported4, 5. By using an analysis that makes use of a deep learning algorithm, it may be possible to analyze more detailed tissue forms including glomeruli.
Cortical atrophy in the thymus
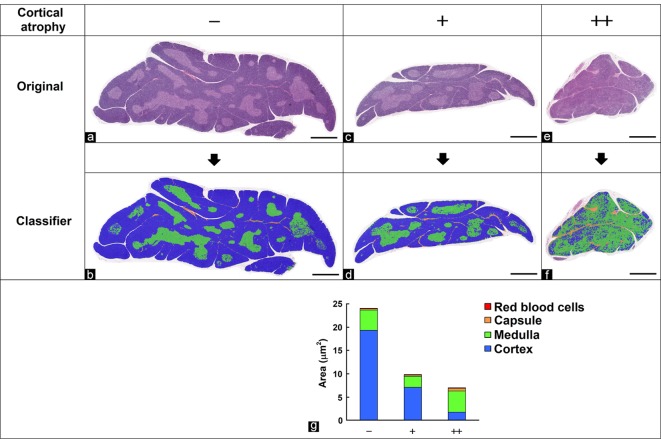
Histologically, the structure of the thymus can be divided into the cortex and medulla, and these zones are often changed morphologically due to stress or immune stimulation. The morphological features of the cortex, medulla, capsule, and red blood cells in the thymus stained with HE were learned and separated by the tissue classifier module using specimens graded as −, +, or ++ for the degree of cortical atrophy. The area of interest was then quantified. Figure 4b, d, and f show the separated images. The results of the quantitative analysis were correlated with the degree of cortical atrophy graded by pathologists (Fig. 4g), which suggested that cortical atrophy contributed greatly to atrophy of the thymus.
Fig. 4.
Quantification of the cortex area in the thymus. (a, c, e) Original images. (b, d, f) Segmented images of the cortex (blue), medulla (green), red blood cells (red), and capsule (orange) using the tissue classifier module. Grade of cortical atrophy evaluated by pathologists: (a, b) no change, −; (c, d) slight, +; (e, f) moderate, ++. Bar = 1 mm. (g) Quantitative results for segmented areas.
Degeneration/necrosis in the skeletal muscle fibers
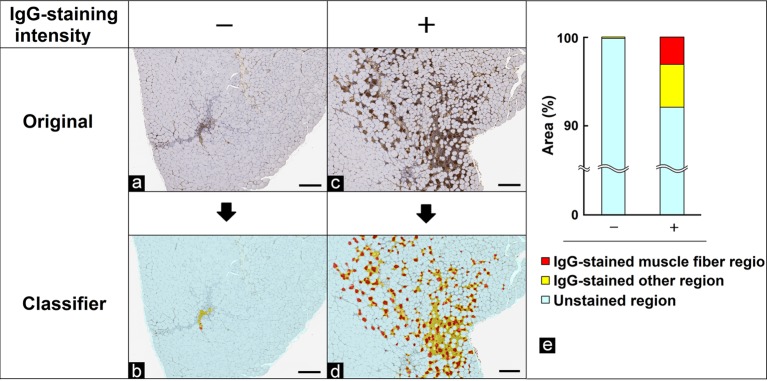
Skeletal muscle fibers undergoing degeneration/necrosis, in which the cell walls were impaired and blood containing IgG flowed into the cells, were immunostained with anti-IgG antibody, as described in a previous report15. However, IgG is also observed in other regions including connective tissue and interstitial tissue, making it hard to distinguish only muscle fibers undergoing degeneration/necrosis by conventional image analysis. In this study, the morphological features of anti-IgG antibody-immunostained muscle fibers, an anti-IgG antibody-immunostained “other region”, and an unstained region were learned and separated by the tissue classifier module using immunostained specimens graded as − or + for the degree of staining intensity of the muscle fibers. Each area of interest was then quantified. Figure 5b and d show the separated images. Each area is expressed as a ratio to the whole muscle area analyzed. The results of the quantitative analysis were correlated with the degree of degeneration/necrosis graded by pathologists (Fig. 5e).
Fig. 5.
Quantification of the IgG-stained muscle fibers area. (a, c) Original images. (b, d) Segmented images of the IgG-stained muscle fiber region (red), IgG-stained other region (yellow), and unstained region (light blue) using the tissue classifier module. Grade of the IgG-stained muscle fiber (degeneration/necrosis of muscle fibers) area evaluated by pathologists: (a, b) no change, −; (c, d) slight, +. Bar = 200 μm. (e) Quantitative results for segmented areas (% of the whole area of the skeletal muscle section).
Atrophy of the white pulp and marginal zone, and extramedullary hematopoiesis in the spleen
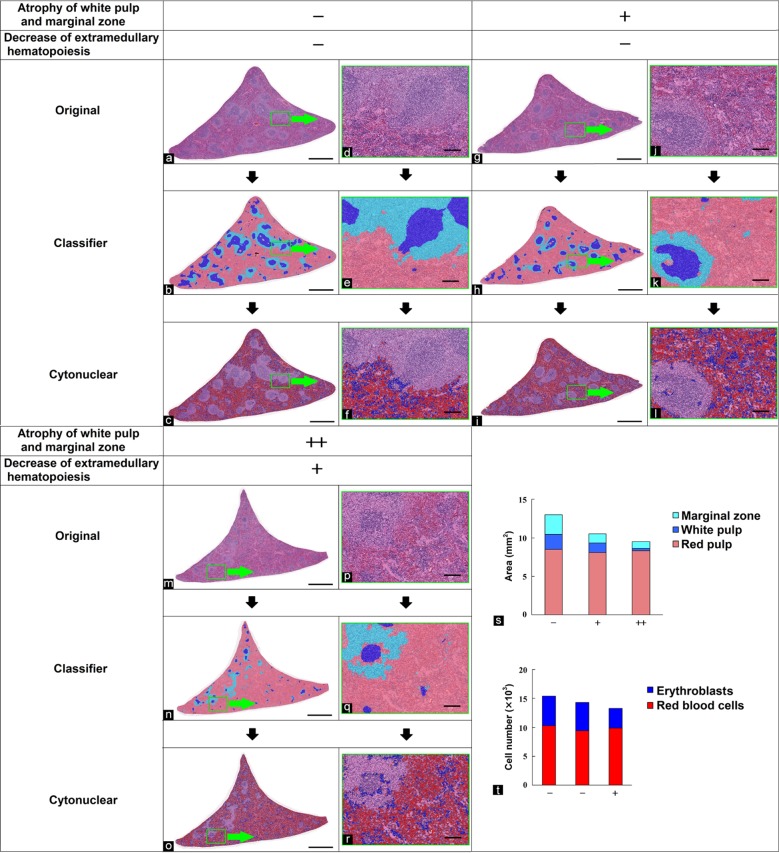
The region of red pulp, white pulp, and marginal zone in the spleen often change as a result of the immune stimulation. The degree of extramedullary hematopoiesis in the spleen is affected by the condition of hematopoiesis in the bone marrow. In this study, atrophy of the white pulp, atrophy of the marginal zone, and extramedullary hematopoiesis were analyzed in the spleen stained with HE. First, the morphological features of the red pulp, white pulp, and marginal zone were learned and separated by the tissue classifier module. Each area of interest was then quantified. Figure 6b, e, h, k, n, and q show the separated images. The results of the quantitative analysis were correlated with the degree of atrophy of the marginal zone graded by pathologists as −, +, or, ++ (Fig. 6s). Next, the cytonuclear module was used to recognize, within the red pulp region separated in the first step, the nuclei of erythroblasts and red blood cells based upon their color tone and size, and each cytoplasmic area was set so as not to overlap neighboring cells. Cell numbers in each area of interest were then quantified. Figure 6c, f, i, l, o, and r show the analyzed images. The results of the quantitative analysis were correlated with the degree of decreased extramedullary hematopoiesis (erythroblasts) graded by pathologists (Fig. 6t).
Fig. 6.
Quantification of the red pulp, white pulp, and marginal zone areas in the spleen and number of erythroblasts in the red pulp. (a, d, g, j, m, p) Original images. (b, e, h, k, n, q) Segmented images of the red pulp (pink), white pulp (blue), and marginal zone (light blue) using the tissue classifier module. (c, f, j, l, o, r) Analyzed images of erythroblasts (blue) and red blood cells (red) using the cytonuclear module. (d–f, j–l, p–r) Enlarged images of green frames in (a–c), (g–i), and (m–o), respectively. Grade of atrophy of the marginal zone evaluated by pathologists: (a, b, d, e) no change, −; (g, h, j, k) slight, +; (m, n, p, q) moderate, ++. Grade of decreased extramedullary hematopoiesis evaluated by pathologists: (a, c, d, f, g, i, j, l) no change, −; (m, o, p, r) slight, +. Bar = 1 mm (a–c, g–i, m–o) and 100 μm (d–f, j–l, p–r). (s) Quantitative results for segmented areas. (t) Quantitative results for erythroblast numbers.
Atrophy of acinar cells in the parotid gland
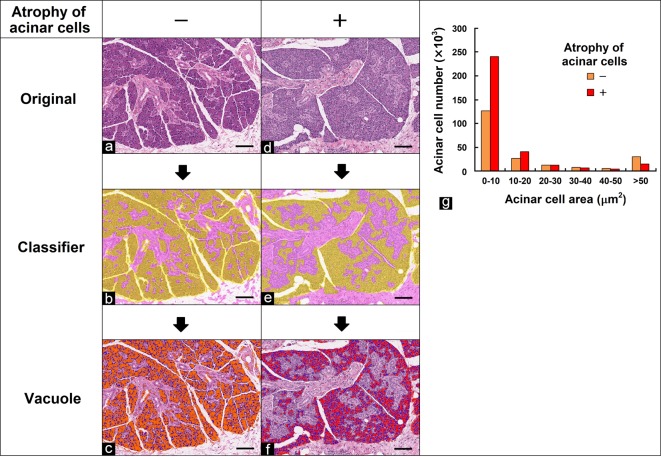
In this study, the size of the acinar cells was analyzed in the parotid gland stained with HE. First, the morphological features of acinar cells and other regions (duct, interstitial connective tissue, and capsule) were learned and separated by the tissue classifier module. Figure 7b and e show the separated images. Next, the area of each acinar cell within the acinar cell region (12.5 mm2 area as wide as possible in the specimen) separated in the first step was quantified using the vacuole module. Although acinar cells are not vacuoles, their morphological features, including their nuclei and distinct contours, are similar to vacuoles. Therefore, each acinar cell could be analyzed by the vacuole module in this study. Figure 7c and f show the analyzed images. The areas of the acinar cells were quantified and sorted in increments of 10 μm2, and the total numbers of acinar cells per size were calculated (Fig. 7g). There was an increased number of smaller acinar cells in the specimen for which the degree of atrophy of the acinar cells was evaluated as +.
Fig. 7.
Quantification of the number of acinar cells in the parotid gland. (a, d) Original images. (b, e) Segmented images of acinar cells (yellow) and other regions (pink) using the tissue classifier module. (c, f) Analyzed images of acinar cell size using the vacuole module. Nuclei are blue. Grade of atrophy of acinar cells evaluated by pathologists: (a, c) no change, − (orange); (d, f) slight, + (red). Bar = 100 μm. (g) Quantitative results for acinar cell size. Total area of acinar cells per size. The numbers of acinar cells within 10-μm2 size fractions ranging from 0 to 50 μm2 and the number of those >50 μm2 in size were calculated.
Conclusion
In this report, we presented several examples of analyses in which various histopathological changes and findings were quantified using HALO. By appropriately training the tissue classifier module to learn the morphological features of each tissue class, the tissues were separated into different classes, and the areas of interest were quantified. Additionally, after separation by the tissue classifier module, each cell was analyzed in detail by another module, such as the cytonuclear or vacuole modules. Although not described in detail in this report, it was possible to analyze and quantify various findings in the liver, adipocyte, sublingual gland, and adrenal grand (Table 1) by using modules that could analyze their morphological features. Furthermore, by using various modules in combination, it will be possible to automatically analyze other findings, not just the examples shown in this report. In fact, many cases of analyses using various modules with HALO have been reported16, 17, 18, 19, 20.
It was hard for the tissue classifier module with the random forest algorithm to recognize more detailed tissue forms such as glomeruli. However, by using deep learning with a conventional neural network, it may be possible in the future to recognize the morphological features of glomerular or other detailed tissue structures of various findings, including those of inflammatory cells, single cell death, or mitosis.
Morphometry and diagnosis are not as popular yet in nonclinical fields compared with clinical cancer diagnosis. However, as shown in this report, various findings in nonclinical fields may be analyzed by using HALO. Each HALO module is specialized for analyzing target morphological features of pathological tissue. The setting of parameters and operation of HALO are simple, making it easy to handle for researchers who lack image analysis experience.
This report only shows typical results of quantitative analysis using several examples. Whether or not a specimen can be analyzed and HALO can be put into practical use for image analysis using the same setting parameters depends on the uniformity of the specimen’s color tone, and the method may need to be validated before each study. However, HALO is not a complicated analysis methods and is user-friendly. This makes it a highly versatile tool in a variety of pathological examinations. In the future, we expect that image analysis of pathological tissue will further develop and that the quantitative data of findings will support pathologic evaluations and image diagnoses and will be used as indicators of drug efficacy or drug toxicity.
Disclosure of Potential Conflicts of Interest
All authors are employees of Mitsubishi Tanabe Pharma Corporation. The authors declare that they have no conflicts of interest.
References
- 1.Kwak JT, Hewitt SM, Kajdacsy-Balla AA, Sinha S, and Bhargava R. Automated prostate tissue referencing for cancer detection and diagnosis. BMC Bioinformatics. 17: 227 2016. [DOI] [PMC free article] [PubMed] [Google Scholar]
- 2.Atupelage C, Nagahashi H, Kimura F, Yamaguchi M, Tokiya A, Hashiguchi A, and Sakamoto M. Computational hepatocellular carcinoma tumor grading based on cell nuclei classification. J Med Imaging (Bellingham). 1: 034501 2014. [DOI] [PMC free article] [PubMed] [Google Scholar]
- 3.Kakimoto T, Kimata H, Iwasaki S, Fukunari A, and Utsumi H. Automated recognition and quantification of pancreatic islets in Zucker diabetic fatty rats treated with exendin-4. J Endocrinol. 216: 13–20. 2013. [DOI] [PubMed] [Google Scholar]
- 4.Kakimoto T, Okada K, Hirohashi Y, Relator R, Kawai M, Iguchi T, Fujitaka K, Nishio M, Kato T, Fukunari A, and Utsumi H. Automated image analysis of a glomerular injury marker desmin in spontaneously diabetic Torii rats treated with losartan. J Endocrinol. 222: 43–51. 2014. [DOI] [PubMed] [Google Scholar]
- 5.Kato T, Relator R, Ngouv H, Hirohashi Y, Takaki O, Kakimoto T, and Okada K. Segmental HOG: new descriptor for glomerulus detection in kidney microscopy image. BMC Bioinformatics. 16: 316 2015. [DOI] [PMC free article] [PubMed] [Google Scholar]
- 6.Horai Y, Kakimoto T, Takemoto K, and Tanaka M. Quantitative analysis of histopathological findings using image processing software. J Toxicol Pathol. 30: 351–358. 2017. [DOI] [PMC free article] [PubMed] [Google Scholar]
- 7.Yoshida H, Shimazu T, Kiyuna T, Marugame A, Yamashita Y, Cosatto E, Taniguchi H, Sekine S, and Ochiai A. Automated histological classification of whole-slide images of gastric biopsy specimens. Gastric Cancer. 21: 249–257. 2018. [DOI] [PubMed] [Google Scholar]
- 8.Yoshida H, Yamashita Y, Shimazu T, Cosatto E, Kiyuna T, Taniguchi H, Sekine S, and Ochiai A. Automated histological classification of whole slide images of colorectal biopsy specimens. Oncotarget. 8: 90719–90729. 2017. [DOI] [PMC free article] [PubMed] [Google Scholar]
- 9.Yamamoto Y, Offord CP, Kimura G, Kuribayashi S, Takeda H, Tsuchiya S, Shimojo H, Kanno H, Bozic I, Nowak MA, Bajzer Ž, and Dingli D. Tumour and immune cell dynamics explain the PSA bounce after prostate cancer brachytherapy. Br J Cancer. 115: 195–202. 2016. [DOI] [PMC free article] [PubMed] [Google Scholar]
- 10.Horai Y, Utsumi H, Ono Y, Kishimoto T, Ono Y, and Fukunari A. Pathological characterization and morphometric analysis of hepatic lesions in SHRSP5/Dmcr, an experimental non-alcoholic steatohepatitis model, induced by high-fat and high-cholesterol diet. Int J Exp Pathol. 97: 75–85. 2016. [DOI] [PMC free article] [PubMed] [Google Scholar]
- 11.Van Cutsem E, Bang YJ, Mansoor W, Petty RD, Chao Y, Cunningham D, Ferry DR, Smith NR, Frewer P, Ratnayake J, Stockman PK, Kilgour E, and Landers D. A randomized, open-label study of the efficacy and safety of AZD4547 monotherapy versus paclitaxel for the treatment of advanced gastric adenocarcinoma with FGFR2 polysomy or gene amplification. Ann Oncol. 28: 1316–1324. 2017. [DOI] [PubMed] [Google Scholar]
- 12.Hagiya AS, Etman A, Siddiqi IN, Cen S, Matcuk GR, Jr, Brynes RK, and Salama ME. Digital image analysis agrees with visual estimates of adult bone marrow trephine biopsy cellularity. Int J Lab Hematol. 40: 209–214. 2018. [DOI] [PubMed] [Google Scholar]
- 13.Guntermann C, Piaia A, Hamel ML, Theil D, Rubic-Schneider T, Del Rio-Espinola A, Dong L, Billich A, Kaupmann K, Dawson J, Hoegenauer K, Orain D, Hintermann S, Stringer R, Patel DD, Doelemeyer A, Deurinck M, and Schümann J. Retinoic-acid-orphan-receptor-C inhibition suppresses Th17 cells and induces thymic aberrations. JCI Insight. 2: e91127 2017. [DOI] [PMC free article] [PubMed] [Google Scholar]
- 14.Breiman L. Random forests. Mach Learn. 45: 5–32. 2001. [Google Scholar]
- 15.Ikemoto-Uezumi M, Uezumi A, Tsuchida K, Fukada S, Yamamoto H, Yamamoto N, Shiomi K, and Hashimoto N. Pro-insulin-like growth factor-ii ameliorates age-related inefficient regenerative response by orchestrating self-reinforcement mechanism of muscle regeneration. Stem Cells. 33: 2456–2468. 2015. [DOI] [PubMed] [Google Scholar]
- 16.Lieberman AP, Yu Z, Murray S, Peralta R, Low A, Guo S, Yu XX, Cortes CJ, Bennett CF, Monia BP, La Spada AR, and Hung G. Peripheral androgen receptor gene suppression rescues disease in mouse models of spinal and bulbar muscular atrophy. Cell Rep. 7: 774–784. 2014. [DOI] [PMC free article] [PubMed] [Google Scholar]
- 17.Ascierto ML, Makohon-Moore A, Lipson EJ, Taube JM, McMiller TL, Berger AE, Fan J, Kaunitz GJ, Cottrell TR, Kohutek ZA, Favorov A, Makarov V, Riaz N, Chan TA, Cope L, Hruban RH, Pardoll DM, Taylor BS, Solit DB, Iacobuzio-Donahue CA, and Topalian SL. Transcriptional mechanisms of resistance to anti-PD-1 therapy. Clin Cancer Res. 23: 3168–3180. 2017. [DOI] [PMC free article] [PubMed] [Google Scholar]
- 18.Karumuthil-Melethil S, Marshall MS, Heindel C, Jakubauskas B, Bongarzone ER, and Gray SJ. Intrathecal administration of AAV/GALC vectors in 10-11-day-old twitcher mice improves survival and is enhanced by bone marrow transplant. J Neurosci Res. 94: 1138–1151. 2016. [DOI] [PMC free article] [PubMed] [Google Scholar]
- 19.Canesin G, Evans-Axelsson S, Hellsten R, Krzyzanowska A, Prasad CP, Bjartell A, and Andersson T. Treatment with the WNT5A-mimicking peptide Foxy-5 effectively reduces the metastatic spread of WNT5A-low prostate cancer cells in an orthotopic mouse model. PLoS One. 12: e0184418 2017. [DOI] [PMC free article] [PubMed] [Google Scholar]
- 20.O’Rourke DM, Nasrallah MP, Desai A, Melenhorst JJ, Mansfield K, Morrissette JJD, Martinez-Lage M, Brem S, Maloney E, Shen A, Isaacs R, Mohan S, Plesa G, Lacey SF, Navenot JM, Zheng Z, Levine BL, Okada H, June CH, Brogdon JL, and Maus MV. A single dose of peripherally infused EGFRvIII-directed CAR T cells mediates antigen loss and induces adaptive resistance in patients with recurrent glioblastoma. Sci Transl Med. 9: eaaa0984 2017. [DOI] [PMC free article] [PubMed] [Google Scholar]


