Abstract
Nonalcoholic fatty liver disease (NAFLD) is a disorder of the liver found worldwide. The molecular mechanisms underlying NAFLD initiation and progression, however, remain poorly understood. In this study, fluorescence difference gel electrophoresis (DIGE) combined with mass spectrometry was performed to profile the intracellular processes in the rat liver at the proteome level when rats were fed a high-fat diet for 8 weeks. Dynamic changes of 27 protein spots were observed. Among them, upregulation of 14 spots and downregulation of 13 spots were observed during the eight weeks of the high fat diet-induction period. These spots were analyzed by matrix-assisted laser desorption/ionization tandem time-of-flight mass spectrometry (MALDI-TOF/TOF), and ultimately 24 proteins were identified with more than 95% confidence. Gene ontology (GO) annotation indicated that these proteins were implicated in the metabolism of carbohydrates, lipids, and amino acids. Four proteins were validated by western blot. Further functional studies on these dynamically changing proteins may lead to a better understanding of the mechanisms of high fat diet-induced fatty liver disease.
Keywords: difference gel electrophoresis, high fat diet, nonalcoholic fatty liver disease, proteomic
Introduction
The liver is one of the most important organs in humans and animals and plays many key roles in life processes1, 2. As a major site of metabolism and detoxification, the liver is the system of choice in studies involving toxicoproteomics and metabolic disorders due to various pathological processes. Liver diseases such as hepatitis, hepatocirrhosis, and liver cancer are among the most common causes of death around the world3, 4. It has been confirmed that the development of fatty liver is the main cause of many chronic liver diseases5.
Recently, nonalcoholic fatty liver disease (NAFLD), which is considered to be the most common liver disease, has been the focus of study6, 7, 8. It is well known that many factors, such as industrial toxins and hepatic viruses, lead to liver damage; what is worse, NAFLD may potentiate these processes9, 10. It has been estimated that approximately 20–30% of adults in the United States and other western countries have excess fat accumulation in their liver. In some developing countries, fatty liver disease also affects a large proportion of the country’s population11, 12. However, the pathogenesis of NAFLD remains largely unknown.
In this study, we wanted to resolve the proteins that are involved in the pathogenesis of NAFLD in the HFD-induced rat liver. To this end, the fluorescent two-dimensional difference gel electrophoresis (2D-DIGE) technique, which was originally introduced to detect differences between two or more biologic samples13, 14, 15, was performed to monitor protein dynamic changes in the rat liver. Dynamic changes of 27 protein spots were found, and 24 proteins were identified with more than 95% confidence. Further functional study of these dynamically changing proteins may lead to better understanding of the mechanisms of high fat diet-induced fatty liver disease.
Materials and Methods
Animal model and experimental protocol
Adult male Sprague Dawley rats, 10 weeks old, weighing 170–200 g were purchased from the Center of Experimental Animals of Sun Yat-sen University (Guangzhou, China). The protocol was approved by the Committee on Experimental Animal Management of Guangxi Normal University. Animals were housed in a pathogen-free environment at room temperature and maintained on rat chow and water for 10 days. After that, the rats were divided randomly into a normal diet group and four groups with high-fat diet (HFD) feeding for 2, 4, 6, and 8 weeks. The basic composition of the standard chow was 4% beef tallow, 15% alpha-corn starch, 14% casein, 1% vitamin mixture, 3.5% mineral mixture, 0.25% choline hydrogen tartrate, 0.18% L-cystine, and 0.0008% t-butylhydroquinone. High-fat diets had the following composition: 40% beef tallow, 15% alpha-corn starch, 14% casein, 10.5% beta-corn starch, 1% vitamin mixture, 10% sugar, 5% cellulose, 3.5% mineral mixture, 0.18% L-cystine, 0.25% choline hydrogen tartrate, and 0.0008% t-butylhydroquinone (W/W per 100 g diet). The body weight of each rat was recorded every week. Rats were fasted 24 hours before sacrifice (animals were euthanized by inhalation of CO2) after the last day of high-fat diet feeding. Livers were rapidly excised and washed with ice-cold PBS buffer three times. After that, the livers were cut into pieces of about 1–2 mm3 and then weighed and immediately frozen in liquid nitrogen. Blood samples were collected from rat hearts into evacuated tubes containing EDTA as an anticoagulant. Plasma was separated within 30 min at 4°C and stored at −80°C.
Biochemical analysis
Alanine aminotransferase (ALT), aspartate aminotransferase (AST), triglyceride (TG), and total cholesterol (TC) concentrations were determined using biochemical kits and methods as described by Zhang et al.16. Triglycerides were assayed using a triglyceride assay kit (Triglyceride GPO-POD assay kit, Shanghai Zhen Biotechnology Co., Shanghai, China), and cholesterol was assayed with a rat cholesterol assay kit (Catalog # 79960, Crystal Chem USA, Elk Grove Village, IL, USA). A rat Alanine Aminotransferase (ALT/GPT) ELISA Kit was purchased from Qayee Bio-Technology Co., Ltd. (Catalog #QY-D0179, Shanghai, China). A rat Aspartate Aminotransferase (AST) ELISA kit was purchased from Cusabio Technology LLC (Code CSB-E13023r, Wuhan, China). Leptin was detected with a Rat ELISA Kit (Catalog #KRC2281, Thermo life, Shanghai, China). Glucose was detected with a Glucose Assay kit (Catalog #KA4088, Abnova, Wuhan, China).
Histological analysis
Liver specimens were fixed in 10% neutral-buffered formalin, embedded in paraffin, sectioned at 4 μm, and stained with hematoxylin and eosin (H&E). Light microscopic examinations were performed.
2D-DIGE and imaging
Protein samples were pooled by treatment group for 2D-DIGE. Then, the pooled samples were dissolved in lysis buffer (7 M urea, 2 M thiourea, 4% CHAPS, 30 mM Tris-HCL, pH 8.5) to produce stock solutions with final concentrations of approximately 5 mg/mL. Cyanine dyes were reconstituted in 99.8% anhydrous dimethyl formamide (DMF) and added to labeling reactions at a ratio of 400 pmol Cy dye to 50 μg protein in different groups following the cross-label rule, according to the manufacturer’s guidelines. The internal standard was created by pooling an aliquot of all biological samples in the experiment and labeling it with one of the Cy dyes (usually Cy2). Briefly, 50 μg of lysate was minimally labeled with 400 pmol Cy2, Cy3, and Cy5 and incubated on ice for at least 30 min in the dark. The labeling reaction was terminated by adding 1 μL 10 mM lysine and incubating the sample on ice for at least 15 min in the dark. Two samples labeled with Cy3 and Cy5 were analyzed on the same gel, together with a pooled sample as an internal standard, which was labeled with Cy2. Prior to isoelectric focusing (IEF), differentially labeled samples to be separated in the same gel were mixed and added to an equal volume of 2× sample buffer (7 M urea, 2 M urea, 4% CHAPS, 130 mM DTT, 2% Pharmalytes 3–10 NL) and ultimately brought to a total of 450 μL by addition of more of the samples dissolved in rehydration buffer (8 M urea, 2% CHAPS, 0.5% Pharmalytes 3–10 NL, 20 mM DTT). 2-DE was performed with Amersham Biosciences (Uppsala, Sweden) IPGphor IEF and Ettan Dalt Twelve electrophoresis units. Precast IPG strips (24 cm, pH 3–10 NL) were used for the separation in the first dimension with a total focusing time of 76 kVh at 15°C. Prior to SDS-PAGE, each strip was equilibrated with 10 mL equilibration buffer A (6 M urea, 50 mM Tris-HCl, pH 8.8, 30% glycerol, 2% SDS, 10 mg/mL DTT) on a rocking table for 15 min, followed by equilibration with 10 mL equilibration buffer B (6 M urea, 50 mM Tris-HCl, pH 8.8, 30% glycerol, 2% SDS, 25 mg/mL iodoacetamide) for another 15 min. The strips were then loaded and run on 12.5% acrylamide gels. The running parameters were a constant power of 15 mA per gel at 15°C for 1 hour, 25 mA per gel at 15°C for 6 hours, and then 30 mA per gel at 15°C until the bromophenol blue dye front had run off the bottom of the gels. Labeled proteins were visualized with the TyphoonTM 9410 imager (GE Healthcare, Uppsala, Sweden). All gels were scanned at 100 nm resolution, and the intensity was adjusted to ensure the maximum volume of each image was within 60,000–90,000 U. Images were cropped to remove areas extraneous to the gel image using ImageQuant V5.2 (Amersham Biosciences, Buckinghamshire, UK) prior to analysis. Gel analysis was performed with DeCyderTM 6.5 (GE Healthcare). Sets of gels were first analyzed, and spots were counted using the differential in-gel analysis (DIA) mode of the DeCyder (GE Healthcare) software package, followed by a comprehensive biological variance analysis (BVA).
In-gel digestion and MS/MS analysis
Gels were fixed and stained with Coomassie brilliant blue. Proteins of interest, as defined by the 2D-DIGE/DeCyder analysis, were excised from the gels and digested by a modified in-gel tryptic digestion procedure. Briefly, gel pieces were washed in 50% ACN and 25 mM NH4HCO3 and then reduced with 10 mM DTT at 37°C and alkylated in the dark with 50 mM iodoacetamide (C2H4INO) at room temperature for 1 h. After vacuum drying, the gel pieces were incubated with sequencing-grade modified trypsin at a concentration of 0.01 mg/mL in 25 mM NH4HCO3 for 16 h at 37°C. Tryptic peptide mixtures were first extracted with 20 μL 5% TFA at 40°C for 1 h and then re-extracted with the same volume of 2.5% TFA/50% ACN at 30°C for another 1 h. The extracted solutions were blended, lyophilized, and used for identification by MALDI-TOF/TOF: peptide extracts were dissolved in 4 μL saturated matrix (7 mg/mL CHCA in 0.5% v/v TFA and 50% v/v ACN), and 0.6 μL of the mixture was spotted manually onto an ABI MALDI target plate. The spots were allowed to dry and then put into an ABI 4800 Proteomics Analyzer (Applied Biosystems, Framingham, MA, USA) equipped with a 200 Hz frequency-tripled Nd:YAG laser, operating at a wavelength of 355 nm and a repetition rate of 200 Hz in both MS and MS/MS modes. The laser intensity was set at 4,300, and ions were collected between 700 Da and 4,000 Da. All of the acquired MS spectra represented signal averaging of 1,050 laser shots. The five most intense peptide spots with S/N exceeding 100 were selected and subjected to MS/MS analysis. MS/MS spectra were searched against the IPI rat database (v4.33) by GPS Explorer Software v2.0 (with MASCOT as the database search engine). The following search criteria were used: trypsin specificity, cysteine carbamidomethylation (C), and methionine oxidation (M) as variable modifications, 2 trypsin miscleavages allowed, 50 ppm MS tolerance, and 0.5 Da MS/MS tolerance.
Western blot analysis
Ten micrograms of protein were separated on 10% polyacrylamide gels and transferred to PVDF membranes (Amersham Pharmacia Biotech, Buckinghamshire, UK). Blots were blocked with 5% nonfat milk in TBS buffer with 0.1% Tween 20 (TBST) and then developed with diluted antibodies: anti-apolipoprotein monoclonal antibody (diluted 1:1,000, Abcam, Cambridge, UK), anti-malate dehydrogenase antibody (diluted 1:1,000, Abcam), anti-pyruvate dehydrogenase antibody (diluted 1:1,000, Santa Cruz Biotechnology, Dallas, TX, USA) and anti-GAPDH antibody (diluted 1:1,000, Santa Cruz Biotechnology) at 4°C overnight, followed by incubation with HRP-conjugated secondary antibodies for one hour prior to visualization of the bands with ECL reagents (Santa Cruz Biotechnology)17. All of the membranes were exposed to X-ray film and scanned with a GS-710 scanner (Bio-Rad, Hercules, CA, USA).
Statistical analyses
Data are expressed as means ± SEM. The statistical significance of differences was assessed by Student’s t-tests, and values of p<0.05 were considered statistically significant.
Results
Effect of high-fat diet on rats
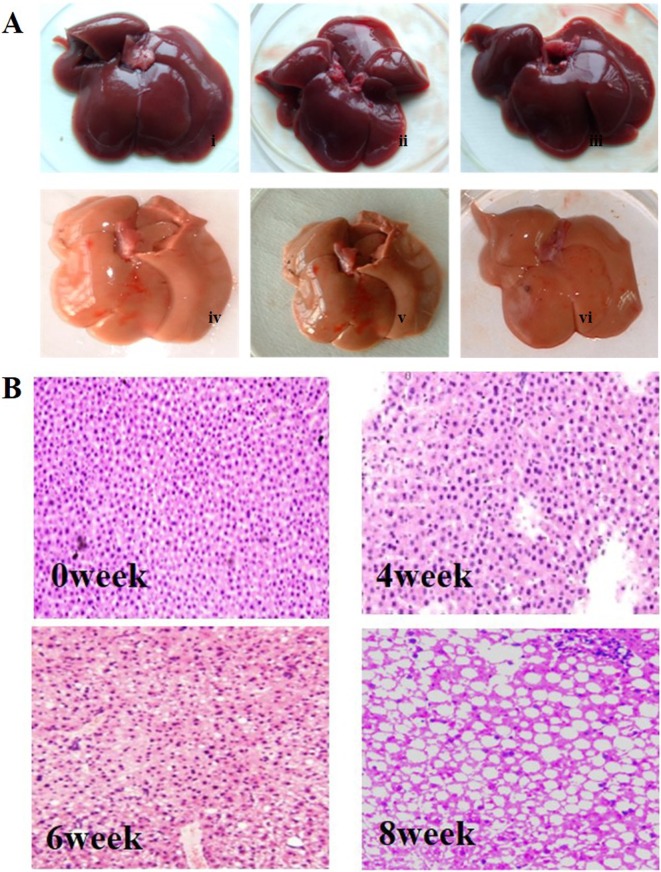
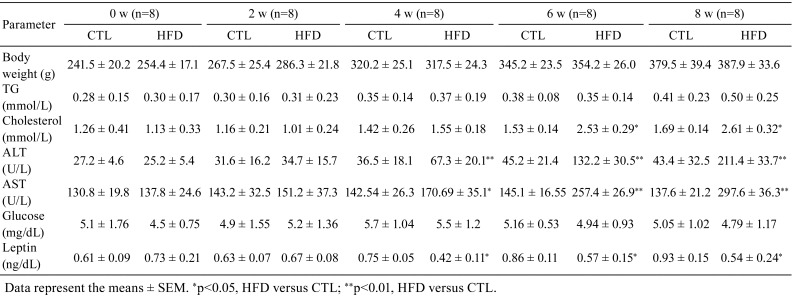
Adult rats were sacrificed after feeding them a high-fat diet for 8 weeks. The livers were rapidly excised and washed three times with PBS. Images were taken, and liver sections were stained with H&E. As shown in Fig. 1, after 6–8 weeks of HFD treatment, fatty liver disease symptoms were significantly observed. We found that the liver became yellow after 8 weeks of HFD feeding compared with the liver in the normal group, and the yellow liver atrophied and became brittle (Fig. 1A). HE staining showed that most of the hepatic lobules lost their normal architecture and morphology after 6–8 weeks of HFD treatment, while no histological abnormalities were observed in the control group (Fig. 1B). At 6 weeks of HFD treatment, fat droplets were significantly increased, with mild to moderate infiltration of inflammatory cells. By 8 weeks, most of the hepatic lobules had lost their normal structure, and a large number of macrovesicular droplets appeared (Fig. 1B). Routine blood testing showed that the levels of ALT, AST, and cholesterol were markedly increased and that leptin was significantly decreased after 4 weeks of HFD treatment. However, the HFD had no effect on body weight, TG, or blood glucose levels (Table 1). Together, these data indicate that hepatic steatosis and steatohepatitis were successfully induced by the HFD.
Fig. 1.
Effect of HFD on liver hepatic pathology. A, Photograph of rat liver tissue (i–iii, control group; iv–vi, HFD induction for 8 weeks). B, Representative images of hematoxylin and eosin-stained liver from rats fed a high-fat diet for different periods are shown (×200).
Table 1. Biochemical Parameters in the Different Groups.
The fluorescent 2D-DIGE analysis
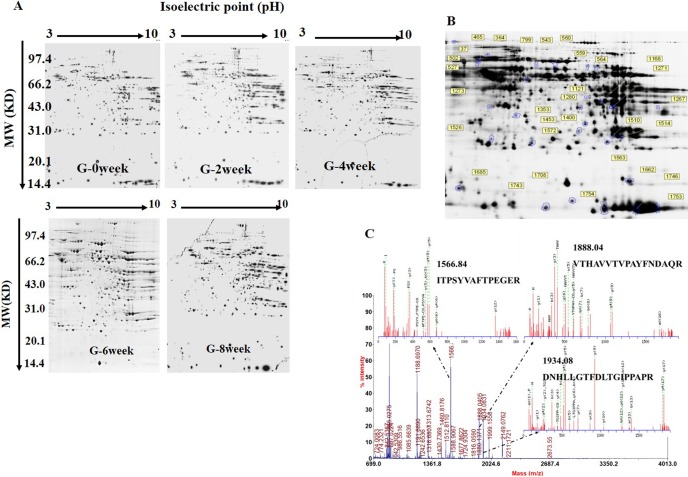
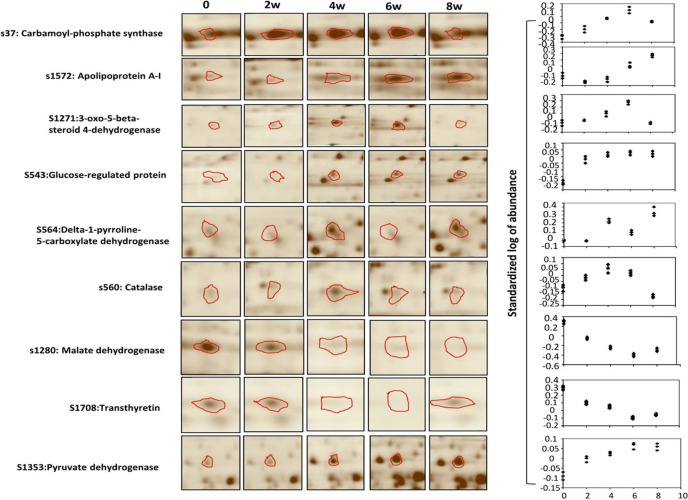
The major goal of this study was to determine the dynamic changes in the rat liver proteome during feeding with a high-fat diet. To this end, liver samples from rats fed the high-fat diet for 0, 2, 4, 6, and 8 weeks were collected and subjected to 2D-DIGE. The SDS-PAGE gels were stained and analyzed with the DeCyderTM 6.5 software (GE Healthcare). As shown in Fig. 2A, the protein spots in the gels were similar and widely distributed, and there were no obvious interference stripes or protein gathering phenomena. Image analysis showed that an average of 1,626 (1,577 ± 49, n=6 Cy2 images) protein spots were detected (Fig. 2A and B). Then, the BVA module of the DeCyderTM6.5 software was used to analyze the protein spot changes at each time point. According to the ANOVA test, there were 27 spots that exhibited statistically significant dynamic expression changes across all five experimental time points (1-ANOVA, p<0.05) (Fig. 2B). The dynamic changes in the protein spots in the five experimental groups were determined by BVA according to the ratios of log sample/standard. Twenty-seven protein spots exhibited significant up- or downregulated expression over time. The dynamic change profiles of the partial spots are shown in Fig. 3.
Fig. 2.
DIGE images of differentially expressed protein spots. A, Two-dimensional DIGE images of the control and HFD-induced rats for 0 week, 2 weeks, 4 weeks, 6 weeks, and 8 weeks. B, Protein spots with significant changes were labeled and identified. Spot numbers correspond to those in Supplementary Table 1: online only. pH 3–10, 300 μg proteins were loaded. C, The sequences of the precursor at m/z 1566.84, 1888.04, and 1943.08 were analyzed by MS/MS and found to be ITPSYVAFTPEGER, VTHAVVTVPAYFNDAQR, and DNHLLGTFDLTGIPPAPR. This protein was identified to be the glucose-regulated protein precursor after a database search.
Fig. 3.
The dynamic profiles of some key protein spots. Graphical representations of partial protein spots that showed dynamic changes during the 8 weeks of HFD induction; the left panel shows the images of the spots in the 2D gel. The volume of each spot was calculated and normalized by the Decyder-DIA software (right panel). Values are indicated as the standardized log of abundance.
Identification of differentially expressed proteins
These 27 differentially expressed protein spots were picked from the preparative gels, digested by trypsin, and analyzed by mass spectrometry (MALDI-TOF/TOF MS/MS). The obtained protein PMF and MS/MS data were submitted to the Rat IPI 4.33 database. Finally, 24 proteins were successfully identified (Supplementary Table 1, Supplementary data: online only). One such protein was spot 534, which was identified as the glucose-regulated protein precursor through Mascot analysis; the matching peptides were ITPSYVAFTPEGER, VTHAVVTVPAYFNDAQR, DNHLLGTFDLTGIPPAPR, and SDIDEIVLVGGSTR (Fig. 2C).
Annotation of differentially expressed proteins
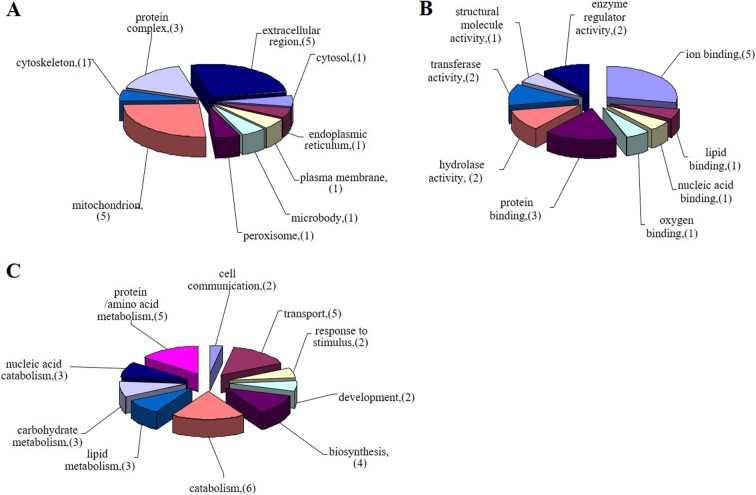
To further understand the functions of the differentially expressed proteins, gene ontology annotation was performed by using the GOfact tool (http://61.50.138.118/gofact/). As shown in Fig. 4, each protein was linked to at least one Gene Ontology (GO) annotation category. Among them, 22 proteins were assigned to biological processes, 21 proteins were mapped to cellular components, and 24 proteins were involved in molecular function ontology. We found that most of the proteins were located in the mitochondria and extracellular matrix, among which were 5 proteins located in the mitochondria and 5 proteins annotated as extracellular matrix proteins; the other proteins were located in the endoplasmic reticulum, cytoskeleton, and microorganella (Fig. 4A). For biological processes, 14 proteins were identified as metabolism-related proteins, among which were 3 proteins involved with carbohydrates, 3 proteins related to lipid metabolism, 3 proteins involved in nucleic acid metabolism, and 5 proteins involved in amino acid metabolism; 4 proteins were related to biosynthesis; 2 proteins were involved in the response to stress; 2 proteins were related to cell communication; 2 proteins were related to development; and the other 5 proteins were involved in intracellular substance transfers (Fig. 4B). In the molecular function category, 3 GO terms in the binding and catalytic activity groups were enriched. Binding proteins were the major subcategory, including ion binding, protein binding, lipid binding, and nucleic binding (Fig. 4C).
Fig. 4.
Gene ontology annotation of identified proteins. Identified proteins were categorized based upon their subcellular location (A), biological process (B), and molecular function (C). Values in these pie charts represent the number of proteins found in that respective category for all submitted proteins with GO annotation.
Protein validation by western blot
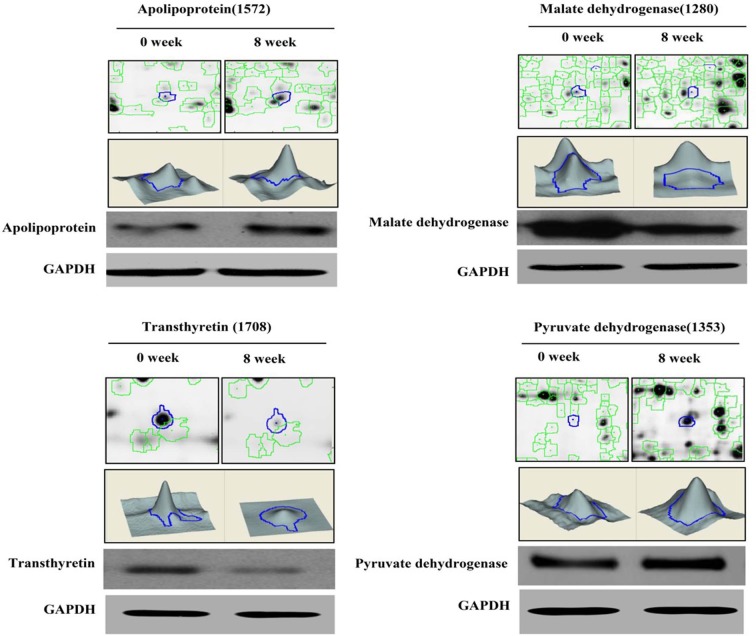
Twenty-four proteins with a dynamic change profile were identified in the rats fed the HFD. To verify these DIGE results, protein samples from these experiments were further analyzed by western blot. As shown in Fig. 5, the 2D and 3D dynamic change maps of four protein spots changed in response to the high-fat diet for 8 weeks, and the western blotting results confirmed these results; we found that apolipoprotein A-I precursor and pyruvate dehydrogenase E1 were significantly increased after 8 weeks of HFD feeding. However, the expression levels of malate dehydrogenase and transthyretin precursor were downregulated.
Fig. 5.
Protein quantitative confirmation with western blotting. The two-dimensional and three-dimensional fluorescence intensity profiles of spots 1,572, 1,280, 1,353, and 1,708 at the 0- and 8-week time points are shown. These proteins and the changes in expression were validated by western blot.
Discussion
NAFLD is now considered to be the most common liver disease around the world, and the disease can progress slowly from simple nonalcoholic steatosis (NAS) to nonalcoholic steatohepatitis (NASH) and subsequently to hepatic fibrosis, cirrhosis of the liver, and hepatoma18, 19; however, the molecular mechanisms underlying NAFLD initiation and progression remain poorly understood. Proteomics is widely used to study the dynamic changes of proteins in tissues and organs under physiological or pathological conditions20, 21, 22, 23, 24, 25, 26. For instance, You et al. analyzed the protein profile and function of liver mitochondria from rats with nonalcoholic steatohepatitis by using a proteomic strategy24. Using an LC-MS/MS combined label-free quantitative strategy, Rao et al. analyzed the high-density lipoprotein particles in patients with nonalcoholic fatty liver disease25. Spanos et al. found by using iTRAQ combined with a nano-LC-MS/MS assay that dysregulation of GLO1 implicates the acetylation-ubiquitination degradation pathway in nonalcoholic fatty liver disease26. In the present study, 2D-DIGE technology was used to systematically analyze the liver proteome during NAFLD in the HFD-induced rat, and the results will be helpful in elucidating the mechanisms involved in the progression of NAFLD.
Twenty-seven protein spots with dynamic changes were successfully observed in the present study, among which were 24 proteins identified by mass spectrometry. The gene ontology analysis showed that most of these proteins are metabolism-related proteins, including carbohydrate metabolism-related proteins (such as pyruvate dehydrogenase E1 component subunit beta, Pdhb; aldose 1-epimerase, Galm; malate dehydrogenase, Mdhl; and triosephosphate isomerase, Tpil), lipid metabolism-related proteins (apolipoprotein A-I precursor, Apoal; 3-oxo-5-beta-steroid 4-dehydrogenase, as known as aldo-keto reductase family 1 member D1, Akr1D1), and amino acid and derivative metabolism-related proteins. Pdhb and Mdhl are two important enzymes in the TCA cycle. Pdhb participates in the transformation of pyruvic acid into acetyl CoA27, and Mdhl catalyzes malic acid into oxaloacetic acid28. We found that the expression of Pdhb was significantly increased in the rat liver after 8 weeks of HFD induction. Interestingly, the expression of Mdhl was dramatically decreased during the HFD-induction process. The upregulation of Pdhb suggested the acetyl CoA content increased during the HFD-induced process; however, the downregulation of Mdhl restrained the transformation of malic acid into oxaloacetic acid, which led to the TCA cycle pathway being suppressed, which resulted in a disorder of energy metabolism in liver cells.
Apolipoprotein is mainly synthesized in the liver and small bowel. ApoAI is the chief component of high-density lipoprotein (HDL)29. It is well known that ApoAI is an especially important factor in the cholesterol reverse transportation process, and it can be combined with lecithin, a variety of plasma factors, and cell membrane receptors, as well as participate in plasma protein secretion and subsequently regulate HDL metabolism30. In this study, we found that the expression of ApoAI was decreased in the early stages of HFD induction (0–4 weeks) and then increased in the later stages (6–8 weeks). It has been generally thought that a decline of ApoAI is related to viral hepatitis, liver cirrhosis, and liver cancer. However, an increase in ApoAI was found to be closely related to alcoholic hepatitis and high lipoprotein-α (Lp-α). This result indicates that there may be a different mechanism between high fat diet-induced liver tissue lesions and viral infection that leads to liver lesions.
Akr1D1 is an oxidoreductase that participates in bile acid synthesis and corticosteroid metabolism31, 32, 33. In this study, we found that the expression of Akr1D1 was increased during the first 6 weeks and then significantly decreased at the 8-week point. Many studies have shown that liver bile acid is one of the important markers of anomalous changes during liver damage. Collectively, our data suggest that a distinct change of Akr1D1 in liver tissue indicates that a subclinical hepatic injury may be occurring.
Many publications have shown that the most important pathogenesis of fatty hepatitis is free radical-mediated liver damage, which mainly manifests as an oxidation product increase and/or a reduction in antioxidant effect34, 35. It is well known that during the process of final pathogenesis of NAFLD, ROS are created, which would initiate an oxygen stress response and lead to lipid peroxidation and liver antioxidant system abnormalities36. In this study, we found that catalase, which is related to hydrogen peroxide metabolism, increased and reached a peak at 4 weeks and then significantly decreased. The dramatic change in catalase levels shows that there was an adjustment mechanism for high-fat diet processing in rats, which is consistent with previous reports37, 38.
In summary, we adopted DIGE technology to monitor the dynamic change of proteins during the fatty liver formation process and found that 27 protein spots had dynamic changes, among which were 24 successfully identified proteins. GO annotation indicated that these proteins were implicated in the metabolism of carbohydrates, lipids, and amino acids. At present, the relationship between the changes in the expression of these proteins and the formation of fatty liver is not very clear. An in-depth study of these proteins will provide meaningful clues about the pathogenesis of fatty liver and early prevention and diagnosis.
Disclosure of Potential Conflicts of Interest
The authors declare no conflict of interest.
Supplemental Table
Proteins identified by 2-D DIGE and MALDI-TOF-TOF
Supplemental materials.
Acknowledgments
This work was supported by grants from the Chinese Natural Science Foundation (No. 31660242, 81770310), the Guangxi Natural Science Foundation (No. 2016GXNSFCB380001, 2017GXNSFFA198003), and the Key State Laboratory Talent Project (No. CMEMR2016-A01).
References
- 1.Chen M, Ying W, Song Y, Liu X, Yang B, Wu S, Jiang Y, Cai Y, He F, and Qian X. Analysis of human liver proteome using replicate shotgun strategy. Proteomics. 7: 2479–2488. 2007. [DOI] [PubMed] [Google Scholar]
- 2.Beretta L. HUPO’s effort to define the liver proteome. J Proteome Res. 9: 637–638. 2010. [DOI] [PMC free article] [PubMed] [Google Scholar]
- 3.Davis GL, and Keeffe EB. Advances in liver disease. Highlights from the 51st Annual Meeting of the American Association for the Study of Liver Diseases, October 27-31, 2000, Dallas, TX. Rev Gastroenterol Disord. 1: 42–47. 2001. [PubMed] [Google Scholar]
- 4.Jacobson IM, Davis GL, El-Serag H, Negro F, and Trépo C. Prevalence and challenges of liver diseases in patients with chronic hepatitis C virus infection. Clin Gastroenterol Hepatol. 8: 924–933, quiz e117. 2010. [DOI] [PubMed] [Google Scholar]
- 5.Bernal Reyes R. [Liver diseases. Non-alcoholic fatty liver disease]. Rev Gastroenterol Mex. 75(Suppl 1): 181–183. 2010. [PubMed] [Google Scholar]
- 6.Mikolasevic I, Milic S, Racki S, Zaputovic L, Stimac D, Radic M, Markic D, and Orlic L. Nonalcoholic fatty liver disease (NAFLD)-a new cardiovascular risk factor in peritoneal dialysis patients. Perit Dial Int: 427–432. 2016. [DOI] [PMC free article] [PubMed] [Google Scholar]
- 7.Marrero JA, Fontana RJ, Su GL, Conjeevaram HS, Emick DM, and Lok AS. NAFLD may be a common underlying liver disease in patients with hepatocellular carcinoma in the United States. Hepatology. 36: 1349–1354. 2002. [DOI] [PubMed] [Google Scholar]
- 8.Younossi ZM, Otgonsuren M, Henry L, Venkatesan C, Mishra A, Erario M, and Hunt S. Association of nonalcoholic fatty liver disease (NAFLD) with hepatocellular carcinoma (HCC) in the United States from 2004 to 2009. Hepatology. 62: 1723–1730. 2015. [DOI] [PubMed] [Google Scholar]
- 9.Allard JP. Other disease associations with non-alcoholic fatty liver disease (NAFLD). Best Pract Res Clin Gastroenterol. 16: 783–795. 2002. [DOI] [PubMed] [Google Scholar]
- 10.Almobarak AO, Barakat S, Khalifa MH, Elhoweris MH, Elhassan TM, and Ahmed MH. Non alcoholic fatty liver disease (NAFLD) in a Sudanese population: What is the prevalence and risk factors? Arab J Gastroenterol. 15: 12–15. 2014. [DOI] [PubMed] [Google Scholar]
- 11.Adams LA, Lymp JF, St Sauver J, Sanderson SO, Lindor KD, Feldstein A, and Angulo P. The natural history of nonalcoholic fatty liver disease: a population-based cohort study. Gastroenterology. 129: 113–121. 2005. [DOI] [PubMed] [Google Scholar]
- 12.Matteoni CA, Younossi ZM, Gramlich T, Boparai N, Liu YC, and McCullough AJ. Nonalcoholic fatty liver disease: a spectrum of clinical and pathological severity. Gastroenterology. 116: 1413–1419. 1999. [DOI] [PubMed] [Google Scholar]
- 13.Tannu NS, and Hemby SE. Two-dimensional fluorescence difference gel electrophoresis for comparative proteomics profiling. Nat Protoc. 1: 1732–1742. 2006. [DOI] [PMC free article] [PubMed] [Google Scholar]
- 14.Qian WJ, Jacobs JM, Liu T, Camp DG, 2nd , and Smith RD. Advances and challenges in liquid chromatography-mass spectrometry-based proteomics profiling for clinical applications. Mol Cell Proteomics. 5: 1727–1744. 2006. [DOI] [PMC free article] [PubMed] [Google Scholar]
- 15.Gharbi S, Gaffney P, Yang A, Zvelebil MJ, Cramer R, Waterfield MD, and Timms JF. Evaluation of two-dimensional differential gel electrophoresis for proteomic expression analysis of a model breast cancer cell system. Mol Cell Proteomics. 1: 91–98. 2002. [DOI] [PubMed] [Google Scholar]
- 16.Zhang X, Yang J, Guo Y, Ye H, Yu C, Xu C, Xu L, Wu S, Sun W, Wei H, Gao X, Zhu Y, Qian X, Jiang Y, Li Y, and He F. Functional proteomic analysis of nonalcoholic fatty liver disease in rat models: enoyl-coenzyme a hydratase down-regulation exacerbates hepatic steatosis. Hepatology. 51: 1190–1199. 2010. [DOI] [PubMed] [Google Scholar]
- 17.Chen M, Wang Y, Zhao Y, Wang L, Gong J, Wu L, Gao X, Yang Z, and Qian L. Dynamic proteomic and metabonomic analysis reveal dysfunction and subclinical injury in rat liver during restraint stress. Biochim Biophys Acta. 1794: 1751–1765. 2009. [DOI] [PubMed] [Google Scholar]
- 18.Feldstein AE, Werneburg NW, Canbay A, Guicciardi ME, Bronk SF, Rydzewski R, Burgart LJ, and Gores GJ. Free fatty acids promote hepatic lipotoxicity by stimulating TNF-alpha expression via a lysosomal pathway. Hepatology. 40: 185–194. 2004. [DOI] [PubMed] [Google Scholar]
- 19.Schmöcker C, Weylandt KH, Kahlke L, Wang J, Lobeck H, Tiegs G, Berg T, and Kang JX. Omega-3 fatty acids alleviate chemically induced acute hepatitis by suppression of cytokines. Hepatology. 45: 864–869. 2007. [DOI] [PubMed] [Google Scholar]
- 20.Bell LN, Theodorakis JL, Vuppalanchi R, Saxena R, Bemis KG, Wang M, and Chalasani N. Serum proteomics and biomarker discovery across the spectrum of nonalcoholic fatty liver disease. Hepatology. 51: 111–120. 2010. [DOI] [PMC free article] [PubMed] [Google Scholar]
- 21.Yilmaz Y. Serum proteomics for biomarker discovery in nonalcoholic fatty liver disease. Clin Chim Acta. 413: 1190–1193. 2012. [DOI] [PubMed] [Google Scholar]
- 22.Nuño-Lámbarri N, Barbero-Becerra VJ, Uribe M, and Chávez-Tapia NC. Mitochondrial molecular pathophysiology of nonalcoholic fatty liver disease: a proteomics approach. Int J Mol Sci. 17: 281 2016. [DOI] [PMC free article] [PubMed] [Google Scholar]
- 23.Tsai MT, Chen YJ, Chen CY, Tsai MH, Han CL, Chen YJ, Mersmann HJ, and Ding ST. Identification of potential plasma biomarkers for nonalcoholic fatty liver disease by integrating transcriptomics and proteomics in laying hens. J Nutr. 147: 293–303. 2017. [DOI] [PubMed] [Google Scholar]
- 24.You Y, Zhang Y, Lu Y, Hu K, Qu X, Liu Y, Lu B, and Jin L. Protein profiling and functional analysis of liver mitochondria from rats with nonalcoholic steatohepatitis. Mol Med Rep. 16: 2379–2388. 2017. [DOI] [PMC free article] [PubMed] [Google Scholar]
- 25.Rao PK, Merath K, Drigalenko E, Jadhav AYL, Komorowski RA, Goldblatt MI, Rohatgi A, Sarzynski MA, Gawrieh S, and Olivier M. Proteomic characterization of high-density lipoprotein particles in patients with non-alcoholic fatty liver disease. Clin Proteomics. 15: 10 2018. [DOI] [PMC free article] [PubMed] [Google Scholar]
- 26.Spanos C, Maldonado EM, Fisher CP, Leenutaphong P, Oviedo-Orta E, Windridge D, Salguero FJ, Bermúdez-Fajardo A, Weeks ME, Evans C, Corfe BM, Rabbani N, Thornalley PJ, Miller MH, Wang H, Dillon JF, Quaglia A, Dhawan A, Fitzpatrick E, and Bernadette Moore J. Proteomic identification and characterization of hepatic glyoxalase 1 dysregulation in non-alcoholic fatty liver disease. Proteome Sci. 16: 4 2018. [DOI] [PMC free article] [PubMed] [Google Scholar]
- 27.Patel MS, Korotchkina LG, and Sidhu S. Interaction of E1 and E3 components with the core proteins of the human pyruvate dehydrogenase complex. J Mol Catal, B Enzym. 61: 2–6. 2009. [DOI] [PMC free article] [PubMed] [Google Scholar]
- 28.Kim SY, Lee PY, Shin HJ, Kim DH, Kang S, Moon HB, Kang SW, Kim JM, Park SG, Park BC, Yu DY, Bae KH, and Lee SC. Proteomic analysis of liver tissue from HBx-transgenic mice at early stages of hepatocarcinogenesis. Proteomics. 9: 5056–5066. 2009. [DOI] [PubMed] [Google Scholar]
- 29.Aldred S, Sozzi T, Mudway I, Grant MM, Neubert H, Kelly FJ, and Griffiths HR. Alpha tocopherol supplementation elevates plasma apolipoprotein A1 isoforms in normal healthy subjects. Proteomics. 6: 1695–1703. 2006. [DOI] [PubMed] [Google Scholar]
- 30.Ogasawara K, Mashiba S, Hashimoto H, Kojima S, Matsuno S, Takeya M, Uchida K, and Yajima J. Low-density lipoprotein (LDL), which includes apolipoprotein A-I (apoAI-LDL) as a novel marker of coronary artery disease. Clin Chim Acta. 397: 42–47. 2008. [DOI] [PubMed] [Google Scholar]
- 31.Jiang J, Nilsson-Ehle P, and Xu N. Influence of liver cancer on lipid and lipoprotein metabolism. Lipids Health Dis. 5: 4 2006. [DOI] [PMC free article] [PubMed] [Google Scholar]
- 32.Di Costanzo L, Drury JE, Christianson DW, and Penning TM. Structure and catalytic mechanism of human steroid 5beta-reductase (AKR1D1). Mol Cell Endocrinol. 301: 191–198. 2009. [DOI] [PMC free article] [PubMed] [Google Scholar]
- 33.Lee WH, Lukacik P, Guo K, Ugochukwu E, Kavanagh KL, Marsden B, and Oppermann U. Structure-activity relationships of human AKR-type oxidoreductases involved in bile acid synthesis: AKR1D1 and AKR1C4. Mol Cell Endocrinol. 301: 199–204. 2009. [DOI] [PubMed] [Google Scholar]
- 34.Kumar A, Sharma A, Duseja A, Das A, Dhiman RK, Chawla YK, Kohli KK, and Bhansali A. Patients with nonalcoholic fatty liver disease (NAFLD) have higher oxidative stress in comparison to chronic viral hepatitis. J Clin Exp Hepatol. 3: 12–18. 2013. [DOI] [PMC free article] [PubMed] [Google Scholar]
- 35.Madan K, Bhardwaj P, Thareja S, Gupta SD, and Saraya A. Oxidant stress and antioxidant status among patients with nonalcoholic fatty liver disease (NAFLD). J Clin Gastroenterol. 40: 930–935. 2006. [DOI] [PubMed] [Google Scholar]
- 36.Suh SK, Hood BL, Kim BJ, Conrads TP, Veenstra TD, and Song BJ. Identification of oxidized mitochondrial proteins in alcohol-exposed human hepatoma cells and mouse liver. Proteomics. 4: 3401–3412. 2004. [DOI] [PubMed] [Google Scholar]
- 37.Walsh K, and Alexander G. Alcoholic liver disease. Postgrad Med J. 76: 280–286. 2000. [DOI] [PMC free article] [PubMed] [Google Scholar]
- 38.Angulo P. Nonalcoholic fatty liver disease. N Engl J Med. 346: 1221–1231. 2002. [DOI] [PubMed] [Google Scholar]
Associated Data
This section collects any data citations, data availability statements, or supplementary materials included in this article.
Supplementary Materials
Proteins identified by 2-D DIGE and MALDI-TOF-TOF


