Abstract
A two-stage cultivation method involving the initial growth in optimized conditions for biomass production followed by those for lipid production in oleaginous brackish diatom Navicula phyllepta MACC8 resulted in a proportional increase of lipid concentration along with biomass production. The diatom was further subjected to stress conditions by altering the nutrient components such as nitrate, phosphate, silicate, and temperature. Silicon deprivation resulted in the highest lipid percentage of 28.78% of weight at the end of the 18th day of the second stage. A significant increase in lipid content was observed on the complete removal of the nutrients silicon and urea one at a time, while the biomass showed a considerable reduction. The application of multiple nutrient stress conditions had a profound influence on the increased rate of lipid production. A combination of phosphate deprivation, silicate limitation and temperature reduction resulted in a significant increase in lipid percentage of 32.13% at the cost of reduced biomass (1.1 g L−1), whereas phosphate deprivation, urea limitation, and temperature reduction resulted in lipid percentage of 27.58% with a biomass of 1.44 g L−1 at the end of the second stage. Further, the results were supported by Nile red staining, FTIR, fatty acid profile and oxidative stress marker analyses. The changes in biochemical composition and oxidative stress parameters within the various stress conditions demonstrated the profound influence of the selected stress factors on the biodiesel productivity of the diatom, besides its stress tolerance. A two-phase culturing system, with multifactor stress application, especially nitrogen limitation along with phosphate starvation and temperature stress, would be the suitable method for gaining maximum biomass productivity and lipid content in diatom Navicula phyllepta MACC8 towards biofuel production.
Keywords: Navicula phyllepta, Biofuel, Two-stage cultivation, Nutrient stress, Biomass production, Lipid percentage
Introduction
Microalgal storage lipids have gathered increasing attention as storage organelles for biofuel molecules, though the understanding of the real dynamics behind their biosynthesis is lacking (Merchant et al. 2012). It is a very well-investigated fact that the formation of lipid droplets in microalgae is triggered by cellular stresses such as nutrient deprivation, high light exposure and temperature fluctuation (Pal et al. 2011; Taleb et al. 2018). Among those stresses, nutrient deprivation is easily accomplished through a change in growth medium composition and is widely used to induce lipid accumulation inside the microalgal cells experimentally and can be reversed easily by replenishing the nutrients in the growth medium (Chen et al. 2017). However, the main challenge for this strategy is to improve lipid yield while maintaining biomass productivity (Tan and Lee 2016). To overcome this challenge, the two-stage cultivation was adopted to improve the lipid yield without affecting the biomass in which the microalgae are initially grown under nutrient-sufficient conditions to obtain maximum cell density and thereafter the cultivation conditions are altered (mostly limited) to trigger the accumulation of lipid droplets inside the cell (Farooq et al. 2013; Doan and Obbard 2014; Ratnapuram et al. 2018).
Despite several economic benefits, the main limitation of the two-stage cultivation is that most of the results are strain specific, and hence its efficiency may vary. In contrast to a large number of studies on nutrient limitation in phytoplankton growth (Liang et al. 2013; Benvenuti et al. 2015), there are fewer reports on the effects of nutrient limitation on marine diatoms (Gobler et al. 2006; Lin et al. 2018). The present study aimed to identify the main stress factors enhancing the lipid production in the biofuel potent brackish diatom Navicula phyllepta in a two-stage cultivation system and also to understand the subsequent biochemical changes during various stress conditions.
Materials and methods
Diatom culture
Navicula phyllepta MACC8 (KC178569), a pennate diatom, was isolated from brackish waters of Cochin estuary (9°55′35″N, 96°17′53″E), India and maintained at the Culture Collection of National Centre for Aquatic Animal Health, Kochi, Kerala. The strain was cultured in a modified seawater medium (Sabu et al. 2017a) under 27 μmol m−2 s−1 at 26–28 °C with 16:8 light and dark photoperiods. Navicula phyllepta MACC8 had proved to be a potent candidate for biodiesel production upon multi-criterion screening and the culture conditions were statistically optimized for high productivity through our earlier studies (Sabu et al. 2017a, b)
Two-stage cultivation approach—design of experiments
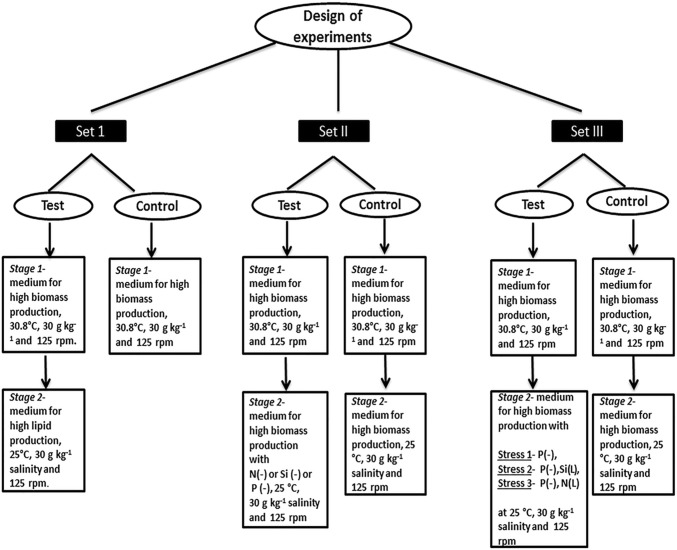
To determine the effect of a two-stage cultivation approach towards enhanced lipid production without comprising biomass, three sets of experiments were conducted as given in Fig. 1.
Fig. 1.
Flow diagram showing the different sets of experiments adopted in the study
Set I: Growth under conditions optimized for high biomass production followed by growth in conditions optimized for enhanced lipid production
Batch culture of 150 mL of modified seawater medium with composition and growth conditions optimized for high biomass production was used in the first stage of culturing. The medium contained 4.89 mM sodium metasilicate, 0.90 mM urea, 0.1 mM sodium dihydrogen phosphate, 0.05 mM ferric chloride and 0.2 mM disodium EDTA. The diatom cells at the exponential phase of growth with a cell density of 1.5 × 10⁶ cells mL−1 were inoculated (10% of total volume) into the medium and cultured at 30.8 °C temperature, 30 g kg−1 salinity and agitation at 125 rpm. After culturing for 12 days, the biomass was harvested by centrifugation at 1400×g, washed with sterilized sea water and transferred to another batch culture with composition and conditions optimized for high lipid production (second stage). The medium consisted of 4.69 mM sodium metasilicate, 0.76 mM urea, 0.13 mM sodium dihydrogen phosphate, 0.05 mM ferric chloride and 0.2 mM disodium EDTA and incubated at 25 °C temperature, with 30 g kg−1 salinity and agitation at 125 rpm. The control cultures were maintained in the first stage itself at 30 °C throughout the experiment period. Total dry weight and lipid contents were estimated by the gravimetric method on every 3rd, 6th, 9th, 12th, 15th and 18th day of cultivation. All the experiments were carried out in triplicates.
Set II: Growth under optimized conditions for high biomass production followed by growth in selected nutrient deprivation
Ten percent culture inoculum with a cell density of 1.5 × 10⁶ cells mL−1 was cultured in a batch culture system of 150 mL of modified seawater medium with composition and conditions optimized for high biomass production as the first stage of culturing. After culturing for 12 days, the biomass from the cultures was harvested, washed and transferred to another batch culture set (stage 2) of 150 mL of modified seawater medium with one nutrient deprived (i.e., silicon or nitrogen or phosphorus) at a time. The temperature was reduced to 25 °C, and other factors were kept constant. Total dry weight and lipid content were estimated by the gravimetric method on every 3rd, 6th, 9th, 12th, 15th, and 18th day of cultivation. A control experiment was set by transferring biomass into a medium with composition for high biomass production (nutrient replete) at 25 °C. All the experiments were carried out in triplicates.
Set III: Growth under optimized conditions for high biomass production followed by growth in combined nutrient deprivation and limitation
Ten percent culture inoculum with a cell density of 1.5 × 10⁶ cells mL−1 was cultured in a batch culture system of 150 mL of modified seawater medium with composition and conditions optimized for high biomass production as the first stage of culturing. After culturing for 12 days, the biomass from cultures was harvested and transferred to another batch culture (second stage) subjected to three sets of stress conditions as given below.
Stress 1 Phosphorus-deprived medium at 25 °C
Stress 2 Phosphorus-deprived, silicon-limited (20% of the original concentration, i.e., 0.978 mM) medium at 25 °C
Stress 3 Phosphorus-deprived, nitrogen-limited (20% of the original concentration, i.e., 0.18 mM) medium at 25 °C
A control experiment was set using a medium with all the nutrients available in their original concentration optimized for high biomass production (nutrient replete) at a temperature of 25 °C. All other factors were kept constant. Total dry weight and lipid content were estimated by the gravimetric method on every 3rd, 6th, 9th, 12th, 15th and 18th day of cultivation. All the experiments were carried out in triplicates. The biomass from stress 3 experiments was analyzed in detail, as this design was expected to induce maximum lipid production.
Nile red staining
An aliquot of culture from each batch of Set III experiments was centrifuged at 3105×g for 5 min and the pellet was re-suspended in the same volume of phosphate-buffered saline (pH 7.4). The cells were washed, stained with Nile red according to the method of Greenspan et al. (1985), and observed under an inverted phase contrast fluorescent microscope (Leica DMIL connected with DFC 420C camera), and images were processed using Leica application suite (LAS) software.
Fatty acid profiling
Twenty milligrams of dry lyophilized microalgal biomass from each test flask of Set III after 12 days were taken in a 20 mL vial. The samples were incubated at 90 °C for 120 min with methanol–HCl–chloroform (10:1:1). One mL of milli-Q water was added, and the fatty acid methyl esters were extracted by adding 2.0 mL hexane–chloroform (4:1), vortexing and recovering the top layer. The process was repeated twice (Lewis et al. 2000). The collected FAMEs were analyzed in the GC–MS system (Perkin Elmer Clarus 680GC) equipped with a mass detector (Clarus 600T mass spectrometer and were compared with Supelco FAME mix as standard (Sigma-Aldrich, India) along with Turbo mass software for data acquisition and analysis.
Whole-cell analysis by FTIR
Approximately, 1 mg of freeze-dried microalgal biomass from the second stage (12th day) of Set III was used to estimate the biochemical composition of the test samples using FTIR spectrometer (Thermo Nicolet, Avatar 370). Thirty-two scans of absorbance spectra were collected with a spectral resolution of 4 cm−1 between 4000 and 400 cm−1 for each sample. Scans were co-added and averaged. Band assignments to molecular groups of algae were based on those previously published (Murdock and Wetzel 2009). The peak areas of bands were determined for each sample and the relative absorption area ratio of carbohydrate to amide I, lipid to amide I, and amide I to amide A was calculated.
Oxidative stress indices
Lipid peroxidation
Fresh wet algal sample (0.1 g) from Set III experiment was homogenized in 1 mL of 10% (W/V) trichloroacetic acid (TCA) and the homogenate was centrifuged at 7000×g for 10 min. One milliliter of the supernatant was mixed with 2 mL of 0.5% TBA solution (in 10% TCA). Then, the mixture was heated at 95 °C for 45 min and then cooled under room temperature. The supernatant was read at 532 nm after the removal of any interfering substances by centrifuging at 4000×g for 10 min. The change in absorbance was recorded every 30 s up to 3 min in thermostated UV–Vis spectrophotometer (UV-1601, Shimadzu, Japan), with 10% TCA solution as blank. The amount of thiobarbituric acid reactive substances (TBARS) formed was calculated using an extinction coefficient of 1.56 × 10⁵ M−1 cm−1 (Heath and Packer 1968):
| 1 |
Superoxide dismutase (SOD)
Fresh microalgal homogenate (0.1 g) from the Set III experiment was prepared in 1 mL of 50 Mm Tris EDTA (pH 8.5). Blank was adjusted to zero with Tris EDTA. A volume of 33 µL of each sample was mixed with 933 µL of buffer solution and placed in the spectrophotometer. A volume of 33 µL of 0.2 mM pyrogallol prepared in 0.01 N HCl was added, mixed, and absorbance measured at 420 nm for 3 min. The control tube was prepared by replacing the sample with distilled water. The change in absorbance was recorded at every 30 s up to 3 min (Marklund and Marklund 1974):
| 2 |
| 3 |
| 4 |
where VT is the total reaction volume; VS is the volume of enzyme used; and n is the dilution factor.
Catalase
Wet microalgal biomass (0.1 g) from Set III experiment was homogenized in 1 mL phosphate buffer (0.5 M, pH 7.5), centrifuged at 12,400×g at 4 °C for 30 min and the supernatant was taken for measuring catalase (CAT) activity. A reaction mixture containing 1.6 mL phosphate buffer (pH 7.3), 100 μL EDTA (3 mM), 200 μL H2O2 (0.3%) and 100 μL supernatant was taken in a cuvette. Catalase activity in the supernatant was determined by monitoring the disappearance of H2O2, by measuring a decrease in absorbance at 240 nm against a blank of the same reaction mixture without 0.3% H2O2 up to 3 min (Aebi 1974):
| 5 |
Peroxidase (POD)
Fresh wet biomass (0.1 g) from Set III experiment was homogenized in 1 mL 0.1 M phosphate buffer (pH 6.5), and 0.1 mL of the enzyme extract was added to 3 mL pyrogallol solution and mixed well. The absorbance was adjusted to zero at 430 nm. To the test cuvette, 0.5 mL of 1% H2O2 (in 0.1 M phosphate buffer at pH 6.5) was added and mixed. The increase in absorbance was recorded at every 30 s up to 3 min in a spectrophotometer. One unit of peroxidase is defined as the change in absorbance/min at 430 nm (Reddy et al. 1995):
| 6 |
| 7 |
where VT is the total reaction volume; VS is the volume of enzyme used; n is the dilution factor; and 12 is the extinction coefficient of 1 mg mL−1 of purpurogallin at 420 nm.
Statistical analyses
Statistical analyses were carried using one-way and two-way analyses of variance (ANOVA). The differences in the values were considered significant at p < 0.05 and post hoc comparisons were calculated using Fisher’s least significant difference (LSD) test.
Results and discussions
Two-stage cultivation approach
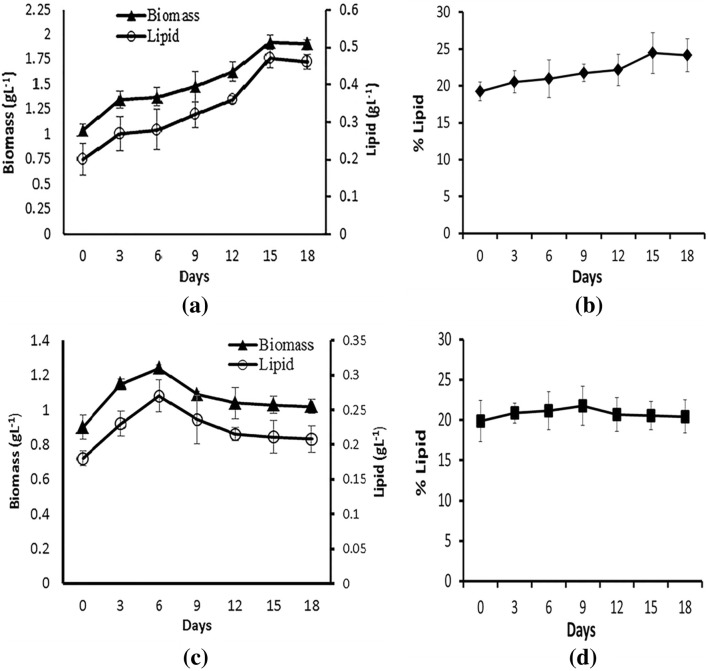
The Set I experiment (Fig. 2) showed the advantage of two-stage cultivation method over the single stage method using the optimized media and culture conditions. In the two-stage cultivation (test) experiment, there was a proportional increase in biomass as well as lipid concentrations in the optimized medium for higher lipid production till the 18th day from the start of the second stage. However, in the single stage cultivation (control) maintained in the optimized media for high biomass production, there was a decline in the total biomass and subsequent lipid concentration after the 18th day from the start of the first stage due to exhaustion of growth nutrients. In the test samples, the total biomass reached 1.9 g L−1, lipid concentration reached 0.4 g L−1, and the lipid percentage was 24% by the second stage of culturing. While in control, it was 20% of total lipid with a concentration of 0.27 g L−1 and maximum biomass of 1.24 g L−1 by the end of the first stage of culturing. Both biomass and total lipid concentration had a significant difference (p < 0.05) between the test and control. However, a significant change in terms of lipid percentage was not observed.
Fig. 2.
Set I experiment—biomass, lipid concentration, lipid percentage of Navicula phyllepta cultured in stage 1 for 12 days, and subsequently in stage 2 for 18 days (a, b) and the control set maintained at stage 1 itself for 18 days (c, d). The values represent mean ± SD (n = 3)
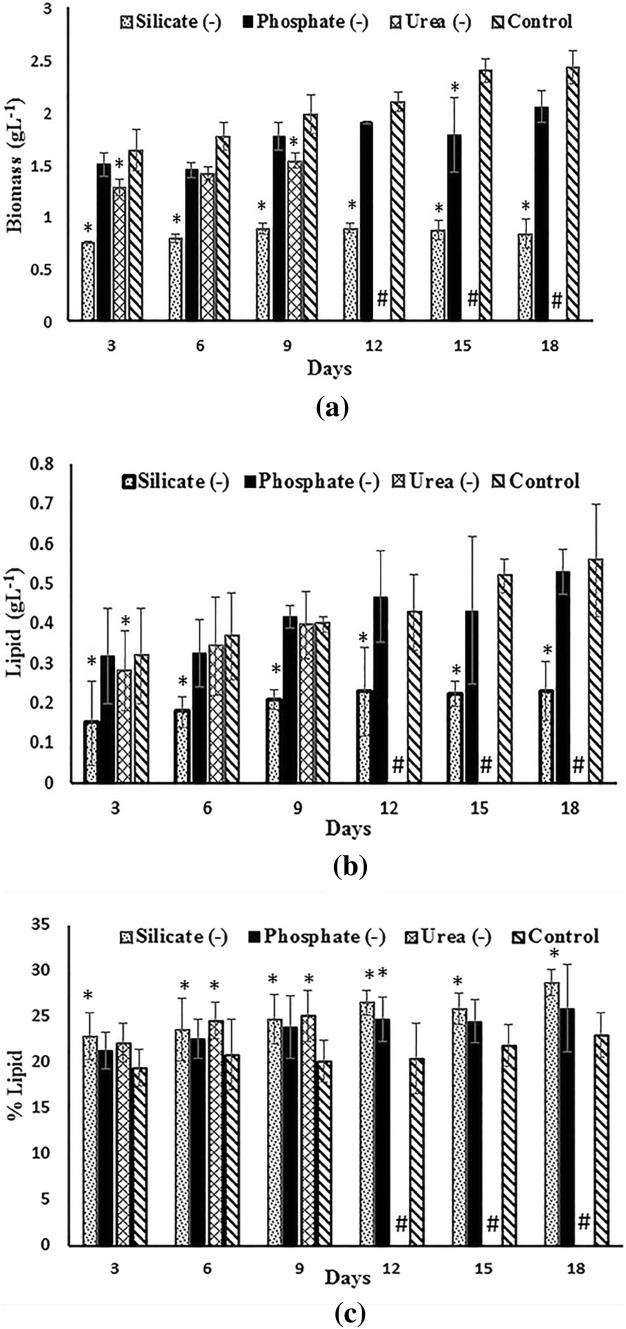
The Set II experiment (Fig. 3) was carried out to understand the effect of nutrient deprivation on biomass and lipid production in the second stage of the two-stage cultivation approach. The results showed that phosphorus deprivation resulted in a reduction in the growth and lipid production, but not a significant effect compared with the control culture with no modification in the initial concentrations. The biomass concentration was the lowest in silicon-deprived media giving 0.84 g L−1 by the end of the experiment, which proves the role of silicate in biomass production. The urea-deprived cultures initially showed a steady growth reaching 1.54 g L−1, but crashed after the 9th day. The silicon deprivation resulted in the highest lipid percentage of 28.78% of weight at the end of the 18th day. The phosphorus-deprived medium produced only 25% of lipid during the 18th day, which was attained by urea-deprived cultures during earlier stages. On comparing with nutrient replete cultures (control), the silicon removal showed a significant (p < 0.05) reduction in the biomass, lipid concentration and increase in lipid percentage. Urea deprivation also caused a significant change (p < 0.05) in biomass and lipid percentage, while the effect of phosphorus removal was insignificant throughout the days. It can also be inferred from the analysis that more than one stress factor contributes to the increased production of lipid as well as biomass in a two-stage cultivation strategy.
Fig. 3.
Set II experiment—biomass (a), lipid concentration (b), lipid percentage (c) of Navicula phyllepta cultured for 12 days in stage 2 with selected nutrient deprivation. The values represent mean ± SD (n = 3). The values represent mean ± SD (n = 3). *Significance (p < 0.05) compared to control. #Not determined
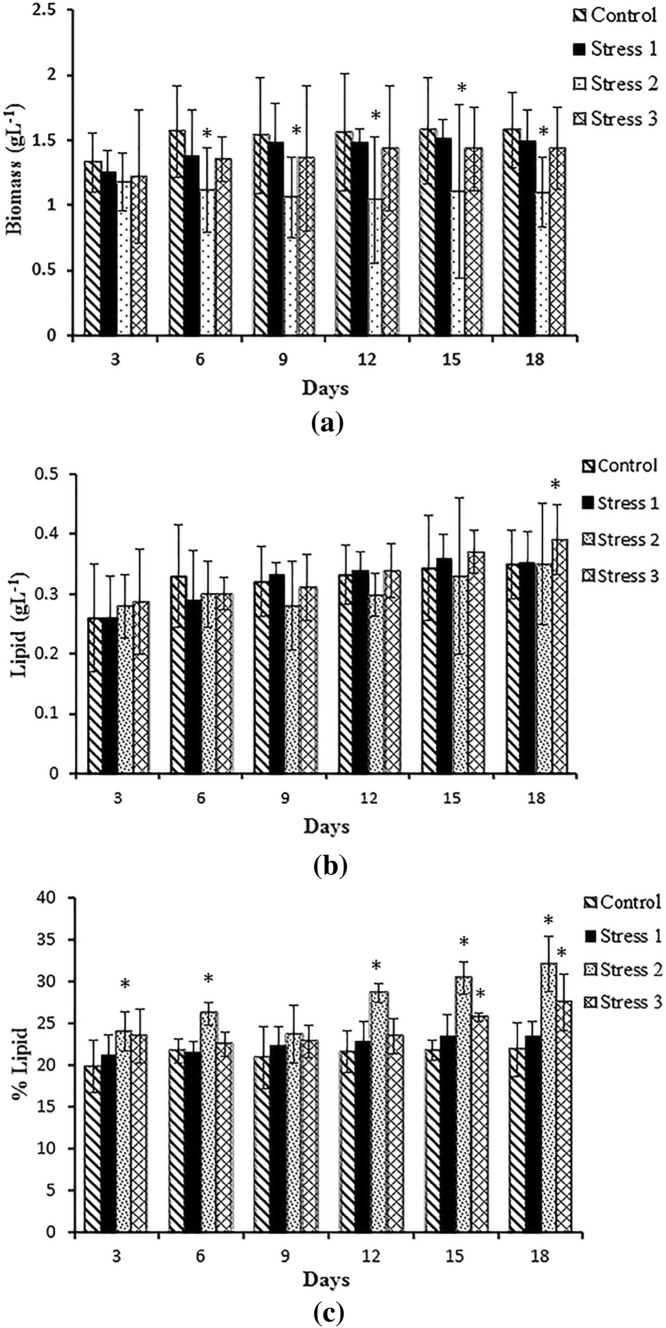
In the Set III experiment (Fig. 4), the multiple nutrient stress factors were studied for increasing the production of biomass along with lipid quantity. The experimental results showed that multiple nutrient stress conditions had a profound influence on the increased rate of lipid production. The cultures subjected to phosphate deprivation, urea limitation and temperature reduction could give a higher concentration of lipid of 0.39 g L−1 proportional to its biomass of 1.44 g L−1. The conditions of phosphate deprivation, silicate limitation, and temperature reduction gave a total lipid percentage of 32.13% at the end of stage 2 of culturing at the cost of reduced biomass (1.1 g L−1). The lipid percentages reached 27.58% and 23.54% under stress 3 and stress 1, respectively. Post hoc analysis showed that there was no significant difference in biomass in stress experiments 1 and 3 compared to control, whereas lipid concentration significantly increased (p < 0.05) in stress 3 in the final day of experiment and the rest were non-significant. Stress 2 demonstrated a significant (p < 0.05) reduction in biomass and increase in lipid percentage throughout the study compared to control. It is proved that oleaginous microalgae, primarily diatoms, produce small amounts of neutral lipids, mainly TAG, under favourable growth conditions, and they start to accumulate lipid droplets upon stresses, especially nutrient starvation (Yin-Hu et al. 2012; Valenzuela et al. 2012). Several studies have reported the application of two-stage cultivation strategies employing two different growth conditions to explore the potential of microalgae as a feedstock to produce biofuels and other high-value products (Pancha et al. 2014; Rios et al. 2015). Alvarez-Diaz et al. (2014) obtained an increase of 36.5–45.5% in lipid accumulation using the two-stage cultivation of Ankistrodesmus falcatus, whereas Jiang et al. (2012) showed increased lipid content to 20–26% in marine microalgae Dunaliella tertiolecta and Thalassiosira pseudonana. The present results also supported the earlier studies that compared to single stage cultivation, the two-stage cultivation is indeed a potential approach to enhance lipid production without much compromise on biomass.
Fig. 4.
Set III experiment—biomass (a), lipid concentration (b), lipid percentage (c) of Navicula phyllepta cultured for 12 days in stage 2 with selected nutrient deprivation and limitation. The values represent mean ± SD (n = 3). *Significance (p < 0.05) compared to control
According to some earlier reports, nitrogen deprivation in the two-phase cultivation was the most preferred methodology to obtain high biomass with high lipid content (Klok et al. 2013, 2014). Previous studies have frequently deployed nitrogen or phosphorus starvation as the major stress factor for increasing lipid yield, but there is paucity in the studies concerning synergistic utilization to achieve high lipid productivity (Belotti et al. 2013; Singh et al. 2015). During nutrient starvation, microalgae release nitrogen as well as utilize the same for their metabolic processes, while deficiency of phosphorus is compensated by utilization of the polyphosphate granules (Praveenkumar et al. 2011). Synergistically optimized nitrogen and phosphorus concentrations for the attainment of maximum lipid productivity in microalgae showed that compared to phosphate limitation, nitrogen starvation was mainly responsible for lipid accumulation along with a shift in polar to non-polar lipids resulting in an overall change in algal physiology (Fakhry and El Maghraby 2015; Arora et al. 2016; Kamalnathan et al. 2016). Research studies reported that the production of storage lipid (triacylglycerol or TAG) was stimulated when Si availability was limited for cell division (Adams and Bugbee 2014) though very little information is known about the physiological mechanism. Silicon-depleted cells directed newly assimilated carbon more towards lipid production and less towards carbohydrate production or else slowly converted non-lipid cell components to lipids (Gupta et al. 2011, Jiang et al. 2015). Thajuddin et al. (2015) reported on diatoms showing the increased lipid content under nitrogen and silica starvation whereas Lin et al. (2018) stated that silicon starvation had a very modest effect on the total lipid content of the marine diatoms Thalassiosira weissflogii and Chaetoceros muelleri. Variations of temperature (a decrease from 30 to 25 °C) and decrease in the concentration of nitrate in the medium resulted in a significant change in cell composition during batch cultures, favoring the accumulation of lipid bodies in microalgae (Bohnenberger and Crossetti 2014).
In this study, the two-stage cultivation method with nutrient starvation as the stress factor proved to be effective in providing an improved quantity of lipid without compromising biomass of the biofuel feedstock. Instead of complete removal of essential micronutrients such as nitrogen and silicon, a supply of the limited amount of the growth nutrients will favor a stable production of the microalgal biomass throughout the cultivation period. Though silicon deficiency along with phosphate deprivation and temperature variation resulted in the highest lipid percentage in the diatom cells, nitrogen limitation along with phosphate deprivation was found to be the most favourable post-harvest treatment to attain high biomass and high lipid content per cell with a minor loss in biomass.
Nile red staining
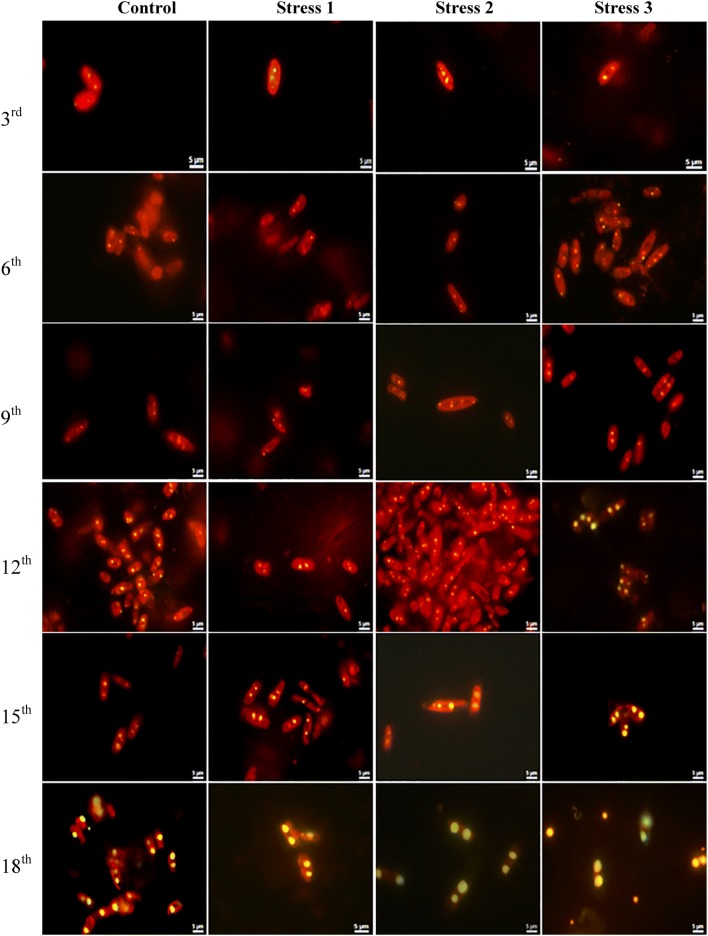
In this present study, bright yellow fluorescence from intracellular lipid droplets and red fluorescence from chlorophyll were observed under fluorescence microscopy after Nile red staining (Fig. 5). After 9 days of stress period, the numbers of yellow spots or lipid bodies within the cells increased notably in stress 2 and stress 3 test samples, but their sizes were similar. The size of the oil bodies increased reaching up to 3–4 µm in size by 18th day in silicate- (stress 2) and urea-limited (stress 3) samples, which visually proved the fact that lipid accumulation increased with the application of multiple stresses on diatoms cells compared to nutrient replete condition. The findings were supported by the studies of Yang et al. (2013) and Dhup et al. (2017) who demonstrated the increase in oil bodies in Nile red-stained P. tricornutum under nitrogen starvation and in Monoraphidium sp. under phosphorus limitation, respectively.
Fig. 5.
Nile red-stained images of Navicula phyllepta showing yellow oil bodies under stress and control conditions of Set III during different days of cultivation in stage 2. Scale bar = 5 µm
Fatty acid composition analyses
Fatty acids of marine diatoms such as C14:0, C16:0, C16:1, C18:0, C18:1, and C20:5(n-3) are important criteria for improved biodiesel quality (Volkman et al. 1989; Sabuet al. Sabu et al. 2017b). In the Set III experimental setup, the fatty acid composition of the diatom Navicula phyllepta cultured in stage 2 varied substantially among the different stresses (single or multiple) compared to the control, which was subjected to temperature stress only (Table 1). The relative percentage of fatty acids C16:0 and C16:1 was found to be highest in stress 3 (phosphate deprivation, nitrogen limitation and temperature reduction) (51.77%, 27.08%) followed by stress 2 (phosphate deprivation, silicon limitation and temperature reduction) (46.78%, 18.39%), whereas the stress 1 (phosphate deprivation and temperature reduction) gave slightly lesser concentrations (32.04%, 11.07%) compared to the control (nutrient replete medium with temperature reduction) (43.5%, 18.13%). The percentage of stearic acid C18:0, which contributed to the total saturation of microalgal oil was significantly enhanced in the multiple and double stress samples. It was quantified as 21.27% in stress 2 and 21.13% in stress 3, while it was 15.97% in stress 1 and 2.93% in control. A comparatively high concentration of EPA C20:5(n-3) was reported in stress 1 samples with no detection in stress 3. The total percentage of saturated (72.9%) and monounsaturated fatty acids (27.08%) was found to be the highest in stress 3.
Table 1.
Percentage of (a) individual fatty acids and total fatty acids based upon the degree of saturation present in Navicula phyllepta in control and stress conditions of Set III on the 12th day of culturing in stage 2
| % of fatty acids | Control | Stress 1 | Stress 2 | Stress 3 |
|---|---|---|---|---|
| C14:0 | 5.4 | 4.07 | – | – |
| C16:0 | 43.5 | 35.04 | 46.78 | 51.77 |
| C16:1 | 18.13 | 11.07 | 18.39 | 27.08 |
| C18:0 | 2.93 | 15.97 | 21.27 | 21.13 |
| C18:1 | 5.05 | – | – | – |
| C20:5n3 | 11.8 | 19.8 | 10.54 | – |
| SFA | 51.83 | 55.08 | 68.05 | 72.9 |
| MUFA | 23.18 | 11.07 | 18.39 | 27.08 |
| PUFA | 11.8 | 19.8 | 9.54 | – |
– Not detected, SFA saturated fatty acid, MUFA monounsaturated fatty acid, PUFA polyunsaturated fatty acid
The amount of palmitic and palmitoleic acid was found to be highest in nitrogen-deficient condition which was in agreement with the studies of Thajuddin et al. (2015) and Lin et al. (2018), in which nitrogen deficiency profoundly affected the fatty acid profile of diatoms causing an increase in SFA and MUFA with reduced PUFA content. Adams and Bugbee (2014) reported a shift in fatty acid chain length from C18 to C16 in reducing the silicon concentration. A similar result was demonstrated in the present study with an almost equal amount of C18:0 in silicon-limited condition (stress 2) and nitrogen-limited condition (stress 3). One of the most commonly observed facts is that temperature stress can lead to an increase in unsaturation level and change in fatty acid composition even under nutrient deplete or replete conditions for retaining the membrane fluidity (Guschina and Harwood 2009; Roleda et al. 2013). The presence of a high proportion of saturated and monounsaturated fatty acids in the diatom N. phyllepta MACC8 under multiple stresses are considered to be optimal from a fuel quality perspective.
Whole-cell response to the stresses
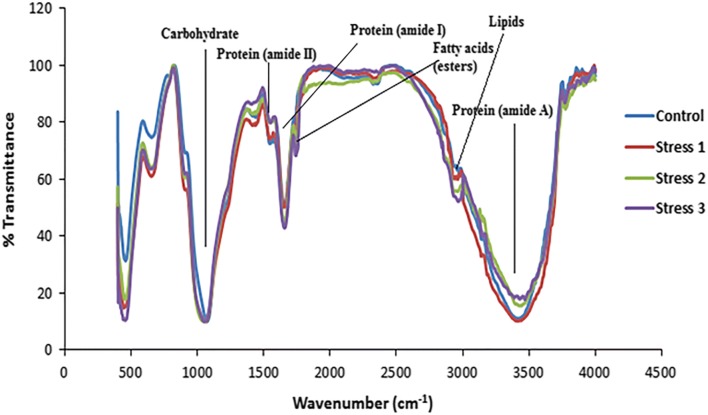
From the FTIR analysis (Fig. 6), the infra-red spectra of biomass preparations were dominated by the protein amide I (mainly C–O stretching) and amide II (mainly N–H bending) vibrational bands around 1658 and 1545 cm−1, respectively. The band at 3300–3400 cm−1 was attributed to the presence of the amide A/B (N–H stretching vibrations of the peptide groups) (Fabian and Mäntele 2002). The algal carbohydrate content determined by FTIR was due to the C–OH and C–O–C stretching vibration peaks at 1000–1200 cm−1. The bands at 2850–2970 cm−1 were attributed to asymmetric and symmetric C–H vibrations, mainly due to methyl and methylene groups in fatty acids, which were primarily considered for quantification of the total lipid content (Pistorius et al. 2009). The prominent bands present at ~ 1740–1640 cm−1 were due to the presence of C=O of esters or fatty acids. The bands at 800–1100 cm−1 are attributed to silica frustules of diatom cells, which sometimes overlap with the carbohydrate portion (Stehfest et al. 2005). In the present study (Table 2), on comparing the relative change in the carbohydrate/amide I ratio, the stress 3 showed the highest value (7.46) followed by stress 2 (7.1), stress 1(6.7) and control (6.32). The lipid/amide I also developed a similar consistent pattern with the highest value in the case of stress 3. The ratio of control could not be estimated due to a limited band showing the presence of lipid. The amide I and amide A ratio showed similar values for the control, stress 1 and stress 3 samples with a higher value for stress 2 test samples.
Fig. 6.
FTIR spectrum of control and test samples of stress experiments of Set III on the 12th day of culturing in stage 2
Table 2.
The carbohydrate/amide I (a), lipid/amide I (b) and amide I and amide A (c) absorption area ratio between test and control samples of stress experiments of Set III on the 12th day of culturing in stage 2 is shown
| Relative absorption area ratio | Control | Stress 1 | Stress 2 | Stress 3 |
|---|---|---|---|---|
| Carbohydrate/amide I | 6.32 | 6.7 | 7.1 | 7.46 |
| Amide I/amide A | 0.066 | 0.066 | 0.076 | 0.065 |
| Lipid/amide I | – | 0.106 | 0.149 | 0.206 |
– Not detected
Generally, nitrogen, silicon and phosphorus limitation stresses induced a decrease in photosynthetic activity, but also have an impact on the total biochemical pool. Nitrate depletion mainly affected the lipid content of diatoms, whereas reduction of both nitrate and phosphate affected the protein pool while increasing carbohydrate content which indicated the rise in the carbohydrate/amide I area ratio (Soler et al. 2010; Yao et al. 2012). Nitrogen deprivation led to arrested protein synthesis, allowing fixed carbon more likely to be diverted to carbohydrate and neutral lipid/total lipid formation (Meng et al. 2014; Agirman and Cetin 2017). Stehfest et al. (2005) showed that the carbohydrate/amide ratio was higher in nitrogen deplete compared to phosphate deplete conditions in P. tricornutum. Higher lipid and carbohydrate contents were obtained at lower temperatures (20 °C and 25 °C) compared to high temperature (30 °C) in Chaetoceros wighamii, while protein concentration remained unaffected (De Castro Araujo and Garcia 2005). Altogether, the changes observed with FTIR spectroscopy of the test and control cultures in the present study were found to be consistent with the effects described previously in the literature.
Oxidative stress indices
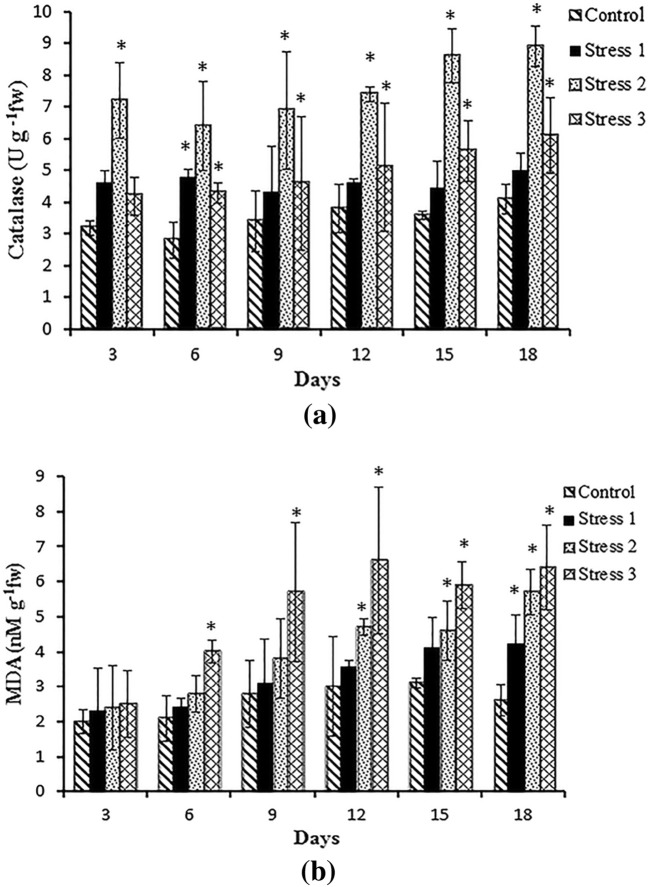
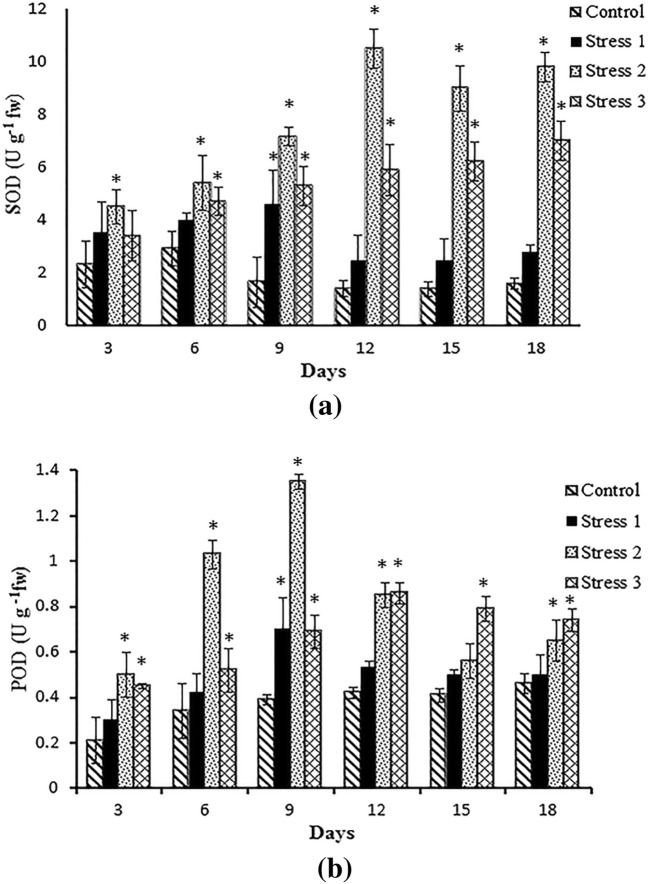
From the analysis of antioxidant enzymes during stress, the catalase activity was found to be the highest in stress 2 followed by stress 3, indicating an increased rate of hydrogen peroxide production (Fig. 7a). As the silicon-limited cultures gave very little biomass, the catalase activity was the highest compared to others, demonstrating the extreme stress on the diatom upon immediate transfer from high silicate to low silicate concentration in two-phase cultivation. Lipid peroxidation, measured in terms of malondialdehyde (MDA) content in the cells, was higher in urea-limited cultures (stress 3) compared to others (Fig. 7b). It signifies the high lipid degradation inside the cells due to the limitation of extracellular nitrogen uptake. This result was in support of the findings of Yilancioglu et al. (2014) and Al-Rashed et al. (2016). The values of SOD were in correspondence to catalase activity in all the stress conditions (Fig. 8a). This data suggest that superoxides may be elevated under silicate-deficient and nitrogen-deficient conditions, necessitating increased SOD activity. The values of POD (Fig. 8b) showed the highest value in stress 2 cultures till the 9th day, after which it increased in stress 3 set of cultures. A significant increase (p < 0.05) in antioxidant levels (catalase, SOD, lipid peroxidation and POD) was demonstrated in stress 2 and stress 3 whereas stress 1 could not show a substantial effect on comparison with the control.
Fig. 7.
Catalase (a) and lipid peroxidation (b) activities in Navicula phyllepta in control and stress (test) conditions of Set III cultures at stage 2. The values represent mean ± SD (n = 3). *Significance (p < 0.05) compared to control
Fig. 8.
Superoxide dismutase (SOD) (a) and peroxidase (POD) (b) activities in Navicula phyllepta in control and stress (test) conditions of Set III cultures at stage 2. The values represent mean ± SD (n = 3). *Significance (p < 0.05) compared to control
Increased activity of anti-oxidative enzymes such as SOD, peroxidases, and catalase is widely reported in microalgae under nutrient stress conditions (Gigova and Ivanova 2015; Lauritano et al. 2015; Al-Rashed et al. 2016). The role of ROS in lipid accumulation in microalgae is not well explored. It is interesting to note that oxidative stress is a mediator for lipid accumulation in various microalgae making them efficient for biofuel production (Osundeko et al. 2013; Yilancioglu et al. 2014). Nitrogen stress can result in the co-occurrence of reactive oxygen species, increased lipid production and impairment of proteins in diatoms (Liu et al. 2012). The overall anabolic reaction flux gets severely constrained due to the degradation of proteins resulting in alterations in photosynthesis rate (Cakmak et al. 2012). In this context, microalgal cells may favor the storage of lipids as an energy source instead of consumption. A mechanistic understanding of the interrelationship between ROS rise and increased lipid accumulation in microalgae species requires further investigation. The down-regulation of gene expression of various proteins forming up the photosystem complexes in microalgae could be the possible molecular explanation for such occurrences (Zhang et al. 2004). Hence, the higher activities of antioxidant enzymes in Navicula phyllepta MACC8 show its high tolerance to stressful conditions.
Conclusion
In this study, the two-stage cultivation strategy was found to be an effective method compared to a single stage in stimulating increased production of lipid in the diatom Navicula phyllepta MACC8 without compromising the biomass. Two-phase culturing system, with multifactor stress application especially nitrogen limitation along with phosphate starvation and temperature stress as post-harvest treatment, would be the suitable method for gaining maximum biomass productivity and lipid content. The highest lipid percentage of 32% of cell dry weight was obtained upon silicon limitation, phosphate starvation and temperature stress condition at 25 °C. The application of multiple stresses resulting in a high amount of saturated and monounsaturated fatty acids with less/no polyunsaturated content, especially in nitrogen-limited conditions, favored its suitability towards biodiesel production. The changes in biochemical composition and oxidative stress parameters within the various stress conditions demonstrated the profound influence of the selected stress factors on the biodiesel productivity of the diatom under study. Since the energy consumption in process systems is an important parameter that affects the total production costs, the criteria of choosing low energy-consuming techniques such as nutrient starvation would be the most economical in the two-stage cultivation approach. Besides, the present study included experiments in small volumes, and therefore, based on the results of the study, large-scale culturing, and biomass production need to be carried out in the future.
Acknowledgements
The authors acknowledge the University Grants Commission, Government of India for the financial support under the major research grant (File No. F.No.41 568/2012 (SR)). The first author also acknowledges Cochin University of Science and Technology for the Junior and Senior Research Fellowships.
Compliance with ethical standards
Conflict of interest
The authors declare that they have no conflict of interest.
References
- Adams C, Bugbee B. Enhancing lipid production of the marine diatom Chaetoceros gracilis: synergistic interactions of sodium chloride and silicon. J Appl Phycol. 2014;26:1351–1357. [Google Scholar]
- Aebi H. Catalase. In: Bergmeyer HU, editor. Methods in enzymatic analysis. New York: Academic Press; 1974. pp. 673–678. [Google Scholar]
- Agirman N, Cetin AK. Effect of nitrogen limitation on growth, total lipid accumulation and protein amount in Scenedesmus acutus as biofuel reactor candidate. Nat Sci Discov. 2017;3:33–38. [Google Scholar]
- Al-Rashed SA, Ibrahim MM, El-Gaaly GA, Al-Shehri S, Mostafa A. Evaluation of radical scavenging system in two microalgae in response to interactive stresses of UV-B radiation and nitrogen starvation. Saudi J Biol Sci. 2016;23:706–712. doi: 10.1016/j.sjbs.2016.06.010. [DOI] [PMC free article] [PubMed] [Google Scholar]
- Alvarez-Diaz PD, Ruiz J, Arbib Z, Barragan J, Garrido Perez C, Perales JA. Lipid production of microalga Ankistrodesmus falcatus increased by nutrient and light starvation in a two-stage cultivation process. Appl Biochem Biotechnol. 2014;174:1471–1483. doi: 10.1007/s12010-014-1126-5. [DOI] [PubMed] [Google Scholar]
- Arora N, Patel A, Pruthi PA, Pruthi V. Synergistic dynamics of nitrogen and phosphorous influences lipid productivity in Chlorella minutissima for biodiesel production. Bioresour Technol. 2016;213:79–87. doi: 10.1016/j.biortech.2016.02.112. [DOI] [PubMed] [Google Scholar]
- Belotti G, Bravi M, de Caprariis B, de Filippis P, Scarsella M. Effect of nitrogen and phosphorus starvations on Chlorella vulgaris lipids productivity and quality under different trophic regimens for biodiesel production. Am J Plant Sci. 2013;4:44–51. [Google Scholar]
- Benvenuti G, Bosma R, Cuaresma M. Selecting microalgae with high lipid productivity and photosynthetic activity under nitrogen starvation. J Appl Phycol. 2015;27:1425. [Google Scholar]
- Bohnenberger JE, Crossetti LO. Influence of temperature and nutrient content on lipid production in freshwater microalgae cultures. An Acad Bras Cienc. 2014;86:1239–1248. doi: 10.1590/0001-3765201420130136. [DOI] [PubMed] [Google Scholar]
- Cakmak T, Angun P, Ozkan AD, Cakmak Z, Olmez TT, Tekinay T. Nitrogen and sulfur deprivation differentiate lipid accumulation targets of Chlamydomonas reinhardtii. Bioengineered. 2012;3:343–346. doi: 10.4161/bioe.21427. [DOI] [PMC free article] [PubMed] [Google Scholar]
- Chen B, Wan C, Mehmood MA, Chang JS, Bai F, Zhao X. Manipulating environmental stresses and stress tolerance of microalgae for enhanced production of lipids and value-added products—a review. Bioresour Technol. 2017;244:1198–1206. doi: 10.1016/j.biortech.2017.05.170. [DOI] [PubMed] [Google Scholar]
- De Castro Araujo S, Garcia VMT. Growth and biochemical composition of the diatom Chaetoceros cf. wighamii Brightwell under different temperature, salinity and carbon dioxide levels. I. Protein, carbohydrates and lipids. Aquaculture. 2005;246:405–412. [Google Scholar]
- Dhup S, Kannan DC, Dhawan V. Growth, lipid productivity and cellular mechanism of lipid accumulation in microalgae Monoraphidium sp. following different phosphorous concentrations for biofuel production. Curr Sci. 2017;112:539. [Google Scholar]
- Doan YTT, Obbard JP. Two-stage cultivation of a Nannochloropsis mutant for biodiesel feedstock. J Appl Phycol. 2014;27:2203–2208. [Google Scholar]
- Fabian H, Mäntele W. Infrared spectroscopy of proteins. In: Chalmers JM, Griffiths PR, editors. Handbook of vibrational spectroscopy. Chichester: Wiley; 2002. pp. 3399–3426. [Google Scholar]
- Fakhry EM, El Maghraby DM. Lipid accumulation in response to nitrogen limitation and variation of temperature in Nannochloropsis salina. Bot Stud. 2015;56:6. doi: 10.1186/s40529-015-0085-7. [DOI] [PMC free article] [PubMed] [Google Scholar]
- Farooq W, Lee YC, Ryu BG, Kim BH, Kim HS, Choi YE, Yang JW. Two-stage cultivation of two Chlorella sp. strains by simultaneous treatment of brewery wastewater and maximizing lipid productivity. Bioresour Technol. 2013;132:230–238. doi: 10.1016/j.biortech.2013.01.034. [DOI] [PubMed] [Google Scholar]
- Gigova LG, Ivanova NJ. Microalgae respond differently to nitrogen availability during culturing. J Biosci. 2015;40:365–374. doi: 10.1007/s12038-015-9510-z. [DOI] [PubMed] [Google Scholar]
- Gobler CJ, Buck NJ, Sieracki ME, Sanudo-Wilhelmy SA. Nitrogen and silicon limitation of phytoplankton communities across an urban estuary: the East River-Long Island Sound system. Estuar Coast Shelf Sci. 2006;68:127–138. [Google Scholar]
- Greenspan P, Mayer EP, Fowler SD. Nile red: a selective fluorescent stain for intracellular lipid droplets. J Cell Biol. 1985;100:965–973. doi: 10.1083/jcb.100.3.965. [DOI] [PMC free article] [PubMed] [Google Scholar]
- Gupta GN, Tiwari SK, Lawrence K, Lawrence RS. Effect of silicon on growth and biodiesel production in fresh water diatoms. Plant Arch. 2011;11:673–676. [Google Scholar]
- Guschina IA, Harwood JL. Algal lipids and effect of the environment on their biochemistry. In: Brett M, Arts MT, Michael T, editors. Lipids in aquatic ecosystems. New York: Springer; 2009. pp. 1–24. [Google Scholar]
- Heath RL, Packer L. Photoperoxidation in isolated chloroplasts: I. Kinetics and stoichiometry of fatty acid peroxidation. Arch Biochem Biophys. 1968;125:189–198. doi: 10.1016/0003-9861(68)90654-1. [DOI] [PubMed] [Google Scholar]
- Jiang Y, Yoshida T, Quigg A. Photosynthetic performance, lipid production and biomass composition in response to nitrogen limitation in marine microalgae. Plant Physiol Biochem. 2012;54:70–77. doi: 10.1016/j.plaphy.2012.02.012. [DOI] [PubMed] [Google Scholar]
- Jiang Y, Laverty KS, Brown J, Brown L, Chagoya J, Burow M, Quigg A. Effect of silicate limitation on growth, cell composition, and lipid production of three native diatoms to Southwest Texas desert. J Appl Phycol. 2015;27:1433–1442. [Google Scholar]
- Kamalanathan M, Pierangelini M, Shearman LA, Gleadow R, Beardall J. Impacts of nitrogen and phosphorus starvation on the physiology of Chlamydomonas reinhardtii. J Appl Phycol. 2015;28:1509–1520. [Google Scholar]
- Klok AJ, Martens DE, Wijffels RH, Lamers PP. Simultaneous growth and neutral lipid accumulation in microalgae. Bioresour Technol. 2013;134:233–243. doi: 10.1016/j.biortech.2013.02.006. [DOI] [PubMed] [Google Scholar]
- Klok AJ, Lamers PP, Martens DE, Draaisma RB, Wijffels RH. Edible oils from microalgae: insights in TAG accumulation. Trends Biotechnol. 2014;32:521–528. doi: 10.1016/j.tibtech.2014.07.004. [DOI] [PubMed] [Google Scholar]
- Lauritano C, Orefice I, Procaccini G, Romano G, Ianora A. Key genes as stress indicators in the ubiquitous diatom Skeletonema marinoi. BMC Genom. 2015;16:411. doi: 10.1186/s12864-015-1574-5. [DOI] [PMC free article] [PubMed] [Google Scholar]
- Lewis T, Nichols PD, Mc Meekin TA. Evaluation of extraction methods for recovery of fatty acids from lipid-producing microheterotrophs. J Microbiol Methods. 2000;43:107–116. doi: 10.1016/s0167-7012(00)00217-7. [DOI] [PubMed] [Google Scholar]
- Liang K, Zhang Q, Gu M, Cong W. Effect of phosphorus on lipid accumulation in freshwater microalga Chlorella sp. J Appl Phycol. 2013;25:311–318. [Google Scholar]
- Lin Q, Zhuo WH, Wang XW, Chen CP, Gao YH, Liang JR. Effects of fundamental nutrient stresses on the lipid accumulation profiles in two diatom species Thalassiosira weissflogii and Chaetoceros muelleri. Bioproc Biosyst Eng. 2018;22:1–12. doi: 10.1007/s00449-018-1950-z. [DOI] [PubMed] [Google Scholar]
- Liu W, Huang Z, Li P, Xia J, Chen B. Formation of triacylglycerol in Nitzschia closterium f. minutissima under nitrogen limitation and possible physiological and biochemical mechanisms. J Exp Mar Biol Ecol. 2012;418:24–29. [Google Scholar]
- Marklund S, Marklund G. Involvement of the superoxide anion radical in the autooxidation of pyrogallol and a convenient assay for superoxide dismutase. Eur J Biochem. 1974;47:469–474. doi: 10.1111/j.1432-1033.1974.tb03714.x. [DOI] [PubMed] [Google Scholar]
- Meng Y, Yao C, Xue S, Yang H. Application of Fourier transform infrared (FT-IR) spectroscopy in determination of microalgal compositions. Bioresour Technol. 2014;151:347–354. doi: 10.1016/j.biortech.2013.10.064. [DOI] [PubMed] [Google Scholar]
- Merchant SS, Kropat J, Liu B, Shaw J, Warakanont J. TAG You’re it! Chlamydomonas as a reference organism for understanding algal triacylglycerol accumulation. Curr Opin Biotechnol. 2012;23:352–363. doi: 10.1016/j.copbio.2011.12.001. [DOI] [PubMed] [Google Scholar]
- Murdock JN, Wetzel DL. FTIR microspectroscopy enhances biological and ecological analysis of algae. Appl Spectrosc Rev. 2009;44:335–361. [Google Scholar]
- Nishiyama Y, Yamamoto H, Allakhverdiev SI, Inaba M, Yokota A, Murata N. Oxidative stress inhibits the repair of photodamage to the photosynthetic machinery. EMBO J. 2001;20:5587–5594. doi: 10.1093/emboj/20.20.5587. [DOI] [PMC free article] [PubMed] [Google Scholar]
- Osundeko O, Davies H, Pittman JK. Oxidative stress-tolerant microalgae strains are highly efficient for biofuel feedstock production on wastewater. Biomass Bioenerg. 2013;56:284–294. [Google Scholar]
- Pal D, Khozin-Goldberg I, Cohen Z, Boussiba S. The effect of light, salinity, and nitrogen availability on lipid production by Nannochloropsis sp. Appl Microbiol Biotechnol. 2011;90:1429–1441. doi: 10.1007/s00253-011-3170-1. [DOI] [PubMed] [Google Scholar]
- Pancha I, Chokshi K, George B, Ghosh T, Paliwal C, Maurya R, Mishra S. Nitrogen stress triggered biochemical and morphological changes in the microalgae Scenedesmus sp. CCNM 1077. Bioresour Technol. 2014;156:146–154. doi: 10.1016/j.biortech.2014.01.025. [DOI] [PubMed] [Google Scholar]
- Pistorius AMA, DeGrip WJ, Egorova-Zachernyuk TA. Monitoring of biomass composition from microbiological sources by means of FT-IR spectroscopy. Biotechnol Bioeng. 2009;103:123–129. doi: 10.1002/bit.22220. [DOI] [PubMed] [Google Scholar]
- Praveenkumar R, Shameera K, Mahalakshmi G, Akbarsha MA, Thajuddin N. Influence of nutrient deprivation on lipid accumulation in a dominant indigenous microalga Chlorella sp., BUM11008: evaluation for biodiesel production. Biomass Bioenerg. 2011;37:60–66. [Google Scholar]
- Ratnapuram HP, Vutukuru SS, Yadavalli R. Mixotrophic transition induced lipid productivity in Chlorella pyrenoidosa under stress conditions for biodiesel production. Heliyon. 2018;4:e00496. doi: 10.1016/j.heliyon.2017.e00496. [DOI] [PMC free article] [PubMed] [Google Scholar]
- Reddy KP, Subhani SM, Khan PA, Kumar KB. Effect of light and benzyl adenine on dark-treated growing rice leaves, II changes in peroxidase activity. Plant Cell Physiol. 1995;24:987–994. [Google Scholar]
- Rios LF, Klein BC, Luz LF, Jr, Maciel Filho R, Wolf Maciel MR. Nitrogen starvation for lipid accumulation in the microalga species Desmodesmus sp. Appl Biochem Biotechnol. 2015;175:469–476. doi: 10.1007/s12010-014-1283-6. [DOI] [PubMed] [Google Scholar]
- Roleda MY, Slocombe SP, Leakey RJ, Day JG, Bell EM, Stanley MS. Effects of temperature and nutrient regimes on biomass and lipid production by six oleaginous microalgae in batch culture employing a two-phase cultivation strategy. Bioresour Technol. 2013;129:439–449. doi: 10.1016/j.biortech.2012.11.043. [DOI] [PubMed] [Google Scholar]
- Sabu S, Singh ISB, Joseph V. Optimization of critical media components and culture conditions for enhanced biomass and lipid production in the oleaginous diatom Navicula phyllepta: a statistical approach. Environ Sci Pollut Res. 2017;34:26763–26777. doi: 10.1007/s11356-017-0274-x. [DOI] [PubMed] [Google Scholar]
- Sabu S, Singh ISB, Joseph V. Molecular identification and comparative evaluation of tropical marine microalgae for biodiesel production. Mar Biotechnol. 2017;19(4):328–344. doi: 10.1007/s10126-017-9754-8. [DOI] [PubMed] [Google Scholar]
- Singh P, Guldhe A, Kumari S, Rawat I, Bux F. Investigation of the combined effect of nitrogen, phosphorus and iron on lipid productivity of microalgae Ankistrodesmus falcatus KJ671624 using response surface methodology. Biochem Eng J. 2015;94:22–29. [Google Scholar]
- Soler C, Claquin P, Goutx M, Ragueneau O, Moriceau B. Impact of nutrient starvation on the biochemical composition of the marine diatom Thalassiosira weissflogii: from the whole cell to the frustule fraction. Biogeosci Discuss. 2010;7:5953–5995. [Google Scholar]
- Stehfest K, Toepel J, Wilhelm C. The application of micro-FTIR spectroscopy to analyze nutrient stress-related changes in biomass composition of phytoplankton algae. Plant Physiol Biochem. 2005;43:717–726. doi: 10.1016/j.plaphy.2005.07.001. [DOI] [PubMed] [Google Scholar]
- Taleb A, Legrand J, Takache H, Taha S, Pruvost J. Investigation of lipid production by nitrogen-starved Parachlorella kessleri under continuous illumination and day/night cycles for biodiesel application. J Appl Phycol. 2018;30:761–772. [Google Scholar]
- Tan KWM, Lee YK. The dilemma for lipid productivity in green microalgae: importance of substrate provision in improving oil yield without sacrificing growth. Biotechnol Biofuels. 2016;9:255. doi: 10.1186/s13068-016-0671-2. [DOI] [PMC free article] [PubMed] [Google Scholar]
- Thajuddin N, Ilavarasi A, Baldev E, MubarakAli D, Alharbi NS, Chinnathambi A, Alharbi SA. Stress induced lipids accumulation in Naviculoid marine diatoms for bioenergy application. Int J Biotechnol Wellness Ind. 2015;4:18–24. [Google Scholar]
- Valenzuela J, Mazurie A, Carlson RP, Gerlach R, Cooksey KE, Peyton BM, Fields MW. Potential role of multiple carbon fixation pathways during lipid accumulation in Phaeodactylum tricornutum. Biotechnol Biofuels. 2012;5:1–17. doi: 10.1186/1754-6834-5-40. [DOI] [PMC free article] [PubMed] [Google Scholar]
- Volkman JK, Jeffrey SW, Nichols PD, Rogers GI, Garland CD. Fatty acid and lipid composition of 10 species of microalgae used in mariculture. J Exp Mar Biol Ecol. 1989;128:219–240. [Google Scholar]
- Yang ZK, Niu YF, Ma YH, Xue J, Zhang MH, Yang WD, Liu JS, Lu SH, Guan Y, Li HY. Molecular and cellular mechanisms of neutral lipid accumulation in diatom following nitrogen deprivation. Biotechnol Biofuels. 2013;6:67. doi: 10.1186/1754-6834-6-67. [DOI] [PMC free article] [PubMed] [Google Scholar]
- Yao C, Ai J, Cao X, Xue S, Zhang W. Enhancing starch production of a marine green microalga Tetraselmis subcordiformis through nutrient limitation. Bioresour Technol. 2012;118:438–444. doi: 10.1016/j.biortech.2012.05.030. [DOI] [PubMed] [Google Scholar]
- Yilancioglu K, Cokol M, Pastirmaci I, Erman B, Cetiner S. Oxidative stress is a mediator for increased lipid accumulation in a newly isolated Dunaliella salina strain. PLoS One. 2014;9:e91957. doi: 10.1371/journal.pone.0091957. [DOI] [PMC free article] [PubMed] [Google Scholar]
- Yin-Hu W, Yin Y, Xin L, Hong-Ying H, Zhen-Feng S. Biomass production of a Scenedesmus sp. under phosphorous-starvation cultivation condition. Bioresour Technol. 2012;112:193–198. doi: 10.1016/j.biortech.2012.02.037. [DOI] [PubMed] [Google Scholar]
- Zhang ZD, Shrager J, Jain M, Chang CW, Vallon O, Grossman AR. Insights into the survival of Chlamydomonas reinhardtii during sulfur starvation based on microarray analysis of gene expression. Eukaryot Cell. 2004;3:1331–1348. doi: 10.1128/EC.3.5.1331-1348.2004. [DOI] [PMC free article] [PubMed] [Google Scholar]


