Abstract
Aberrant activity of the glucocorticoid (GC)/glucocorticoid receptor (GR) endocrine system has been linked to obesity‐related metabolic dysfunction. Traditionally, the GC/GR axis has been believed to play a crucial role in adipose tissue formation and function in both, white (WAT) and brown adipose tissue (BAT). While recent studies have challenged this notion for WAT, the contribution of GC/GR signaling to BAT‐dependent energy homeostasis remained unknown. Here, we have generated and characterized a BAT‐specific GR‐knockout mouse (GRBATKO), for the first time allowing to genetically interrogate the metabolic impact of BAT‐GR. The HPA axis in GRBATKO mice was intact, as was the ability of mice to adapt to cold. BAT‐GR was dispensable for the adaptation to fasting–feeding cycles and the development of diet‐induced obesity. In obesity, glucose and lipid metabolism, insulin sensitivity, and food intake remained unchanged, aligning with the absence of changes in thermogenic gene expression. Together, we demonstrate that the GR in UCP1‐positive BAT adipocytes plays a negligible role in systemic metabolism and BAT function, thereby opposing a long‐standing paradigm in the field.
Keywords: brown adipose tissue, energy metabolism, glucocorticoid receptor, hormones, UCP1
Subject Categories: Metabolism
Introduction
Glucocorticoids (GCs) represent a class of powerful steroid hormones with an important immunomodulatory function and are of eminent importance in the regulation of metabolic pathways such as gluconeogenesis and lipolysis. GCs act through the glucocorticoid receptor (GR), a nuclear receptor present in many cells including hepatocytes and adipocytes, to transactivate or transrepress its target genes. In humans, long‐term pharmacological treatment with GCs such as prednisolone or dexamethasone (Dex) often leads to an altered body fat distribution, with increased amounts of visceral fat and increased lipolysis and wasting of subcutaneous peripheral adipose tissue 1, 2, 3.
Adipose tissue has been recognized to have a diverse range of physiological functions in the past decades. White adipose tissue (WAT) mainly acts as an energy storage organ, coping with excessive energy intake by storage in the form of triacylglycerol, and in turn liberating non‐esterified fatty acids in periods of nutrient demand by other tissues or following lipolytic stimuli. In adipose tissue, GR is thought to mediate the lipolytic effects of GC treatment and has been found to be crucial for lipid mobilization in the postabsorptive state as well as in chronic GC exposure 4, 5, 6. Moreover, GR had long been thought to play a major role in adipose tissue development and expansion via the process of adipocyte differentiation, thus contributing to adipocyte hyperplasia 7. GCs are contained in most in vitro adipogenic differentiation cocktails, and GR was found to bind cooperatively with CEBPB at transcriptional hotspots in early adipogenesis 8. Recent studies, however, have contested this notion: GR‐deficient murine preadipocytes were shown to suffer only from a delay in triglyceride (TG) accumulation, and adiponectin‐Cre‐mediated deletion of GR led to no morphological difference in WAT depots 4, 9. Thus, while GR seems to be crucial for lipid mobilization in the postabsorbtive state and in chronic GC exposure, adipose tissue expansion phenotypes have not been reported 4, 5, 6. In summary, recently the importance of GR to both developmental and metabolic aspects of adipose tissue function has been called into question.
In contrast to WAT, brown adipose tissue (BAT) contains more but smaller lipid droplets, but instead an abundance of mitochondria expressing uncoupling protein 1 (UCP1) to generate heat. A vast number of studies in recent years have addressed the therapeutic potential of BAT in the treatment of obesity and insulin resistance. Such strategies are typically aimed at increasing thermogenesis and ultimately energy expenditure to lower body weight. Additionally, stimulation of the production and secretion of adipokines and lipokines has been exploited to target distant organs to increase, e.g., glucose uptake in skeletal muscle. In BAT, GR deficiency driven by the Myf5‐Cre promoter in mice did not lead to developmental abnormalities in BAT depot formation 9. However, given the expression of Myf5 not only in BAT but also in muscle and a subset of white adipocytes 10, the specificity of the effect of GR knockdown in BAT remains unclear. In another study, AdipoCre‐driven constitutive knockdown of GR in all adipose tissues led to reduced BAT thermogenesis after a few hours of cold exposure, with a reduction in lipid droplets indicating that GR deficiency does not impair the lipolytic potential of BAT at 4°C 4. The contribution of this finding to elucidating the function of GR specifically in BAT, however, is ambiguous at best, as the reduction in GR protein affects both WAT and BAT.
Data from cell culture experiments as well as human studies suggest that acute GC treatment can activate thermogenesis in BAT, while chronic administration leads to a reduction in BAT activity 11. Hence, a reduction of GR activity in BAT potentially represents an interesting strategy to potentiate the thermogenic capability of BAT 12, especially under conditions of chronic GC excess. However, the direct contribution of BAT‐GR in these observations remains elusive. In this study, we set out to clarify the role of GR in BAT under different metabolic stressors, including cold exposure and HFD. To this end, we created a UCP1‐dependent, BAT‐specific GR KO mouse (GRBATKO) which we exposed to a variety of metabolic challenges to determine the specific contribution of GR to BAT metabolism and function.
Results
Deletion of GR in BAT does not affect the HPA axis
To examine the direction contribution of GR in BAT to systemic metabolic control, we generated mice lacking the GR specifically in UCP1‐positive BAT (GRBATKO) by crossing mice carrying a floxed GR allele with animals carrying an inducible UCP1‐driven Cre recombinase.
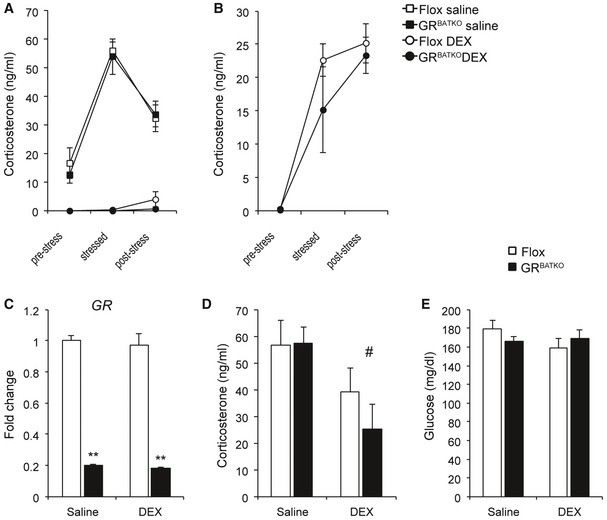
To address potential abnormalities in regulation of the HPA axis in mice deficient of GR in BAT, we initially performed several dexamethasone suppression tests. Flox controls and GRBATKO mice injected with saline showed a similar increase in serum corticosterone levels upon stress induced by transferring individually housed mice to a clean cage (Fig 1A). Moreover, the subsequent reduction in corticosterone levels upon stress relieve by transferring mice to their home cage was similar between both groups (Fig 1A). Injection of dexamethasone reduced corticosterone levels below detection limit in both Flox and GRBATKO mice (Fig 1A). Injection of a lower dosage (to enable detection of smaller differences which might have been covered by the higher dose) led to a higher corticosterone increase, yet showed no difference in the DEX‐induced suppression of endogenous corticosterone production between the two groups (Fig 1B). Two weeks after the last DEX suppression test, control and GRBATKO were injected with either saline or a low dosage of dexamethasone and the organs were collected under conditions of stress and HPA axis activation. Knockdown of GR in BAT was confirmed using qPCR (Fig 1C). Dexamethasone suppressed the endogenous production of corticosterone to a similar degree in control and GRBATKO mice (Fig 1D). Moreover, we did not observe significant differences in blood glucose (Fig 1E), body weight, weights of adipose tissues, or skeletal muscle (Appendix Fig S1A–E). Cholesterol, high‐density lipoprotein, low‐density lipoprotein, total protein, triglycerides, total bile acids, and non‐esterified fatty acids in the serum were unchanged (Appendix Fig S2A–G). Finally, we analyzed the mRNA levels of known GR target genes in the BAT of these animals in the vehicle vs. DEX‐treated condition (Appendix Fig S1F). Under the dexamethasone concentration employed for DEX suppression tests, only the expression of Fkbp5 was induced in the floxed controls upon DEX treatment, which was not observed in GRBATKO. Interestingly, the expression of Per1 and Zbtb16 was markedly lower in the control animals at baseline, indicating that GR knockdown in the BAT does have an effect on gene expression. Together, these data indicated that despite effects on GR target gene expression, GR in BAT is non‐essential for a proper stress response and feedback sensitivity of the HPA axis.
Figure 1. Hypothalamic–pituitary–adrenal axis is functional in GRBATKO mice.
-
APlasma corticosterone levels at baseline, 30 min after induction of stress by placing mice in a clean cage, and after 90 min upon return in the home cage. DEX mice received an injection of dexamethasone at 0.1 mg/kg body weight 150 min before collecting the first blood sample (n = 5–6 animals per group).
-
BFlox and GRBATKO mice were injected with 0.02 mg/kg dexamethasone and the procedure described in (A) was followed to induce stress in order to detect potential differences between Flox and GRBATKO mice which could have been obscured by the higher concentration used in (A) (n = 6–7 animals per group).
-
CGR mRNA levels in BAT of Flox and GRBATKO mice. Organs were harvested in the stressed condition after placing mice for 30 min in a clean cage. Half of the animals received a dexamethasone injection 180 min before onset of the procedure, controls received an injection with saline (n = 5–6 animals per group).
-
DSerum corticosterone levels under stressed conditions in Flox and GRBATKO mice (n = 5–6 animals per group).
-
EBlood glucose levels (n = 5–6 animals per group).
BAT‐GR does not affect cold tolerance
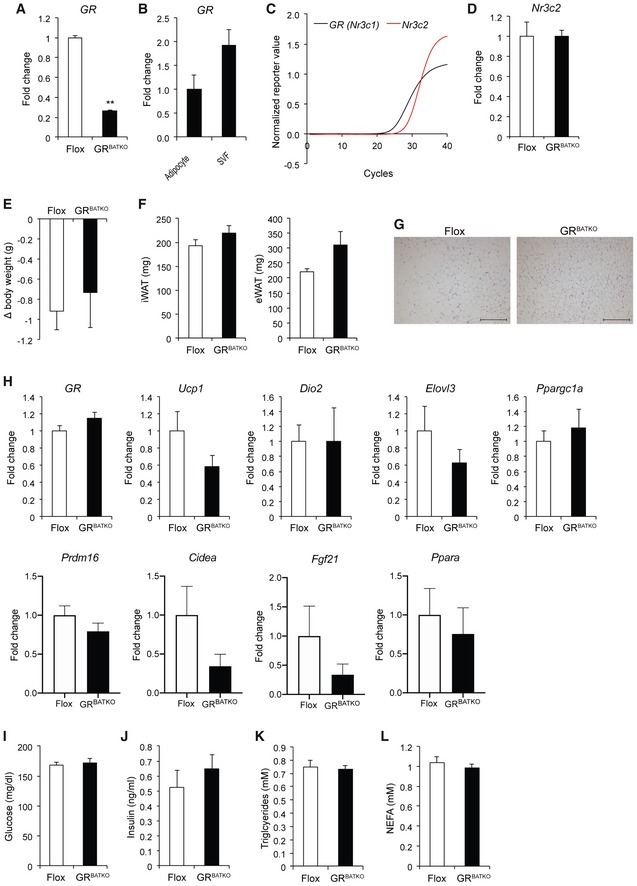
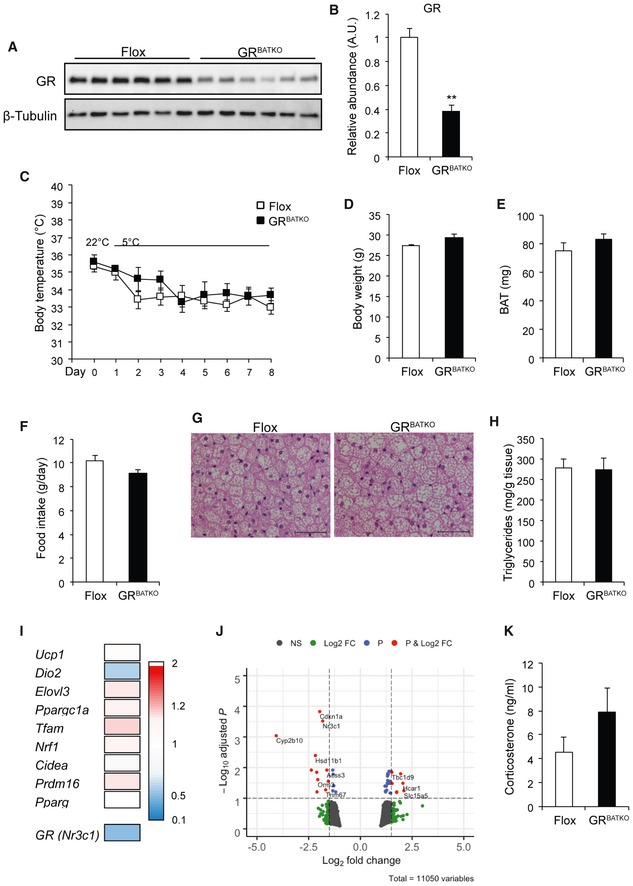
As BAT is the critical organ for the adaptive response to cold, we next exposed Flox control littermates and GRBATKO mice to 5°C for 1 week and monitored body temperature daily. Expression of GR was reduced in BAT at both the mRNA level (Fig EV1A) and protein level (Fig 2A and B) by the end of cold treatment. Residual GR expression was attributable to high levels of GR present in non‐adipocytes (Fig EV1B). Expression of the mineralocorticoid receptor (MR) Nr3c2 was 3–4 cycles lower in comparison with GR, and knockdown of the latter did not affect Nr3c2 expression (Fig EV1C and D), indicating that the MR did not compensate for the loss of GR. Control and GRBATKO mice showed a decrease in body temperature upon transition to 5°C, though no significant differences were apparent over the course of the cold exposure between the two groups (Fig 2C). Cold exposure was associated with weight loss in both genotypes (Fig EV1E), yet no differences in body weight (Fig 2D), BAT weight (Fig 2E), or weights of other adipose organs (Fig EV1F) were observed between the two groups. Also, food intake was comparable between control and GRBATKO mice over the 1‐week experiment (Fig 2F). H&E staining revealed no differences in BAT histology between floxed and GRBATKO mice (Fig 2G), nor was there a difference in BAT lipid deposition (Fig 2H). Cold‐induced appearance of multilocular brown‐like adipocytes in inguinal fat depots was independent of genotype (Fig EV1G and H). Whole‐genome expression profiling revealed that knockdown of GR had no significant effects on the expression of key players in BAT thermogenesis, including Ucp1 and Dio2 (Fig 2I). Nevertheless, significant gene expression changes with a fold change ≥ 2 were detected in the BAT of these animals as is apparent from the volcano plot (Fig 2J). Knockdown of GR in BAT did not affect corticosterone levels during a 1‐week cold exposure (Fig 2K). Finally, analysis of multiple plasma parameters, including glucose, insulin, triglycerides, or NEFA revealed no significant differences between control and GRBATKO mice (Fig EV1I–L). Together, these data suggested that GR in BAT, while affecting gene expression, is in these contexts dispensable for the metabolic adaptation to cold exposure.
Figure EV1. GRBATKO BAT and iWAT are not significantly different from Flox controls under cold exposure.
-
AGR mRNA levels in BAT after 1 week of cold exposure at 5°C (n = 5–6 mice per group).
-
BGR expression in BAT separated into adipocytes and stromal vascular fraction (n = 4 animals per group).
-
CAmplification plots for GR and Nr3c2, indicating lower levels of Nr3c2 being present in BAT (n = 9 animals per group).
-
DNr3c2 expression is unaffected upon knockdown of GR in BAT (n = 5–6 mice per genotype).
-
EBody weight loss over the 1‐week cold exposure (n = 5–6 animals per group).
-
FWeight of white adipose depots (n = 5–6 animals per group).
-
GRepresentative images of H&E‐stained sections from iWAT. Scale bar 200 μm.
-
HqRT–PCR analysis of thermogenic marker gene expression in iWAT (n = 5–6 mice per group).
-
I–LBlood glucose, insulin, triglycerides, and NEFA levels in Flox and GRBATKO animals after 1 week of exposure to 5°C (n = 6 animals per group).
Figure 2. Flox and GRBATKO mice respond similarly to cold.
-
AKnockdown of GR in BAT assessed by immunoblotting. β‐Tubulin was used as loading control.
-
BQuantification of immunoblot in (A) using Image Lab (n = 6 animals per group).
-
CBody temperature over the course of the cold exposure, determined daily (n = 6 animals per group).
-
D, EBody weight and BAT weight at the end of the cold exposure (n = 6 animals per group).
-
FAverage daily food intake in g/day (n = 6 animals per group).
-
GRepresentative hematoxylin and eosin staining image of BAT of cold‐exposed Flox and GRBATKO mice. Scale bar 50 μm.
-
HTriglyceride content in BAT from Flox and GRBATKO animals (n = 5–6 animals per group).
-
IHeatmap of mean gene expression fold changes in thermogenic marker genes based on BAT microarray analysis comparing GRBATKO vs. Flox control animals, indicating unchanged thermogenic marker gene expression. Color gradient ranges from 2‐fold higher expression in GRBATKO over Flox controls (red) to 0.1‐fold (lower) expression (blue) (n = 4 animals per group).
-
JVolcano plot from microarray gene expression data as in (I), with cutoff values for the adjusted P‐value < 0.1 and fold change > 1.5.
-
KSerum corticosterone levels (n = 6 animals per group).
Fasting–refeeding transition is functional in mice deficient in BAT‐GR
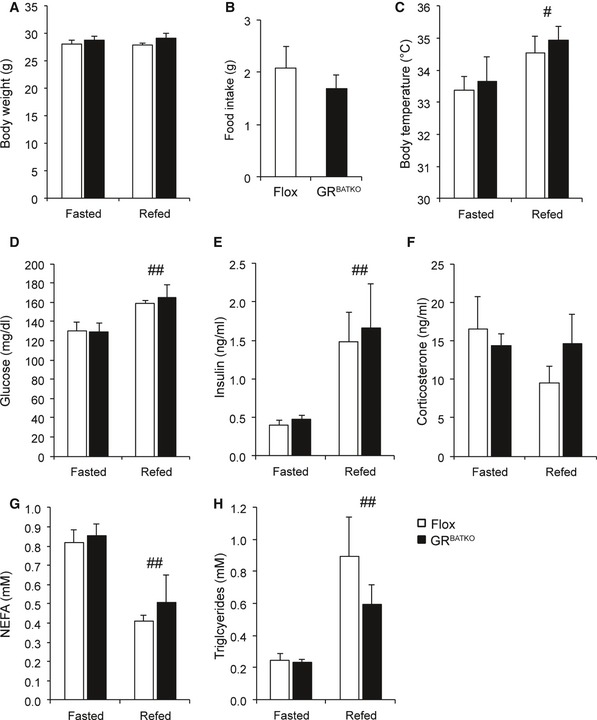
Fasting is associated with an increase in circulating corticosterone levels and NEFAs. Indeed, numerous reports have implicated GR to be involved in the lipolytic response during fasting 4, 5, 6. To further examine the role of BAT‐GR in the adaptive response to fasting, we submitted control and GRBATKO mice to a fasting and refeeding cycle. No differences were observed in body weight after a 16‐h fasting period or subsequent 6 h of refeeding nor in food intake during refeeding (Fig 3A and B). Refeeding led to a significant increase in body temperature in both Flox littermates and GRBATKO mice (Fig 3C). Importantly, analysis of plasma glucose, insulin, corticosterone, non‐esterified fatty acids, and triglycerides showed that metabolic adaptation upon fasting and refeeding took place, yet no differences were observed between Flox and GRBATKO mice (Fig 3D–H). Thus, the GR in BAT is not required for the metabolic adaptations during short‐term fasting and refeeding cycles.
Figure 3. BAT‐GR does not impact the fasting–refeeding transition.
-
ABody weight after 16 h fasting and 6 h chow refeeding at 22°C (n = 6 animals per group).
-
BFood intake during 6 h refeeding (n = 6 animals per group).
-
CBody temperature assessed after 16 h fasting and subsequent refeeding for 6 h (n = 6 animals per group).
-
DBlood glucose (n = 6 per group).
-
E, FSerum insulin and corticosterone levels determined by ELISA (n = 6 animals per group).
-
G, HSerum NEFA and triglycerides concentration in Flox and GRBATKO mice after fasting and refeeding (n = 6 animals per group).
BAT‐GR loss of function is not linked to body weight or metabolic alterations in diet‐induced obesity
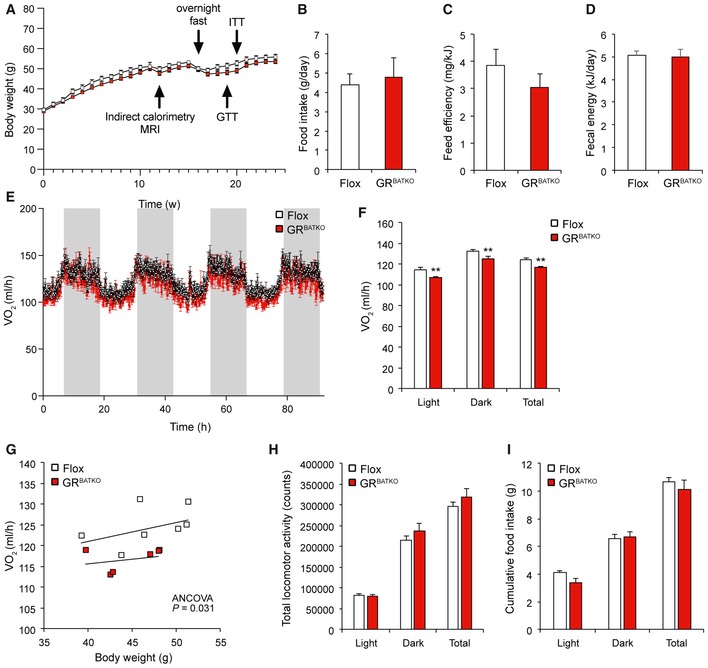
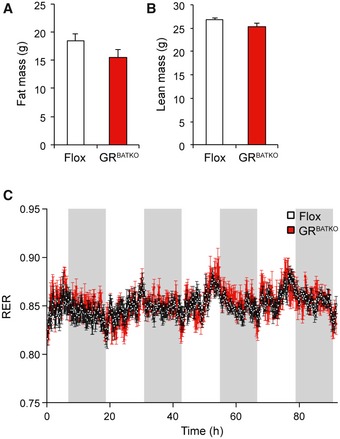
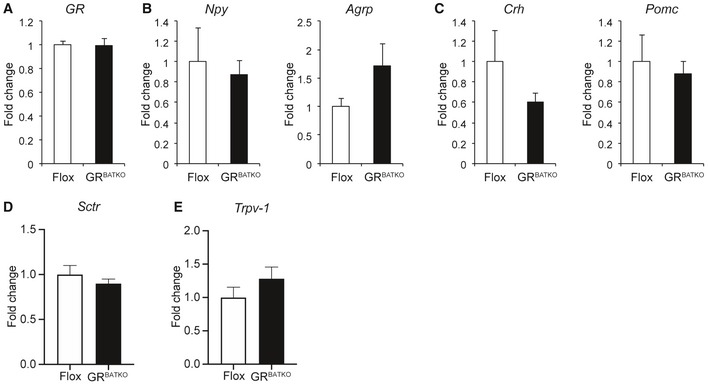
As the short‐term cold and fasting paradigms did not reveal any obvious role for BAT‐GR in the acute adaptation to metabolic stress, we next sought to investigate the role of BAT‐GR in the context of long‐term metabolic challenges, i.e., diet‐induced obesity. Flox control and GRBATKO mice were fed 60% HFD and followed for a period up to 24 weeks. Over the first 10‐week period, no significant differences in body weight were observed between Flox and GRBATKO mice (Fig 4A). Consistent with these observations, we failed to detect differences in food intake, feed efficiency, or fecal energy content (Fig 4B–D). To study the contribution of BAT‐GR to energy metabolism in more detail, we performed indirect calorimetry. After 1 week of adaptation, measurements were performed over a period of 90 h. Remarkably, GRBATKO had a significant decrease in VO2 consumption over the course of the 90 h, which was present during the light and dark phase (Fig 4E and F). Analysis of covariance revealed that the decreased oxygen consumption was independent of body weight (Fig 4G), both before and after indirect calorimetry. MRI analysis failed to identify differences in fat mass or lean mass was between genotypes (Fig EV3A and B). Interestingly, locomotor activity was unchanged upon knockdown of GR in BAT (Fig 4H), whereas a borderline significant (P = 0.058) reduction in food intake was apparent in the GRBATKO animals during the light phase (Fig 4I). Nevertheless, total food intake remained unchanged. As we had also observed tendencies toward lower food intake in GRBATKO mice under cold exposure (Fig 2F), we tested whether deletion of GR in BAT was associated with changes in the expression of hypothalamic regulators of food intake. To this end, we isolated the hypothalamus of Flox and GRBATKO mice at the end of the HFD intervention (Fig EV2). GR was well expressed in hypothalamus (C t values 25–26) but was unaltered upon BAT‐specific deletion of GR (Fig EV2A). Next, mRNA levels of important orexigenic regulators such as Npy and Agrp did not differ between the two genotypes (Fig EV2B). Similarly, expression of anorexigenic regulators Crh and Pomc remained unaltered (Fig EV2C). Lastly, we assessed a potential involvement of GR in the recently discovered Secretin pathway and its impact on the regulation of food intake 13. To this end, we measured levels of Secretin receptor (Sctr) in the BAT, and levels of transient receptor potential vanilloid 1 (Trpv‐1), which is induced in POMC neurons by elevated temperatures and suppresses food intake, in the hypothalamus, neither of which were changed in the GRBATKO animals (Fig EV2D and E). Hence, deletion of GR in BAT is unlikely to interfere with the regulation of appetite control and food intake, via the genes assessed, at a molecular central level.
Figure 4. Knockdown of GR in BAT reduces oxygen consumption.
- A
-
BAverage daily food intake in g (n = 6 cages per genotype).
-
CFeed efficiency to evaluate weight gain per ingested J (n = 6 cages per group).
-
DFecal energy loss over a 3‐day period determined by combustion of lyophilized feces of a subgroup of HFD‐fed mice (n = 9 animals per group).
-
EOxygen consumption over a 90‐h period. Grays columns indicate dark phase (n = 6–8 mice per group).
-
FAverage oxygen consumption specified for light phase, dark phase, and total (n = 6–8 animals per genotype).
-
GTotal oxygen consumption plotted against body weight indicating that lower energy expenditure in GRBATKO animals is independent of body weight (n = 6–8 animals per group).
-
HLocomotor activity over a 90‐h period (n = 6–8 animals per group).
-
ICumulative food intake over the 90‐h period specified for each phase and as grand total (n = 6–8 animals per group).
Figure EV3. GR knockdown in BAT does not significantly change body composition or respiratory exchange ratio.
-
AFat mass measured with echoMRI in conscious Flox and GRBATKO mice (n = 6–8 animals per group).
-
BLean mass in Flox and GRBATKO mice after indirect calorimetry (n = 6–8 animals per genotype).
-
CRespiratory exchange ratio (RER) in Flox and GRBATKO mice measured over a 90‐h period (n = 6–8 animals per genotype).
Figure EV2. Hypothalamic gene expression signature is comparable between GRBATKO and Flox control mice.
-
AGR mRNA levels in hypothalamus of Flox and GRBATKO animals after 24 weeks of high‐fat feeding (n = 5–9 samples per group).
-
BqRT–PCR analysis of orexigenic markers Npy and Agrp (n = 5–9 animals per group).
-
CCrh and Pomc mRNA levels in hypothalami of Flox and GRBATKO mice determined by qRT–PCR (n = 5–9 animals per group).
-
DSctrl mRNA levels in BAT of Flox and GRBATKO mice determined by qRT–PCR (n = 9–11 animals per group).
-
ETrpv‐1 mRNA levels in BAT of Flox and GRBATKO mice determined by qRT–PCR (n = 5–9 animals per group).
Finally, respiratory exchange ratio (RER) did not differ between the two groups, indicating that BAT‐GR does not impact substrate utilization (Fig EV3C). Taken together, these data suggested that mice lacking GR in their BAT have lower oxygen consumption under conditions of high‐fat feeding but the reduction in energy expenditure was not sufficient to be translated into body weight phenotypes.
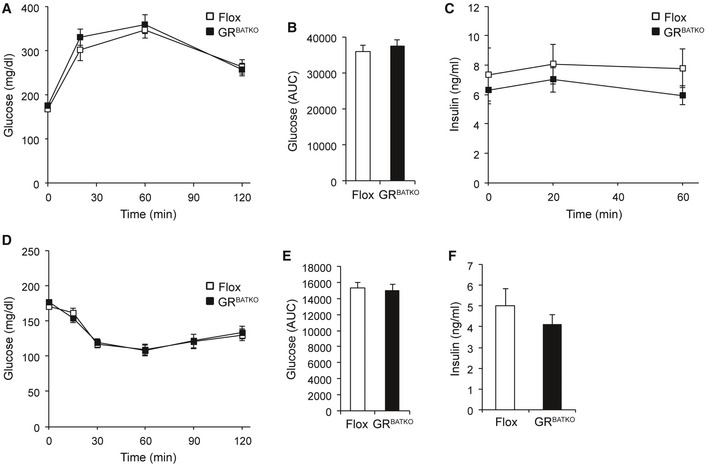
To gain additional insight into the metabolic consequences of BAT‐GR deficiency under HFD conditions, we allowed the mice to gain body weight for an additional 6 weeks (a total of 16 weeks on HFD) and then collected blood after an overnight fast. Fasting glucose and insulin levels were unchanged between the two groups after 16 weeks of HFD intervention (Fig EV4A and B). Similarly, fasting corticosterone levels, NEFA, and triglycerides were unaffected by loss of GR in BAT (Fig EV4C–E). Previous reports have linked adipose tissue GR to the regulation of glucose homeostasis, with changes in glucose tolerance 4, 5, 14. To test the potential contribution of BAT‐GR in such a scenario, we performed glucose and insulin tolerance tests after 19 and 20 weeks of HFD, respectively. In contrast to models in which GR is lost in all adipose depots, BAT‐specific deletion of GR did not affect HFD‐induced glucose intolerance (Fig 5A and B). Moreover, insulin levels during the glucose tolerance test (GTT) were comparable between Flox and GRBATKO mice (Fig 5C). In line with these findings, we did not detect differences in insulin‐induced glucose lowering during an ITT (Fig 5D–E), nor was there a difference in fasting insulin levels before the start of the ITT (Fig 5F).
Figure EV4. GRBATKO react comparably to Flox controls to an overnight fast.

-
A–EPlasma metabolites in Flox and GRBATKO mice fed HFD for 16 weeks. Blood collected after an overnight fast (n = 13–14 mice per group). Error bars represent SEM.
Figure 5. Deletion of GR from BAT does not affect glucose handling.
-
AIntraperitoneal GTT after 19 weeks of HFD‐feeding, glucose injections at 1.5 mg/g of body weight (n = 11–13 animals per group).
-
BArea under the curve calculated from (A) (n = 11–13 animals per group).
-
CPlasma insulin levels during GTT (n = 11–13 animals per group).
-
DIntraperitoneal ITT after 20 weeks of high‐fat diet intervention. Insulin was adjusted to 1 mU/g of body weight (n = 11–13 animals per group).
-
EArea under the curve determined from (D) (n = 11–13 animals per group).
-
FPlasma insulin levels after a 5‐h fast, before injecting insulin (n = 11–13 animals per group).
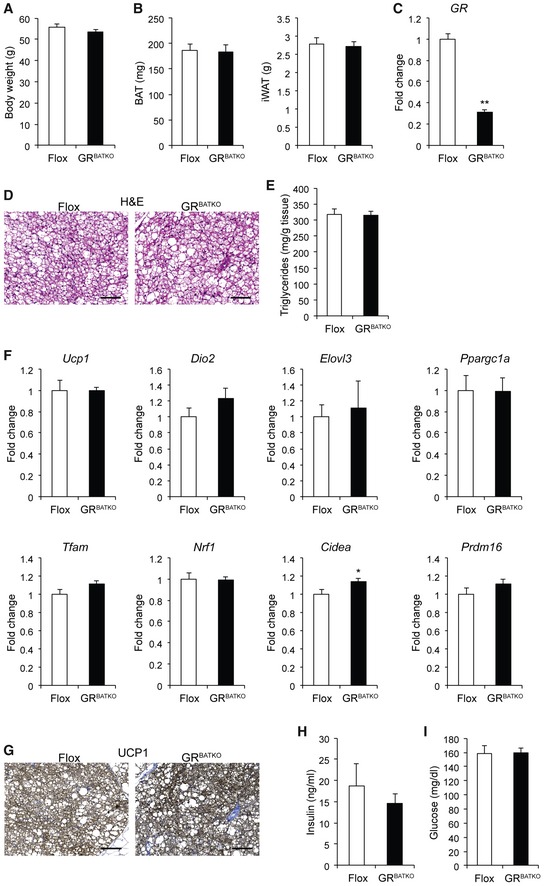
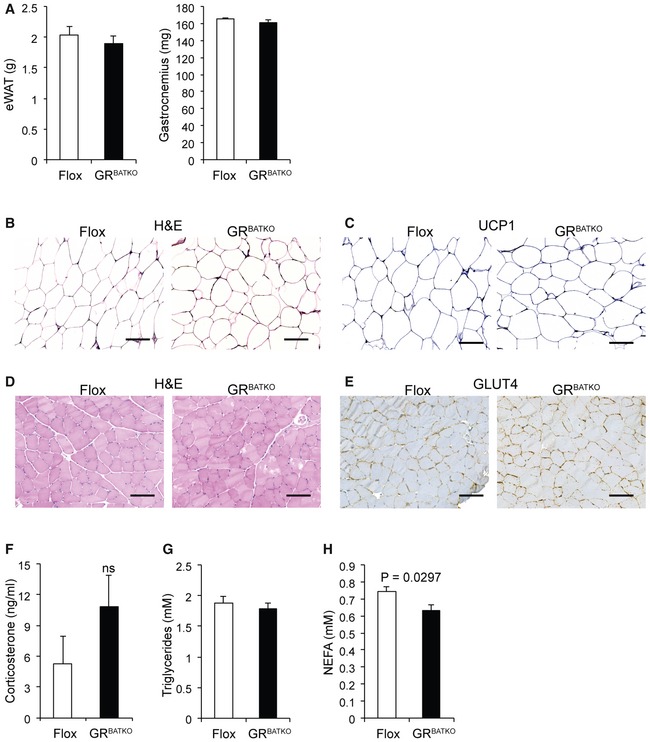
So far, we had observed that loss of GR in BAT affected energy expenditure during a 10‐week HFD intervention, but this had not lead to changes in glucose handling at 19 weeks. To get an understanding of the potential long‐term effect of decreased energy expenditure, we followed up on the same cohort of mice for another 4 weeks. Interestingly, by the end of the study after a total of 24 weeks of HFD feeding, average body weights of Flox and GRBATKO mice reached 55.8 and 53.5 g, respectively, but the difference failed to reach statistical significance (Fig 6A). Also, there were no significant differences in weights of BAT, iWAT, eWAT, and gastrocnemius (Figs 6B and EV5A). The knockdown of GR in BAT (Fig 6C) had no major impact on tissue histology (Fig 6D) or lipid content (Fig 6E). Gene expression analysis of thermogenic markers in BAT showed no change in the expression of Ucp1, Dio2, Elovl3, Ppargc1a, Tfam, Nrf1, or Prdm16, although a minor but significant increase in Cidea was observed upon knockdown of GR in BAT (Fig 6F). Unchanged levels of UCP1 were confirmed using immunohistochemistry (Fig 6G). Recent publications suggested that manipulation of BAT can induce compensatory thermogenic changes in iWAT 15. However, histologic examination of iWAT revealed unchanged tissue anatomy between the two genotypes (Fig EV5B and C). Next, we examined the histology of the gastrocnemius muscle, as GC excess suppresses GLUT4 recruitment to the plasma membrane in skeletal muscle 16, but again found no difference (Fig EV5D and E). Finally, after 24 weeks of HFD feeding, there was no change in serum insulin, glucose, corticosterone, triglycerides, or cholesterol (Figs 6H and I, and EV5F–H). Overall, these data indicate that under diet‐induced obesity conditions, the contribution of GR to BAT physiology and function is at most very minor. The GR in BAT, despite its small effect on energy expenditure, seems to be largely dispensable for the control of body weight, body composition and glucose homeostasis.
Figure 6. Weight gain in GRBATKO mice is comparable to Flox animals with prolonged high‐fat feeding.
-
ABody weight in Flox and GRBATKO after 24 weeks of high‐fat feeding (n = 10–13 animals per group).
-
BBAT and iWAT weight in Flox and GRBATKO mice fed HFD for 24 weeks (n = 10–13 animals per group).
-
CGR levels in BAT after 24 weeks high‐fat feeding (n = 10–13 mice per group).
-
DRepresentative H&E‐stained sections of BAT from Flox and GRBATKO animals. Scale bar 100 μm.
-
ETriglyceride content in BAT per gram of wet tissue (n = 10–13 animals per group).
-
FqRT–PCR analysis of thermogenic marker gene expression in BAT of Flox and GRBATKO mice after high‐fat feeding (n = 9–13 animals per group).
-
GRepresentative immunohistochemistry for UCP1 in BAT. Scale bar 100 μm.
-
HSerum insulin levels determined by ELISA (n = 10–13 animals per group).
-
IBlood glucose in Flox and GRBATKO animals after 24 weeks HFD (n = 10–13 animals per group).
Figure EV5. Tissue weight, morphology, and metabolic parameters on HFD do not differ between GRBATKO mice and Flox controls.
-
AeWAT and gastrocnemius tissue weights of Flox and GRBATKO mice fed a HFD for 24 weeks (n = 4–6 mice per group).
-
BRepresentative H&E staining of iWAT from Flox and GRBATKO mice fed a HFD for 24 weeks (n = 10–13 mice per group). Scale bar 100 μm.
-
CRepresentative immunohistochemistry for UCP1 in BAT (n = 10–13 mice per group). Scale bar 100 μm.
-
DRepresentative H&E staining of gastrocnemius muscle from Flox and GRBATKO mice fed HFD for 24 weeks (n = 10–13 mice per group). Scale bar 100 μm.
-
ERepresentative immunohistochemistry for GLUT4 in gastrocnemius muscle (n = 10–13 mice per group). Scale bar 100 μm.
-
F–HSerum corticosterone, triglyceride, and NEFA levels in Flox and GRBATKO animals at the end of the HFD study (n = 10–13 animals per group).
Discussion
Following the resurgent interest in human BAT over the past decades, a recent study dissected the effect of acute vs. chronic GC excess in adult humans 11. GCs acutely increase BAT activity in humans, but seem to dampen it during longer GC administration. Interestingly, the study also points out a species difference regarding this effect, as in vitro, human brown adipocytes react by increasing their respiration, while the opposite effect is shown in murine brown and beige adipocytes. However, this species‐specific regulation was not shown in vivo, disregarding the systemic relevance of the effect. Moreover, as only 4% of the 129 patients in the retrospective study on longer‐term GC treatment had detectable glucose uptake by BAT, further investigation and dissection of the specific contribution of GR to the observed effects are highly warranted. Here, we investigated the role of GR in BAT using for the first time a BAT‐specific UCP1‐Cre GR‐knockout model, the GRBATKO mouse, in a variety of metabolic challenges.
Despite a lot of suggestive evidence for the relevance of GR to adipose tissue differentiation and function, recent findings have cast doubt on the assumption that GR is crucial for adipose tissue expansion and adipose tissue‐mediated glucose tolerance: Three recent studies have analyzed the effect of adipose‐specific GR knockdown in diet‐induced obesity 4, 5, 6. Only Mueller et al 4 found a significant reduction under basal conditions of GR knockdown on HFD weight gain, which may, however, be attributable to the early start of HFD feeding in this study (3–5 weeks of age), while neither Mueller nor Shen reported any difference in adipose tissue morphology (this was not assessed in the study by Abulizi et al) 4, 5, 6. In accordance with these studies, we did not find an effect of GR depletion in BAT on weight gain during a 24‐week HFD (Fig 6A), nor an effect on BAT histology and TG content (Fig 6D and E). However, while Mueller et al reported reduced thermogenesis during acute cold exposure, and Shen found decreased systemic cold‐induced lipolysis after 4 h at 4°C—both indicators of reduced BAT function under physiological stress 4, 5, we observed no difference in the ability of GRBATKO mice and controls to defend body temperature during 8 days of exposure to 5°C (Fig 2C). Interestingly, we observed no changes in gross BAT anatomy during cold exposure in GRBATKO mice (Fig 2G), while mice with adipose‐specific GR‐knockout (GRadipoKO mice) were reported to show a larger decrease in the number of lipid droplets than controls during a short‐term cold challenge 4. Combined, these data could indicate that the defect in thermogenesis observed in previous studies arises from the GR depletion in the WAT, rather than in the BAT. Another hypothesis could be that the repression of BAT metabolism in murine cells observed in previous studies is not mediated by GR but rather the repression of ACTH secretion via the HPA axis feedback loop, as ACTH was recently found to stimulate UCP1‐mediated respiration in murine primary brown adipocytes in vitro 17.
In contrast to the lack of an effect of GRBATKO on energy expenditure under cold exposure, after 10 weeks of HFD energy expenditure was slightly decreased in GRBATKO mice (Fig 4E and F). BAT has been implicated to play a role in meal‐induced thermogenesis 18, 19, potentially via GCs acting centrally on BAT thermogenic activity 20, or via the recently discovered Secretin pathway 13. Secretin is released from the gut after a meal and acts directly on BAT to stimulate post‐prandial thermogenesis and induce satiation. As this pathway was found to affect meal patterns rather than cumulative food intake, one could hypothesize that the non‐significant trends we found regarding decreased food intake during the light phase on a HFD (Fig 4I) might be linked to the Secretin pathway. However, in GRBATKO mice, neither Secretin receptor levels in the BAT nor Trpv‐1 levels in the hypothalamus were changed (Fig EV2D and E), making an involvement of the Secretin pathway unlikely. Thus, our results hint to the point that GR in BAT might in a different way contribute to meal‐induced thermogenesis during a period of caloric excess.
GCs have been hypothesized to exert the majority of their tissue‐specific actions based on the local activity of the enzyme 11β‐HSD1, which converts inactive 11‐dehydrocorticosterone to the active corticosterone in rodents, or cortisol in humans 21. Corticosterone excess caused by administration via the drinking water suppresses the induction of UCP1 in the BAT of control mice, while in whole‐body 11β‐HSD1 knockout mice, UCP1 levels were not elevated in response to the corticosterone treatment 22. Moreover, primary brown adipocytes from these knockout mice showed elevated mitochondrial function, and aged 11β‐HSD1 knockout mice displayed improved BAT function compared to controls. In the context of our findings, the obvious BAT phenotype of the whole‐body 11β‐HSD1 loss of function seems curious, as an 11β‐HSD1 loss of function should lead to lower intracellular availability of “active” corticosterone, which in turn should lead to reduced GR activation and thus produce a similar phenotype as a genetic knockdown of GR (e.g., GRBATKO). However, we observe no significant effects on UCP1 expression or BAT function in GRBATKO mice. The effects of GCs in the adipose tissue were previously described to be mediated mainly via the GR, not the MR 23. Nonetheless, one might hypothesize that in BAT, the effect of 11β‐HSD1 loss (and thus, presumably, a reduction in active corticosterone/cortisol levels) affects BAT metabolism via MR after all, which compared to GR has a 10× higher affinity for GCs 14. Alternatively, decreased local GC levels in other metabolic tissues such as liver, muscle, or white adipose tissue might lead to a change in substrate availability for BAT, thus producing the described BAT phenotype. Either way, further studies are needed to clarify the contribution of MR to BAT metabolism and its reaction to GC excess.
Mueller et al 4 had found that adipose GR is crucial for the feeding–fasting transition under conditions of long‐term fasting (48 h) and that GR depletion in the adipose tissue leads to a failure to mobilize stored adipose tissue and induce lipolysis. In contrast to short‐term fasting (4 and 16 h), glucose levels after 48 h fasting are increased in the GRadipoKO, potentially owing to lean mass catabolism induced by increased GC levels. In accordance with these data, we found no changes in blood glucose, insulin, corticosterone, or NEFA levels after 16‐h fasting (Fig 3F–H). Small increases in body temperature, glucose and insulin levels, and plasma NEFAs were observed after 4‐h refeeding in both groups (Fig 3C–H), which indicates that the fasting challenge per se did elicit the expected effects without showing any significant differences between genotypes. In Fig 3H, one might speculate that there could be a trend toward lower plasma triglycerides in the refed state in the GRBATKO animals that our study is underpowered to detect at n = 6. If this were true, one could hypothesize some interplay with liver lipid metabolism leading to enhanced uptake of VLDL remnants by the liver. A similar effect has been observed in a previous study by inhibiting a GR‐driven microRNA in the liver 24. This may be fertile ground for future exploration. Overall, however, the effects observed are too small to be considered statistically significant, with a high standard error. Given the involvement of the GC/GR axis in systemic glucose metabolism and lipid metabolism 25, 26, these data favor the notion that, in contrast to its metabolic importance in WAT, GR in BAT does not impair the feeding–fasting transition.
Another way of assessing of the metabolic fitness of an organism is to challenge the animal with a high dose of glucose administrated in the course of a GTT. As longer‐term GC excess can lead to reduced glucose tolerance 5, the contribution of GR in BAT to systemic glucose tolerance presents an interesting research question. Recent studies on the effect of GR depletion in the adipose tissue on glucose tolerance in a state of DIO report conflicting evidence: Mueller et al 4 found that glucose intolerance on an 18‐week HFD was alleviated in GRadipoKO mice, while Shen et al 5 reported no difference in glucose and insulin tolerance after 12–13 weeks of HFD. Similar to the latter study, we did not observe these metabolic improvements in GRBATKO mice compared to floxed controls after a 19‐week HFD. While data gained from GRadipoKO and GRBATKO mice cannot be directly compared, the discrepancy between the findings of Shen et al (GRadipoKO) and our own (GRBATKO) compared to Müller et al, however, might again reflect the impact of HFD feeding on adults compared to young animals (3–5 weeks) in the latter study, where the decreased lipolytic ability of GRadipoKO mice leads to less hepatic steatosis, lower plasma NEFAs, and thus better systemic glucose tolerance, probably via a reduction in gluconeogenesis 4, 27. However, to definitively answer this research question, it would be necessary to compare in one study animals of ideally both genotypes and have detailed experimental evidence of glucose clearance in obese mice induced via the diet at a young compared to an adult age.
In contrast to the research discussed above, Desarzens et al 14 found disturbed GT on high‐fat high‐sucrose diet in GRadipoKO mice. However, this result may have arisen due to the interplay of sucrose with an abundance of fat in the diet in general—as sucrose is known to impair insulin‐mediated glucose clearance 28, 29—and the GC/GR axis in particular.
Despite a number of in vitro studies suggesting an important role of the GR in both white and brown adipose tissue differentiation and cell function 11, 23, 30, 31, 32, more recent studies have revealed that the absence of the GR in WAT is dispensable for WAT differentiation and function in vivo 4, 9, 33. In this respect, our genetic loss‐of‐function study now addresses a key question in the field of BAT research and GR‐dependent endocrine control of metabolism by demonstrating that in contrast to previous assumptions, the GR in BAT is largely dispensable for systemic energy homeostasis during both short and long‐term metabolic adaptations. One limitation of our study is that our mouse experiments were conducted at 22°C, which is below thermoneutrality for mice 34. A recent investigation provides evidence that UCP1 protein levels are reduced 100‐fold by corticosterone treatment in mice housed 30°C but not at 22°C 35. Thus, there may still be an effect of BAT‐specific GR KO at thermoneutrality (30°C for mice), which we could not test in our study. However, the same study found that GC‐induced obesity develops independently of UCP1 levels in BAT. This is in line with our findings, which point to a negligible contribution of GR to BAT function and need to be taken into account during the development of novel GR‐based therapeutic approaches targeting body weight and metabolic parameters in obesity as well as during attempts to ameliorate GC side effects in anti‐inflammatory regimens.
Materials and Methods
Animals
Brown adipose tissue (BAT)‐specific GR‐knockout mice (GRBATKO) were generated by crossing Ucp1CreERT2 mice 36, 37 with floxed GR mice. Knockout was induced in adult male animals by injection with 2 mg tamoxifen per day, for five consecutive days. Ucp1–CreERT2‐positive and Ucp1–CreERT2‐negative littermate controls were used for all experiment. Experiments were performed 2 weeks post‐tamoxifen injection. All mice were maintained on a 12‐h light–dark cycle at 22°C with unlimited access to chow and water, unless stated otherwise. For the dexamethasone suppression test, 13‐ to 19‐week‐old mice were used. Body temperature of cold‐exposed mice was monitored through IPTT‐300 transponders that were surgically implanted subcutaneously 3 weeks prior to the experiment (Bio Medic Data Systems, Seaford, USA). Cold‐exposed mice were 16–20 weeks old at the start of the experiment and were exposed to 5°C for 1 week. For measuring glucose and lipid parameters as well as all other metabolic phenotypes (except for fecal energy content) upon high‐fat diet exposure, mice were fed D12492 containing 60 kcal% fat (Research Diets) ad libitum for a total of 24 weeks. As 60% dietary fat content prevented accurate fecal energy content determination due to overlipidated feces, a separate cohort of mice was placed on D12451 containing only 45 kcal% fat for measuring fecal energy content. All mice were 9–14 weeks old at the time of HFD initiation. Animals were sacrificed at ZT + 2, except for the dexamethasone suppression test, for which they were sacrificed at ZT + 9.
Animal experiments were performed in accordance with the Directive 2010/63/EU from the European Union and the German Welfare Act, after approval by local authorities.
Glucose and insulin tolerance tests
Glucose and insulin tolerance tests were performed as described previously 38 after 19 and 20 weeks of high‐fat feeding, respectively. In short, animals were fasted for 6 h and subsequently injected intraperitoneally with glucose at 1.5 g/kg body weight. Blood samples were taken from the tail vein before and 20, 60, and 120 min after the i.p. injection to assess glucose tolerance. For the insulin tolerance test, animals were fasted for 6 h and, after taking a baseline blood sample, i.p. injected with insulin at a dosage of 1 U/kg body weight (HUMINSULIN Normal 100, Lilly Germany, Bad Homburg). Subsequent blood samples were drawn from the tail vein 15, 30, 60, 90, and 120 min after the insulin injection. Glucose measurements throughout the tests were performed with an AccuChek Performa glucose meter.
Dexamethasone suppression test
To assess the hypothalamus–pituitary–adrenal axis (HPA axis), mice were subcutaneously injected with saline or DEX (Sigma, D4902) and a first blood sample was collected 2.5 h later via the tail vein (pre‐stress). Next, the animals were placed in a clean cage with access to food and water to induce stress and a second blood sample was collected after 30 min (stressed condition). Finally, the animals were placed back in their original cage and a last blood was collected 90 min later (post‐stress).
Metabolic phenotyping
Animals were acclimatized to individual housing and the TSE PhenoMaster cages (TSE Systems, Bad Homburg, Germany) 1 week before the actual indirect calorimetry analysis was performed. Food consumption, locomotor activity, and energy expenditure were recorded over a 90‐h period. Body composition was analyzed prior and upon exiting the PhenoMaster system using whole‐body magnetic resonance analysis (EchoMRI, Houston, TX). Analysis of energy expenditure was carried in accordance published guidelines using analysis of covariance (ANCOVA) with body composition (lean and fat mass) as covariates 39. Fecal energy content was determined using the IKA‐WERKE C 7000 bomb calorimeter using around 300 mg of lyophilized feces.
Gene expression analysis
Frozen tissues were homogenized in QIAzol lysis reagent (Qiagen) using the Qiagen TissueLyser II and stainless‐steel beads. One microgram of RNA was subsequently used to synthesize cDNA with the aid of a First Strand cDNA synthesis kit (Thermo Scientific). qPCRs were performed using Taqman master mix and Taqman probes (Life Technologies, Darmstadt, Germany) on a 384‐well format QuantStudio 6 Flex Real‐Time PCR System (Thermo Scientific).
RNA from a selection of brown adipose tissue was purified with RNeasy Minikit columns (Qiagen) and analyzed with RNA 6000 Nano chips and the Agilent 2100 Bioanalyzer (Agilent Technologies, Waldbronn, Germany). One hundred nanogram of purified RNA was labeled using the Ambion WT expression kit (Invitrogen) and hybridized to an Affymetrix Mouse Gene 1.1 ST array plate (Affymetrix, Santa Clara, CA). Subsequent hybridization, washing, and scanning were carried out on an Affymetrix GeneTitan platform. Processing and analysis of raw data was performed according to published methods 40.
A volcano plot has been generated using the R package EnhancedVolcano (Blighe K, https://bioconductor.org/packages/release/bioc/html/EnhancedVolcano.html). EnhancedVolcano: Publication‐ready volcano plots with enhanced coloring and labeling. R package version 1.2.0, https://github.com/kevinblighe/EnhancedVolcano.), with cutoff values for the adjusted P‐value < 0.1 and fold change > 1.5.
Histology
Fresh adipose tissues were fixed in Roti®‐Histofix 4% (Carl Roth, Karlsruhe, Germany), dehydrated, and embedded in paraffin. Standard protocols were used to perform H&E staining. Immunohistochemistry was done with the aid of an automated slide staining system (Discovery XT, Ventana Medical Systems, Tucson, AZ) and the following antibodies: UCP1 (1:1,500, Abcam ab10983) and GLUT4 (1:500, Abcam ab33780).
Protein analysis
Tissues were lysed using Pierce IP lysis buffer followed by quantification using the Pierce BCA kit. Samples were diluted using 5× Laemmli sample buffer with DTT, boiled, and loaded onto Novex WedgeWell 8–16% Tris‐Glycine Mini Gels (ThermoFisher Scientific) 4–16% denaturing gels. Transfer of protein onto PVDF membrane was carried out using a Transblot Turbo System (Bio‐Rad). Membranes were blocked with 5% skimmed milk powder in TBS‐T for 1 h and subsequently incubated overnight at 4°C with anti‐GR antibody (Santa Cruz, sc‐1004) or anti‐β‐tubulin antibody (Cell Signaling, #2128) diluted 1:500 and 1:5,000, respectively, in TBS‐T containing 3% BSA. Visualization was performed using Pierce ECL Western Blotting Substrate and a Bio‐Rad Chemidoc imaging system.
Serum analyses
Serum corticosterone and insulin levels were determined using commercially available ELISA kits: Enzo Life Sciences Corticosterone ELISA kit ADI‐900‐097 and the ALPCO Mouse Ultrasensitive Insulin ELISA 80‐INSMSU‐E01. Non‐esterified fatty acids were measured using a NEFA‐HR(2) kit (Wako Chemicals GmbH, Neuss, Germany). Triglycerides were determined using a TR0100 Serum Triglyceride Determination Kit (Sigma‐Aldrich).
Tissue triglyceride analysis
Lipids from BAT were extracted using the Folch method, and triglycerides were subsequently quantified using the TR0100 Serum Triglyceride Determination Kit (Sigma‐Aldrich).
Statistical analysis
Two‐tailed unpaired t‐test was performed to analyze one‐factorial designs. For multiple comparisons, two‐way ANOVA with Tukey's multiple comparisons test was performed in GraphPad Prism. Analysis of covariance for the oxygen consumption data was performed using SPSS25.
Author contributions
CG, FM, ESV, AAK, MRG, KF, AJR, NP and MS performed and analyzed experiments. TM, PN, and HU generated and analyzed metabolic phenotyping data. SH designed experiments, supervised, and analyzed data. CG and SH wrote the article.
Conflict of interest
The authors declare that they have no conflict of interest.
Supporting information
Appendix
Expanded View Figures PDF
Review Process File
Acknowledgements
We thank Tjeerd Sijmonsma, Anastasia Georgiadi, and Jeanette Biebl for expert technical support and experimental samples. This work was supported by grants from the Deutsche Forschungsgemeinschaft (SFB‐TR 205 to H.U., N.P., and S.H.; Schwerpunktprogramm 1629 ThyroidTransAct (TS 226/3‐1) and SFB TRR 152/2, P23 to T.M.) and the Helmholtz Future Topic “Aging and Metabolic Reprogramming (AMPro)” (to S.H.).§
EMBO Reports (2019) 20: e48552
Correction added on 5 November 2019, after first online publication: Title was corrected
Footnotes
Correction added on 5 November 2019, after first online publication: Acknowledgements section was corrected.
Data availability
The dataset produced in this study is available in the following database: Microarray gene expression data: Gene Expression Omnibus (GSE13554) (https://www.ncbi.nlm.nih.gov/geo/query/acc.cgi?acc=GSE135544).
References
- 1. Raff H, Carroll T (2015) Cushing's syndrome: from physiological principles to diagnosis and clinical care. J Physiol 593: 493–506 [DOI] [PMC free article] [PubMed] [Google Scholar]
- 2. Ferraù F, Korbonits M (2015) Metabolic comorbidities in Cushing's syndrome. Eur J Endocrinol 173: M133–M157 [DOI] [PubMed] [Google Scholar]
- 3. Simonyte K, Rask E, Näslund I, Angelhed J‐E, Lönn L, Olsson T, Mattsson C (2009) Obesity is accompanied by disturbances in peripheral glucocorticoid metabolism and changes in FA recycling. Obesity 17: 1982–1987 [DOI] [PubMed] [Google Scholar]
- 4. Mueller KM, Hartmann K, Kaltenecker D, Vettorazzi S, Bauer M, Mauser L, Amann S, Jall S, Fischer K, Esterbauer H et al (2017) Adipocyte glucocorticoid receptor deficiency attenuates aging‐ and HFD‐induced obesity and impairs the feeding‐fasting transition. Diabetes 66: 272–286 [DOI] [PubMed] [Google Scholar]
- 5. Shen Y, Roh HC, Kumari M, Rosen ED (2017) Adipocyte glucocorticoid receptor is important in lipolysis and insulin resistance due to exogenous steroids, but not insulin resistance caused by high fat feeding. Mol Metab 6: 1150–1160 [DOI] [PMC free article] [PubMed] [Google Scholar]
- 6. Abulizi A, Camporez J‐P, Jurczak MJ, Høyer KF, Zhang D, Cline GW, Samuel VT, Shulman GI, Vatner DF (2019) Adipose glucocorticoid action influences whole‐body metabolism via modulation of hepatic insulin action. FASEB J 33: 8174–8185 [DOI] [PMC free article] [PubMed] [Google Scholar]
- 7. Berry R, Jeffery E, Rodeheffer MS (2014) Weighing in on adipocyte precursors. Cell Metab 19: 8–20 [DOI] [PMC free article] [PubMed] [Google Scholar]
- 8. Steger DJ, Grant GR, Schupp M, Tomaru T, Lefterova MI, Schug J, Manduchi E, Stoeckert CJ, Lazar MA (2010) Propagation of adipogenic signals through an epigenomic transition state. Genes Dev 24: 1035–1044 [DOI] [PMC free article] [PubMed] [Google Scholar]
- 9. Park Y‐K, Ge K (2016) Glucocorticoid receptor accelerates, but is dispensable for, adipogenesis. Mol Cell Biol 37: e00260‐16 [DOI] [PMC free article] [PubMed] [Google Scholar]
- 10. Sanchez‐Gurmaches J, Hung C‐M, Sparks CA, Tang Y, Li H, Guertin DA (2012) PTEN loss in the Myf5 lineage redistributes body fat and reveals subsets of white adipocytes that arise from Myf5 precursors. Cell Metab 16: 348–362 [DOI] [PMC free article] [PubMed] [Google Scholar]
- 11. Ramage LE, Akyol M, Fletcher AM, Forsythe J, Nixon M, Carter RN, van Beek EJR, Morton NM, Walker BR, Stimson RH (2016) Glucocorticoids acutely increase brown adipose tissue activity in humans, revealing species‐specific differences in UCP‐1 regulation. Cell Metab 24: 130–141 [DOI] [PMC free article] [PubMed] [Google Scholar]
- 12. Kroon J, Koorneef LL, van den Heuvel JK, Verzijl CRC, van de Velde NM, Mol IM, Sips HCM, Hunt H, Rensen PCN, Meijer OC (2017) Selective glucocorticoid receptor antagonist CORT125281 activates brown adipose tissue and alters lipid distribution in male mice. Endocrinology 159: 535–546 [DOI] [PubMed] [Google Scholar]
- 13. Li Y, Schnabl K, Gabler SM, Willershäuser M, Reber J, Karlas A, Laurila S, Lahesmaa M, U Din M, Bast‐Habersbrunner A et al (2018) Secretin‐activated brown fat mediates prandial thermogenesis to induce satiation. Cell 175: 1561–1574.e12 [DOI] [PubMed] [Google Scholar]
- 14. Desarzens S, Faresse N (2016) Adipocyte glucocorticoid receptor has a minor contribution in adipose tissue growth. J Endocrinol 230: 1–11 [DOI] [PubMed] [Google Scholar]
- 15. Schulz TJ, Huang P, Huang TL, Xue R, McDougall LE, Townsend KL, Cypess AM, Mishina Y, Gussoni E, Tseng Y‐H (2013) Brown‐fat paucity due to impaired BMP signalling induces compensatory browning of white fat. Nature 495: 379–383 [DOI] [PMC free article] [PubMed] [Google Scholar]
- 16. Dimitriadis G, Leighton B, Parry‐Billings M, Sasson S, Young M, Krause U, Bevan S, Piva T, Wegener G, Newsholme EA (1997) Effects of glucocorticoid excess on the sensitivity of glucose transport and metabolism to insulin in rat skeletal muscle. Biochem J 321(Pt 3): 707–712 [DOI] [PMC free article] [PubMed] [Google Scholar]
- 17. Schnabl K, Westermeier J, Li Y, Klingenspor M (2019) Opposing actions of adrenocorticotropic hormone and glucocorticoids on UCP1‐mediated respiration in brown adipocytes. Front Physiol 9: 1–14 [DOI] [PMC free article] [PubMed] [Google Scholar]
- 18. Glick Z, Wu SY, Lupien J, Reggio R, Bray GA, Fisher DA (1985) Meal‐induced brown fat thermogenesis and thyroid hormone metabolism in rats. Am J Physiol Metab 249: E519–E524 [DOI] [PubMed] [Google Scholar]
- 19. Vosselman MJ, Brans B, van der Lans AA, Wierts R, van Baak MA, Mottaghy FM, Schrauwen P, van Marken Lichtenbelt WD (2013) Brown adipose tissue activity after a high‐calorie meal in humans. Am J Clin Nutr 98: 57–64 [DOI] [PubMed] [Google Scholar]
- 20. Guimarães RB, Telles MM, Coelho VB, Mori RC, Nascimento CM, Ribeiro EB (2002) Adrenalectomy abolishes the food‐induced hypothalamic serotonin release in both normal and monosodium glutamate‐obese rats. Brain Res Bull 58: 363–369 [DOI] [PubMed] [Google Scholar]
- 21. Kadmiel M, Cidlowski JA (2013) Glucocorticoid receptor signaling in health and disease. Trends Pharmacol Sci 34: 518–530 [DOI] [PMC free article] [PubMed] [Google Scholar]
- 22. Doig CL, Fletcher RS, Morgan SA, McCabe EL, Larner DP, Tomlinson JW, Stewart PM, Philp A, Lavery GG (2017) 11β‐HSD1 modulates the set point of brown adipose tissue response to glucocorticoids in male mice. Endocrinology 158: 1964–1976 [DOI] [PMC free article] [PubMed] [Google Scholar]
- 23. Lee M‐J, Fried SK (2014) The glucocorticoid receptor, not the mineralocorticoid receptor, plays the dominant role in adipogenesis and adipokine production in human adipocytes. Int J Obes 38: 1228–1233 [DOI] [PMC free article] [PubMed] [Google Scholar]
- 24. de Guia RM, Rose AJ, Sommerfeld A, Seibert O, Strzoda D, Zota A, Feuchter Y, Krones‐herzig A, Sijmonsma T, Kirilov M et al (2014) microRNA‐379 couples glucocorticoid hormones to dysfunctional lipid homeostasis. EMBO J 34: 344–360 [DOI] [PMC free article] [PubMed] [Google Scholar]
- 25. Rose AJ, Herzig S (2013) Metabolic control through glucocorticoid hormones: an update. Mol Cell Endocrinol 380: 65–78 [DOI] [PubMed] [Google Scholar]
- 26. Peckett AJ, Wright DC, Riddell MC (2011) The effects of glucocorticoids on adipose tissue lipid metabolism. Metabolism 60: 1500–1510 [DOI] [PubMed] [Google Scholar]
- 27. Frayn KN (2003) Metabolic regulation: a human perspective. Oxford: Blackwell Science; [Google Scholar]
- 28. Sumiyoshi M, Sakanaka M, Kimura Y (2006) Chronic intake of high‐fat and high‐sucrose diets differentially affects glucose intolerance in mice. J Nutr 136: 582–587 [DOI] [PubMed] [Google Scholar]
- 29. Thresher JS, Podolin DA, Wei Y, Mazzeo RS, Pagliassotti MJ (2000) Comparison of the effects of sucrose and fructose on insulin action and glucose tolerance. Am J Physiol Integr Comp Physiol 279: R1334–R1340 [DOI] [PubMed] [Google Scholar]
- 30. Lv YF, Yu J, Sheng YL, Huang M, Kong XC, Di WJ, Liu J, Zhou H, Liang H, Ding GX (2018) Glucocorticoids suppress the browning of adipose tissue via miR‐19b in male mice. Endocrinology 159: 310–322 [DOI] [PubMed] [Google Scholar]
- 31. Scotney H, Symonds ME, Law J, Budge H, Sharkey D, Manolopoulos KN (2017) Glucocorticoids modulate human brown adipose tissue thermogenesis in vivo . Metabolism 70: 125–132 [DOI] [PMC free article] [PubMed] [Google Scholar]
- 32. Thuzar M, Phillip Law W, Ratnasingam J, Jang C, Dimeski G, Ho KK (2017) Glucocorticoids suppress brown adipose tissue function in humans: a double‐blind placebo‐controlled study. Diabetes Obes Metab 20: 840–848 [DOI] [PubMed] [Google Scholar]
- 33. Bose SK, Hutson I, Harris CA (2016) Hepatic glucocorticoid receptor plays a greater role than adipose GR in metabolic syndrome despite renal compensation. Endocrinology 157: 4943–4960 [DOI] [PMC free article] [PubMed] [Google Scholar]
- 34. Feldmann HM, Golozoubova V, Cannon B, Nedergaard J (2009) UCP1 ablation induces obesity and abolishes diet‐induced thermogenesis in mice exempt from thermal stress by living at thermoneutrality. Cell Metab 9: 203–209 [DOI] [PubMed] [Google Scholar]
- 35. Luijten IHN, Brooks K, Boulet N, Shabalina IG, Jaiprakash A, Carlsson B , Fischer AW, Cannon B, Nedergaard J (2019) Glucocorticoid‐induced obesity develops independently of UCP1. Cell Rep 27: 1686–1698.e5 [DOI] [PubMed] [Google Scholar]
- 36. Rosenwald M, Perdikari A, Rülicke T, Wolfrum C (2013) Bi‐directional interconversion of brite and white adipocytes. Nat Cell Biol 15: 659–667 [DOI] [PubMed] [Google Scholar]
- 37. Lasar D, Rosenwald M, Kiehlmann E, Balaz M, Tall B, Opitz L, Lidell ME, Zamboni N, Krznar P, Sun W et al (2018) Peroxisome proliferator activated receptor gamma controls mature brown adipocyte inducibility through glycerol kinase. Cell Rep 22: 760–773 [DOI] [PubMed] [Google Scholar]
- 38. Maida A, Zota A, Sjøberg KA, Schumacher J, Sijmonsma TP, Pfenninger A, Christensen MM, Gantert T, Fuhrmeister J, Rothermel U et al (2016) A liver stress‐endocrine nexus promotes metabolic integrity during dietary protein dilution. J Clin Invest 126: 3263–3278 [DOI] [PMC free article] [PubMed] [Google Scholar]
- 39. Tschöp MH, Speakman JR, Arch JRS, Auwerx J, Brüning JC, Chan L, Eckel RH, Farese RV, Galgani JE, Hambly C et al (2012) A guide to analysis of mouse energy metabolism. Nat Methods 9: 57–63 [DOI] [PMC free article] [PubMed] [Google Scholar]
- 40. Lichtenstein L, Mattijssen F, de Wit NJ, Georgiadi A, Hooiveld GJ, van der Meer R, He Y, Qi L, Köster A, Tamsma JT et al (2010) Angptl4 protects against severe proinflammatory effects of saturated fat by inhibiting fatty acid uptake into mesenteric lymph node macrophages. Cell Metab 12: 580–592 [DOI] [PMC free article] [PubMed] [Google Scholar]
Associated Data
This section collects any data citations, data availability statements, or supplementary materials included in this article.
Supplementary Materials
Appendix
Expanded View Figures PDF
Review Process File
Data Availability Statement
The dataset produced in this study is available in the following database: Microarray gene expression data: Gene Expression Omnibus (GSE13554) (https://www.ncbi.nlm.nih.gov/geo/query/acc.cgi?acc=GSE135544).


