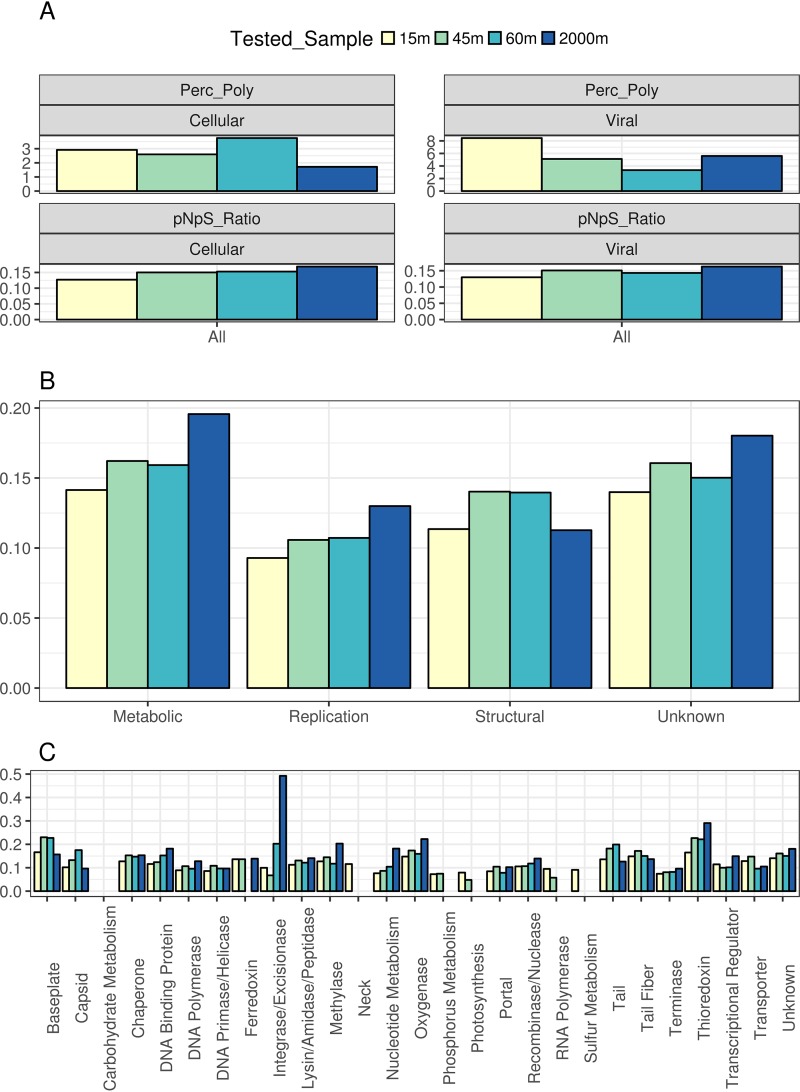
FIG 4.
Polymorphic sites and pN/pS values of viral genes differ among depths and functional categories. (A) Bar plots depict the median percentage of polymorphic sites (Perc_Poly) and the median pN/pS values of all the ORFs derived from viral scaffolds in the cellular and viral fractions, regardless of gene function. (B and C) Median pN/pS values of ORFs derived from viral scaffolds grouped by sampling site and broad functional category (B) and grouped by sampling site and specific functional category (C) for the viral fraction only. Only proteins derived from the set of bona fide viral sequences were included in these analyses. When we calculated medians, only proteins that displayed pN and pS values above 0 were included. Also, only proteins with a total number of polymorphic sites equal to or above 1 and a percentage of polymorphic sites equal to or above 1% were included so as to avoid estimating pN/pS values based on only a small fraction of protein lengths. Median values obtained from fewer than three proteins were omitted.

