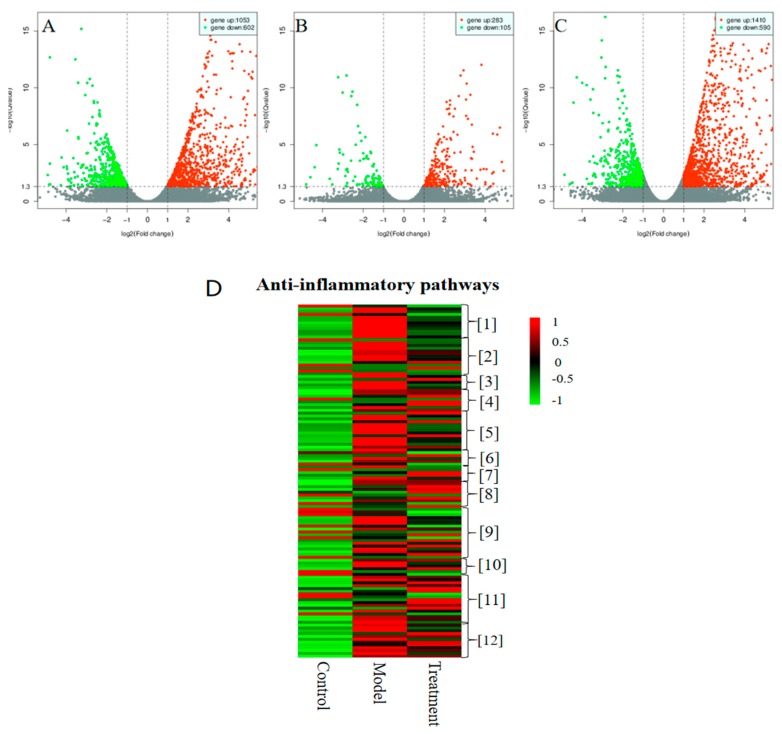
Figure 1.
Distinct transcriptome profile obtained upon treating RAW 264.7 macrophages with chlojaponilactone B (1), as determined by RNA-seq. Horizontal coordinates represent variations in mRNA expression levels, and longitudinal coordinates represent significant changes in mRNA expression levels. Red and green dots in the Volcano plot indicate mRNAs with increased and decreased expression levels, respectively. Red and green squares in the Heat map indicate mRNAs with increased and decreased expression levels, respectively (see color scale). RAW 264.7 macrophages treated with LPS (1 μg/mL) for 24 h served as the model group and those treated with 1 (3.5 μM) and LPS (1 μg/mL) served for 24 h as the treatment group. Cells cultured with 0.05% DMSO for 24 h served as the control group. (A) Control group vs. model group. (B) Model group vs. treatment group. (C) Control group vs. treatment group. (D) Heat map analysis of anti-inflammatory pathway profiles for the three groups. Three independent experiments were performed for each group, followed by data analyses.

