ABSTRACT
BACKGROUND:
Ultrasonography provides a quick assessment of visceral organ dimensions without any risk of radiation. Since many diseases can affect the kidney size, having a reliable reference for kidney length in children is valuable for clinical assessment.
OBJECTIVE:
Establish normal growth curves for renal length in relation to sex, age, body weight, height, body mass index and body surface area of healthy children in Saudi Arabia.
DESIGN:
Retrospective review of ultrasonography images.
SETTING:
Tertiary referral hospital.
PATIENTS AND METHODS:
We included all normal ultrasonography exams of renal length from full-term neonates to children ≤14 years old performed between 2003 and 2018. Data was collected retrospectively from the electronic archive and patient records.
MAIN OUTCOME MEASURES:
Relationship between the longitudinal length of both kidneys and age, height, weight, body mass index and body surface area.
SAMPLE SIZE:
950 patients.
RESULTS:
The left kidneys were longer than the right kidneys (P<.001). Height had the most significant correlation with kidney length (R2=0.829, P<.001 for right kidney; R2=0.831,P<.001 for left kidney). There was a consistent difference in kidney length by sex. Both kidneys were longer in males than females (P=.031, right kidney:, P=.015, left kidney). In terms of renal growth by age, our data showed a statistically significant difference before and after 24 months of age. There was no significant difference between populations from Saudi Arabia, Hong Kong (P=.485) and Australia (P=.99), but the difference between Saudi and American children was significant (P<.001). However, we did not have the data from those studies for direct comparison. The correlation plots of renal length versus age for all four countries were similar.
CONCLUSION:
The tables and correlation plots generated from this study should be useful to radiology departments in assessing conditions in children ≤14 years of age that lead to changes in renal size.
LIMITATIONS:
Retrospective, and there were differences in ultrasonographic techniques for patient positioning and cursor placement that can affect the reproducibility of measurements of renal length.
CONFLICT OF INTEREST:
None.
INTRODUCTION
Ultrasonography is routinely used to evaluate visceral organs in children. Renal ultrasonography provides a rapid assessment of kidney dimensions without risk of radiation. Among several body growth parameters, kidney size is considered an important parameter used in the clinical evaluation of renal growth and abnormalities. The kidney length is influenced by the overall body parameters of an individual, including age, height, weight, body mass index (BMI) and body surface area (BSA).1–3 Many diseases can affect the kidney size, varying from infection to malignant disorders.4, 5 Therefore, having a reliable reference for kidney length in children is valuable for clinical assessment.
A few studies have been carried out on the normal dimensions of kidney size around the world,1–3, 6–11 but none have included Saudi Arabia. The assessment of kidney volume is time-consuming and impractical and kidney length correlates better with body parameters.10–12 Konus et al3 reported that height was better correlated with the longitudinal dimensions of the kidney than with the body surface area of pediatric subjects aged from 5 days to 16 days. Capaccioli et al6 found a good correlation between age and kidney length. In a study with a larger sample size, Safak et al11 examined 712 healthy school-age children and reported that weight best correlated with kidney length. Most of these studies reported no statistically significant difference in kidney length with respect to sex.3, 11 Populations differed and thus the growth curves varied between these studies.3, 6–7, 11, 13 Loftus et al9 found no statistically significant differences between Hong Kong Chinese with Western growth curves. Most studies showed a strong correlation between age and other body parameters (weight and height) with kidney length in children. This study aimed to establish the normal sonographic growth pattern of kidney length in relation to child age and body parameters in Saudi Arabia. To the best of our knowledge, there are no such data for Saudi Arabia. This data should assist in predicting changes in renal size and allow for early identification of abnormal ultrasound findings (e.g, chronic pyelonephritis, obstructive uropathy, and chronic glomerulonephritis)14 that require further investigation.
PATIENTS AND METHODS
This retrospective study was approved by the institutional review board of our hospital and informed consent was waived. We reviewed ultrasonographic exams of the kidney of children ranging from full-term neonates to age 14 years performed between July 2003 and May 2018 in King Faisal Specialist Hospital and Research Centre, Riyadh, Saudi Arabia. Only healthy subjects were included in the study. Age, weight and height were recorded on the day of the ultrasonography exam. Weight-for-age and height-for-age percentiles were between the 5th and the 95th percentiles based on the Growth Charts for Saudi Children and Adolescents, endorsed by the Health Services Council of Saudi Arabia. Patients who did not have normal growth curves were not included in the study. All kidneys were examined, and grayscale 2D ultrasonography images were stored in PACS (picture archiving and communication system). The length of the organs and height were recorded to the nearest (0.1 cm), and the weight to the nearest (0.1 kg). The following inclusion criteria for enrollment were used: Saudi nationality; healthy full-term newborn to 14 years old; no acute or chronic disease that could lead to any renal disease; no personal or family history of renal disease. Only patients who came for screening or routine abdominal ultrasound examination, who complained of abdominal pain or unrelated health problems, and had normal kidneys were included.
All the retrospective sonographic examinations were performed by experienced sonographers adhering to standard protocol during the ultrasonography examinations. These examinations were obtained in the sagittal and axial planes passing through the renal hilum with patients in the supine or slightly left or right lateral decubitus positions. A single sonographic measurement of maximum renal length was obtained (distance pole to pole) (Figure 1). These images were all re-reviewed by a pediatric consultant radiologist at the time of the study to make sure they met the inclusion criteria and the measurements were corrected to adjust for intense crying and movement.
Figure 1.
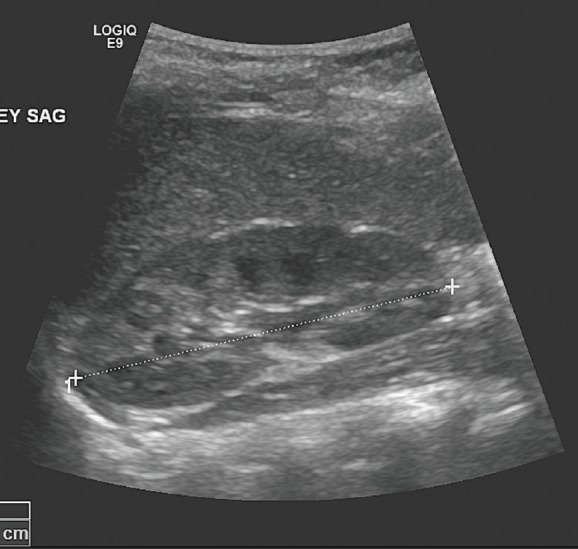
Maximum longitudinal length of the kidney passing through the renal hilum.
Statistical analysis was carried out using IBM SPSS Statistics version 20 (SPSS Inc., Chicago, IL, USA). Descriptive statistical methods were used when appropriate. Differences among groups were determined by paired samples t test. Relationships between ultrasonography measured renal length, age and body parameters were studied with simple and multiple linear regression. Correlation coefficients were derived by the Pearson coefficient of correlation. Results were considered statistically significant if the P value was <.05 for all data analyses. Normal ranges and related statistics were estimated and arranged according to age group and sex. Renal length growth curves and upper limits defined by the 95% upper confidence limit are presented in graphs by age (<2 years and ≥2 years).
RESULTS
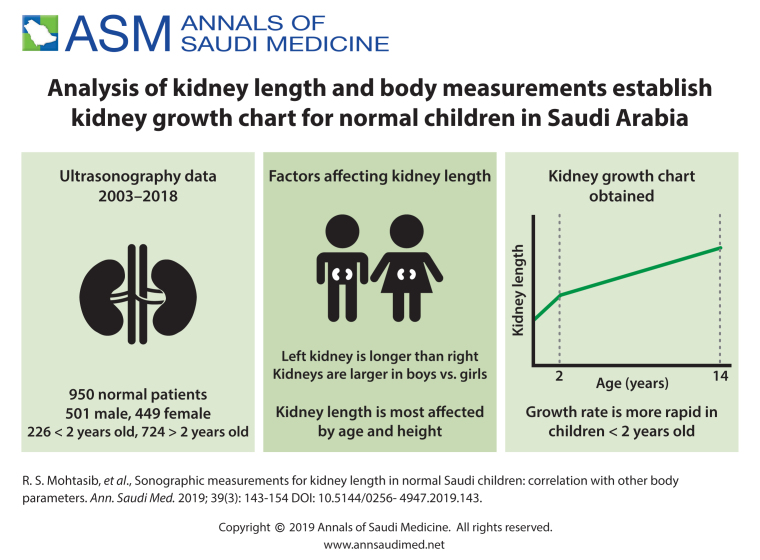
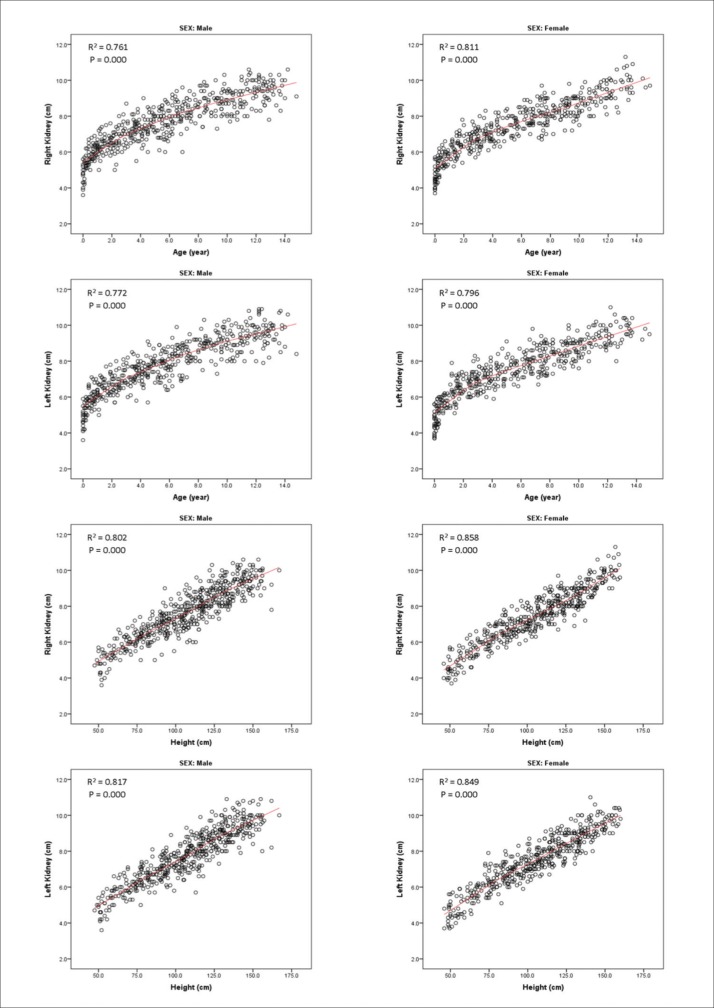
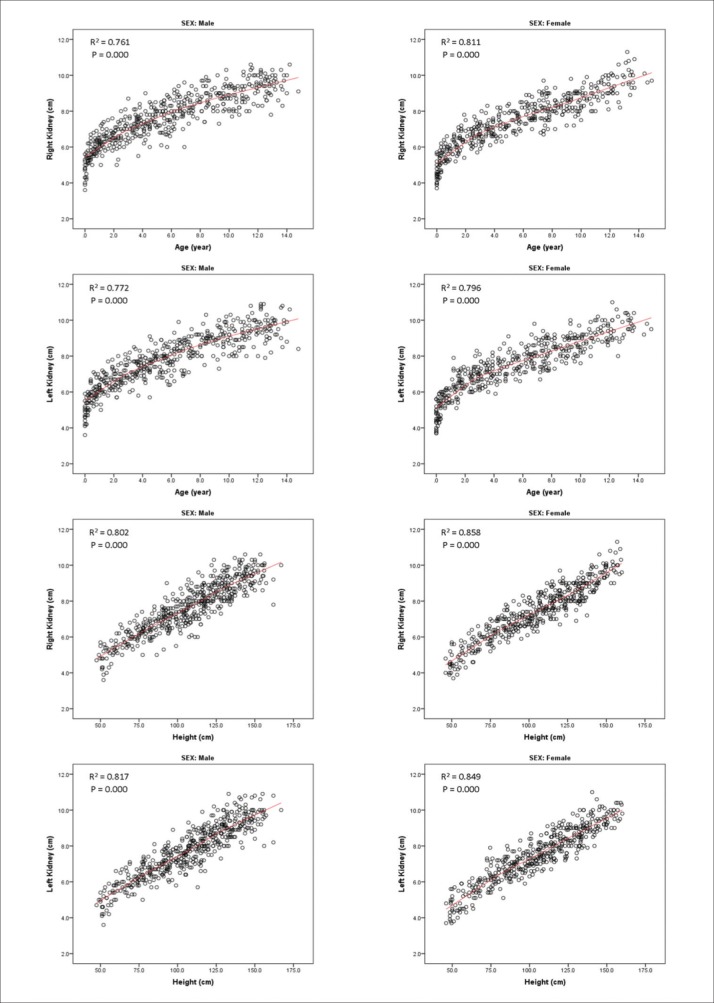
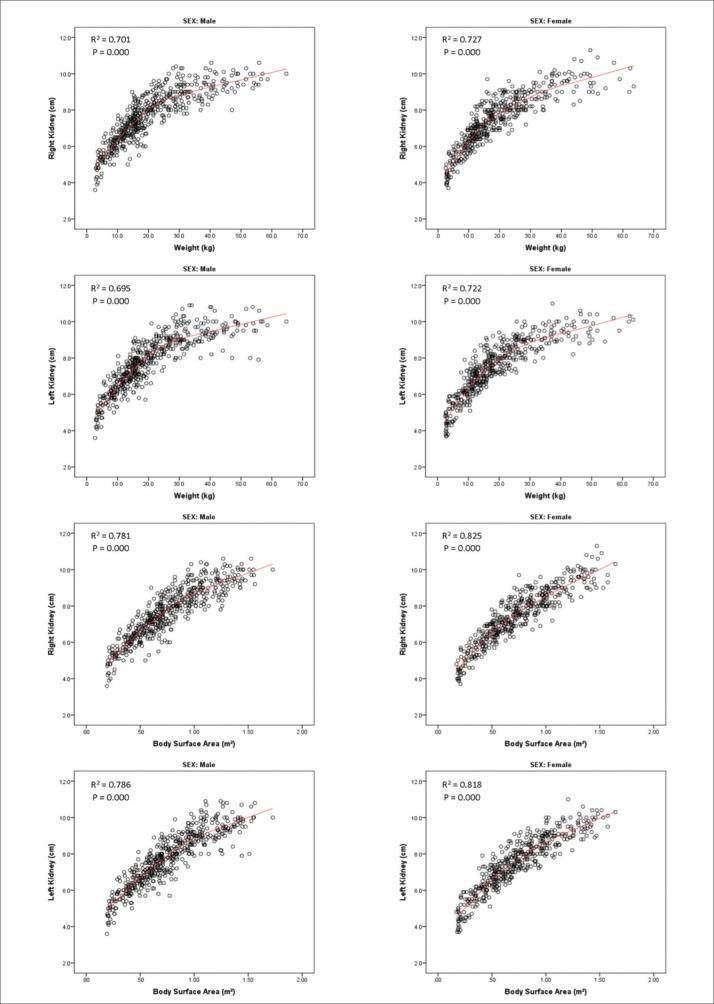
The 950 normal ultrasonography exams included 501 males (52.7%) and 449 females (47.3%). The age distribution ranged from full-term newborn to 14.8 years (Figure 2); 226 were less than 2 years old (23.8%) and 724 were more than 2 years old (76.2%). The left kidney was longer than the right kidney (P<.001). The mean (SD) length of the left kidney for all patients was 7.6 (1.5) cm and the right kidney was 7.5 (1.5) cm. The lengths of both the right and the left kidneys showed the strongest correlation with patient height in the univariate analysis (R2=0.829 and 0.831, respectively) (Table 1, Figure 3 see below). In the multivariate analysis, age, height, BMI and sex indicated significantly strong correlations with renal length, whereas weight and BSA showed weaker correlations (Table 2). There was a significant correlation in kidney length according to sex (Figure 4a, 4b). Both kidneys were longer in males (Table 3) (P=.03, right kidney; P=.015, left kidney). Kidney length increased rapidly during the first 24 months, while the growth rate slowed thereafter as shown in the renal length curve before and after 24 months of age (P=.011, younger than 2 years for the right kidney; P=.009, older than 2 years for the right kidney; P=.036, left kidney: .017. Kidney by age categories are shown in Tables 4 and 5 (see below). In Table 6 (see below), age groups younger than 2 years were matched with studies from other countries (Hong Kong Chinese, Australian and American).9, 10 There was no significant difference between Saudi, Hong Kong Chinese (P=.485) and Australian (P=.99) studies. However, a significant difference was found between Saudi and American studies (P=.001). In fact, we were unable to compare differences within each age group between the four countries or conduct any further analysis because of lack of the data from those studies. The plots of renal length versus age for all four countries showed remarkable agreement (Figure 5).
Figure 2.
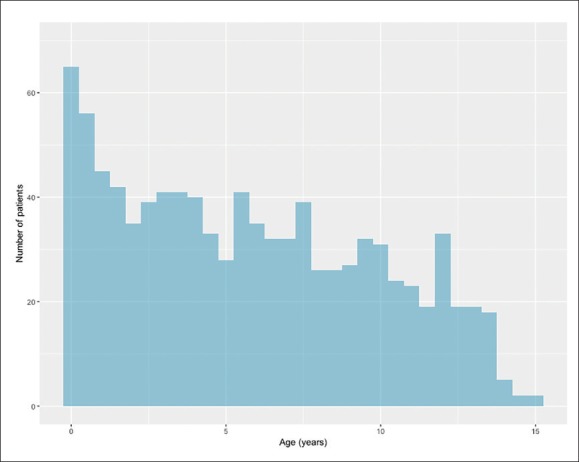
Age distribution of study population (n=950) (binwidth=6 months).
Table 1.
Univariate analysis of relationship between renal length and body parameters.
| Variable | Right renal length | Left renal length | ||||||||||
|---|---|---|---|---|---|---|---|---|---|---|---|---|
| All (n=950) | Male (n=501) | Female (n=449) | All (n=950) | Male (n=501) | Female (n=449) | |||||||
| β | R2 | β | R2 | β | R2 | β | R2 | β | R2 | β | R2 | |
| Age | 0.316 | 0.782 | 0.304 | 0.761 | 0.329 | 0.811 | 0.321 | 0.778 | 0.314 | 0.772 | 0.328 | 0.796 |
| Height | 0.047 | 0.829 | 0.046 | 0.802 | 0.047 | 0.858 | 0.048 | 0.831 | 0.047 | 0.817 | 0.047 | 0.849 |
| Weight | 0.101 | 0.714 | 0.098 | 0.701 | 0.105 | 0.727 | 0.103 | 0.708 | 0.100 | 0.695 | 0.105 | 0.722 |
| BMI | 0.213 | 0.165 | 0.217 | 0.171 | 0.205 | 0.153 | 0.213 | 0.159 | 0.209 | 0.151 | 0.213 | 0.161 |
| BSA | 3.968 | 0.802 | 3.865 | 0.781 | 4.066 | 0.825 | 4.033 | 0.800 | 3.971 | 0.786 | 4.079 | 0.818 |
All betas were significant (P<.001). BMI: body mass index, BSA: body surface area.
Figure 3.
Renal growth curve by age, height, weight, and body surface area.
Table 2.
Multivariate analysis of relationship between renal length and body parameters.
| Variable | Right renal length | Left renal length | ||||||||||
|---|---|---|---|---|---|---|---|---|---|---|---|---|
| All (n=950) | Male (n=501) | Female (n=449) | All (n=950) | Male (n=501) | Female (n=449) | |||||||
| β | P | β | P | β | P | β | P | β | P | β | P | |
| Age | 0.090 | <.001 | 0.097 | <.001 | 0.082 | .006 | 0.075 | <.001 | 0.083 | .007 | 0.062 | .041 |
| Height | 0.075 | <.001 | 0.081 | <.001 | 0.070 | <.001 | 0.066 | <.001 | 0.053 | .018 | 0.079 | <.001 |
| Weight | 0.021 | .552 | 0.024 | .667 | 0.019 | .677 | −0.010 | .779 | −0.055 | .329 | 0.028 | .548 |
| BMI | 0.119 | <.001 | 0.146 | <.001 | 0.098 | <.001 | 0.117 | <.001 | 0.123 | <.001 | 0.112 | <.001 |
| BSA | −4.695 | .062 | −5.590 | .161 | −3.979 | .210 | −2.615 | .304 | 0.064 | .987 | −4.865 | .136 |
| Sex | −0.102 | .007 | −0.143 | <.001 | ||||||||
| R2 | 0.843 | 0.820 | 0.867 | 0.845 | 0.829 | 0.862 | ||||||
BMI: body mass index, BSA: body surface area. Model summary for all patients for right kidney: R square=.843, adjusted R square=.842, Durbin-Watson test statistic=2.006; for male: R square=.820, adjusted R square=.818, Durbin-Watson test statistic=2.035; for female: R square=.820, adjusted R square=.866, Durbin-Watson test statistic=1.959. Model summary for all patients for left kidney: R square=.845, adjusted R square=.844, Durbin-Watson test statistic=1.961; for male: R square=.829, adjusted R square=.827, Durbin-Watson test statistic=1.952; for female: R square=.862, adjusted R square=.860, Durbin-Watson test statistic=1.969.
Figure 4a.
Male vs. female renal growth curve by age and height.
Figure 4b.
Male vs. female renal growth curve by weight and body surface area.
Table 3.
Median renal length in 950 male and female infants and children.
| Right kidney | P value | Left kidney | P value | |||
|---|---|---|---|---|---|---|
| Male | Female | Male | Female | |||
| All ages | 7.6 (1.4) | 7.4 (1.5) | .031 | 7.8 (1.5) | 7.5 (1.5) | .015 |
| ≤2 years | 5.9 (0.8) | 5.6 (0.9) | .011 | 5.9 (0.8) | 5.6 (0.9) | .009 |
| >2 years | 8.2 (1.1) | 8.0 (1.1) | .036 | 8.3 (1.1) | 8.1 (1.1) | .017 |
Data are mean (standard deviation). Units are centimeters.
Table 4.
Longitudinal lengths of both kidneys in children aged 24 months or less.
| Age (months) | n | Site | Mean (SD) | Minimum | Maximum | Percentiles | |
|---|---|---|---|---|---|---|---|
| 5th | 95th | ||||||
| <1 | 37 | Right | 4.56 (0.55) | 3.6 | 5.7 | 3.9 | 5.6 |
| Left | 4.60 (0.61) | 3.6 | 5.9 | 3.7 | 5.6 | ||
| 1–3 | 27 | Right | 5.09 (0.46) | 4.2 | 5.8 | 4.3 | 5.8 |
| Left | 5.11 (0.52) | 4.3 | 5.9 | 4.3 | 5.9 | ||
| 3–5 | 21 | Right | 5.50 (0.55) | 4.6 | 6.7 | 4.6 | 6.2 |
| Left | 5.51 (0.53) | 4.5 | 6.5 | 4.5 | 6.0 | ||
| 5–7 | 14 | Right | 5.76 (0.45) | 5.0 | 6.5 | 5.1 | 6.4 |
| Left | 5.93 (0.43) | 5.4 | 6.7 | 5.4 | 6.6 | ||
| 7–9 | 20 | Right | 5.89 (0.46) | 5.1 | 6.8 | 5.3 | 6.6 |
| Left | 5.94 (0.53) | 5.1 | 7.1 | 5.2 | 7.0 | ||
| 9–11 | 15 | Right | 5.87 (0.50) | 5.2 | 6.9 | 5.2 | 6.6 |
| Left | 5.90 (0.50) | 5.3 | 7.0 | 5.4 | 6.9 | ||
| 11–15 | 30 | Right | 6.17 (0.47) | 5.0 | 7.3 | 5.6 | 7.0 |
| Left | 6.23 (0.58) | 5.0 | 7.9 | 5.4 | 7.1 | ||
| 15–18 | 20 | Right | 6.25 (0.51) | 5.2 | 7.4 | 5.5 | 7.0 |
| Left | 6.42 (0.60) | 5.1 | 7.2 | 5.6 | 7.2 | ||
| 18–24 | 42 | Right | 6.56 (0.54) | 5.4 | 7.8 | 5.7 | 7.5 |
| Left | 6.65 (0.55) | 5.4 | 7.8 | 5.8 | 7.4 | ||
Units are centimeters.
Table 5.
Longitudinal lengths of both kidneys in children aged between 2 and 14 years.
| Age (years) | n | Site | Mean (SD) | Minimum | Maximum | Percentiles | |
|---|---|---|---|---|---|---|---|
| 5th | 95th | ||||||
| 2–3 | 76 | Right | 6.71 (0.56) | 5.0 | 8.1 | 5.9 | 7.6 |
| Left | 6.83 (0.55) | 5.7 | 8.3 | 6.0 | 7.9 | ||
| 3–4 | 84 | Right | 7.11 (0.58) | 5.5 | 8.7 | 6.3 | 8.1 |
| Left | 7.19 (0.60) | 5.8 | 8.5 | 6.1 | 8.2 | ||
| 4–5 | 67 | Right | 7.35 (0.62) | 6.0 | 9.0 | 6.3 | 8.4 |
| Left | 7.43 (0.65) | 5.7 | 9.1 | 6.5 | 8.6 | ||
| 5–6 | 68 | Right | 7.62 (0.66) | 6.0 | 8.9 | 6.7 | 8.6 |
| Left | 7.70 (0.64) | 6.4 | 9.1 | 6.6 | 8.8 | ||
| 6–7 | 70 | Right | 8.03 (0.64) | 6.0 | 9.6 | 7.0 | 9.1 |
| Left | 8.11 (0.69) | 6.6 | 9.9 | 7.0 | 9.1 | ||
| 7–8 | 63 | Right | 8.24 (0.70) | 6.7 | 9.7 | 6.9 | 9.2 |
| Left | 8.25 (0.69) | 6.7 | 9.5 | 7.2 | 9.2 | ||
| 8–9 | 50 | Right | 8.52 (0.65) | 7.0 | 9.9 | 7.6 | 9.7 |
| Left | 8.69 (0.57) | 7.3 | 10.3 | 7.8 | 9.4 | ||
| 9–10 | 63 | Right | 8.66 (0.62) | 7.2 | 10.3 | 7.7 | 9.8 |
| Left | 8.86 (0.67) | 7.3 | 10.2 | 7.8 | 9.9 | ||
| 10–11 | 51 | Right | 8.73 (0.57) | 7.5 | 9.9 | 7.9 | 9.5 |
| Left | 8.91 (0.61) | 7.6 | 10.3 | 8.0 | 10.0 | ||
| 11–12 | 49 | Right | 9.30 (0.65) | 8.0 | 10.6 | 8.0 | 10.3 |
| Left | 9.46 (0.56) | 8.0 | 10.8 | 8.5 | 10.2 | ||
| 12–13 | 46 | Right | 9.39 (0.62) | 7.8 | 10.6 | 8.3 | 10.2 |
| Left | 9.54 (0.77) | 7.9 | 11.0 | 8.1 | 10.9 | ||
| 13–14 | 37 | Right | 9.78 (0.64) | 8.3 | 11.3 | 8.8 | 10.8 |
| Left | 9.74 (0.56) | 8.4 | 10.8 | 8.7 | 10.6 | ||
Units are centimeters.
Table 6.
Renal length vs. age in Saudi Arabian, Hong Kong Chinese, Australian and American children.
| Saudi Arabia | Hong Konga | Australia | Americanb | |||||
|---|---|---|---|---|---|---|---|---|
| No. of children | Mean renal length (cm) | No. of children | Mean renal length (cm) | No. of children | Mean renal length (cm) | No. of children | Mean renal length (cm) | |
| 0–4 months | 77 | 4.9 | 21 | 5.0 | 27 | 5.1 | 32 | 5.2 |
| 4–8 months | 31 | 5.8 | 22 | 5.7 | 24 | 5.5 | 10 | 6.2 |
| 8–12 months | 35 | 6.0 | 11 | 6.3 | 17 | 5.7 | 4 | 6.2 |
| 1–2 years | 83 | 6.4 | 16 | 6.3 | 57 | 6.2 | 14 | 6.7 |
| 2–3 years | 76 | 6.8 | 10 | 6.7 | 62 | 6.8 | 6 | 7.4 |
| 3–4 years | 84 | 7.2 | 14 | 7.2 | 57 | 7.2 | 15 | 7.4 |
| 4–5 years | 67 | 7.4 | 9 | 7.4 | 67 | 7.4 | 13 | 7.9 |
| 5–6 years | 68 | 7.7 | 13 | 8.0 | 55 | 7.8 | 15 | 8.1 |
| 6–7 years | 70 | 8.1 | 8 | 7.7 | 34 | 8.0 | 7 | 7.8 |
| 7–8 years | 63 | 8.2 | 16 | 8.0 | 30 | 8.3 | 9 | 8.3 |
| 8–9 years | 50 | 8.6 | 11 | 8.4 | 31 | 8.6 | 9 | 8.9 |
| 9–10 years | 63 | 8.8 | 17 | 8.8 | 24 | 8.7 | 7 | 9.2 |
| 10–11 years | 51 | 8.8 | 10 | 9.1 | 24 | 9.0 | 14 | 9.2 |
| 11–12 years | 49 | 9.4 | 10 | 9.4 | 22 | 9.5 | 11 | 9.6 |
| 12–13 years | 46 | 9.5 | 7 | 9.2 | 19 | 9.5 | 9 | 10.4 |
| 13–14 years | 37 | 9.8 | 19 | 9.6 | 4 | 10.1 | 7 | 9.8 |
| Total | 950 | 214 | 554 | 182 | ||||
The Hong Kong study involved 250 children (214 ≤14 years).
The American study involved 203 children (182≤14 years). Ages older than 14 years were excluded in this comparison.
Figure 5.
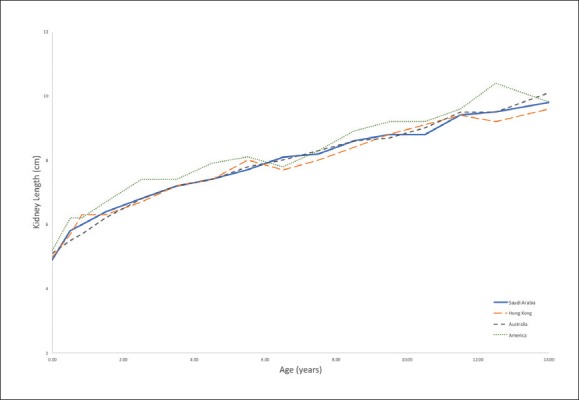
Mean renal lengths by age in children from Saudi Arabia, Hong Kong, Australia and the United States.
DISCUSSION
Knowing the normal limits of kidney size for healthy children is useful for differentiating renal conditions. This is of particular importance in childhood, when renal length changes with age, and when renal tract abnormalities exist, such as reflux nephropathy, renal hypoplasia obstructive uropathy, and renal agenesis. Many studies have reported relationships between ultrasonographically measured renal sizes and other body parameters (height, weight, BMI and BSA).3, 6, 7, 11, 13 Body height and weight may vary with ethnicity.10, 12 To the best of our knowledge this study is the only study from Saudi Arabia that has evaluated the relationship between renal size and the overall body size of the individual, including age, height, weight, BMI and BSA.
Some studies have demonstrated no significant differences between the left and right kidney sizes.1, 2, 9, 10, 15, 16 However, in our study the left kidney was significantly larger than the right kidney, which is similar to what was reported in other studies.1, 8, 17–20 The reason is that the spleen is smaller than the liver, so the left kidney has more space to grow.21 Also, the left renal artery is shorter than the right one, so increased blood flow in the left renal artery may result in a relatively increased size of the left kidney.22
In terms of renal growth according to age, our data showed a statistically significant difference before and after 24 months of age. Consistent with other studies, the renal length increased rapidly until 24 months, while the growth rate was reduced thereafter.18, 23 Numerous studies have shown that height correlates best with renal length.1, 8, 23, 24 Our study supports these reported results in that the renal lengths show the strongest correlation with height. In fact, a previous study concluded that the reason for this important relationship is that the rapid growth in height during the first 2 years of life is intimately associated with a similar increase in kidney length.1
There are some disagreements regarding the correlation between sex and kidney size in children. Some studies suggested that females have smaller kidneys,20, 25 while other studies have indicated no differences in renal size between the sexes.3, 11, 12 We found a noticeable difference in kidney length by sex. Both kidneys were longer in males than females. These differences seen in males are solely dependent on a greater BSA.26
Although there were statistically significant differences in renal length between the sexes as well as between the right and left kidneys, these differences were not considered clinically significant. Therefore, we presented renal length graphs based on the age group regardless of sex. This difference was considered to be small and not of any clinical significance, the difference may be related to the change in the degree of respiration affecting the accuracy of the obtained measurement, or possibly to changes in the position of the patient during the examination, which is thought to influence the filling of the renal collecting system and consequently, altering the size of the kidney.27
The graph of ultrasonographically measured normal renal lengths from the Women's and Children's Hospital, Adelaide (Figure 6), has been widely used as a standard reference around the world as well as in our hospital, although these data have not previously been published as reported by Loftus et al. We highly advise that our renal length graph may be the best available for clinical use in our region. Our database of 950 cases is considerably greater than their database of 554 cases, and the smoothed plot of mean length with 2 standard deviations of the mean is an ideal for reference in everyday scanning situations for children from 0 day to 24 months (Figure 7) and children from 2 years to 14 years (Figure 8).
Figure 6.
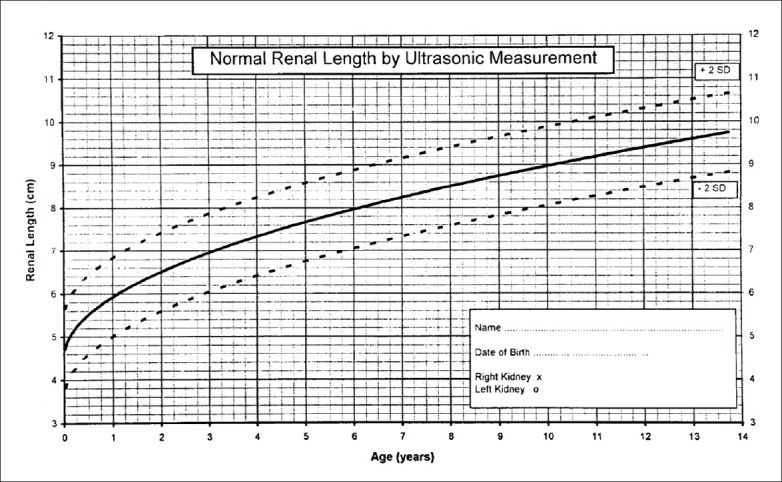
Mean renal length and 2 standard deviations of the mean by age in 554 children at the Women's and Children's Hospital, Adelaide, Australia (unpublished).
Figure 7.
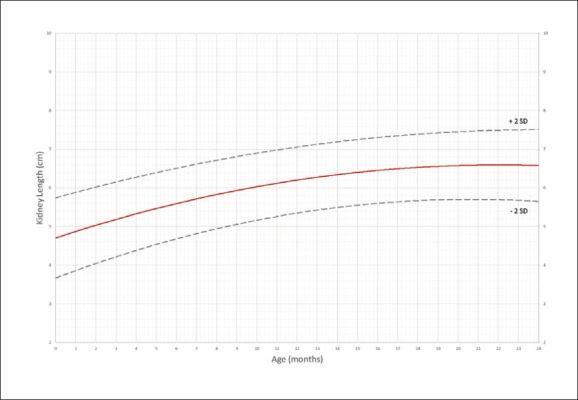
Mean renal length and 2 standard deviations of the mean by age for children under 24 months old in the present study (n=226).
Figure 8.
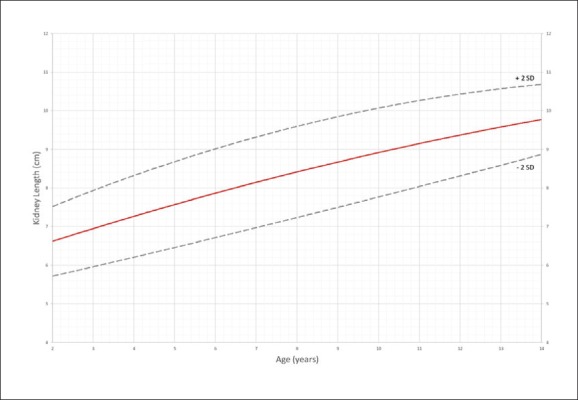
Mean renal length and 2 standard deviations of the mean by age for children 2 years to 14 years old in the present study (n=724).
There are limitations to our study. The study was retrospective, but renal length measurements were routinely performed by experienced sonographers following standard protocol during the ultrasonography examinations, and were rechecked by pediatric radiologists. Also, differences in ultrasonographic techniques, patient positioning, and cursor placement can affect the reproducibility of measurements on renal length. Therefore, future prospective studies evaluating intra- and interobserver agreements are necessary. Although the sample was not randomly chosen from different parts of the country, the hospital is the largest referral hospital in Saudi Arabia and thus the results may be generalizable.
In conclusion, scatter plots between age and renal lengths were established among Saudi children. There were size differences between the right and left kidneys and also between sexes; therefore, both should be measured separately. We have graphed and tabulated the correlation of age with kidney length in this report, and believe that these tables and graphs can be used in radiology departments to assess conditions that lead to changes in renal size.
Funding Statement
None.
REFERENCES
- 1.Dinkel E, Ertel M, Dittrich M, Peters H, Berres M, Schulte-Wissermann H.. Kidney size in childhood. Sonographical growth charts for kidney length and volume. Pediatr Radiol. 1985;15(1):38–43. [DOI] [PubMed] [Google Scholar]
- 2.Han BK, Babcock DS.. Sonographic measurements and appearance of normal kidneys in children. AJR Am J Roentgenol. 1985;145(3):611–6. [DOI] [PubMed] [Google Scholar]
- 3.Konus OL, Ozdemir A, Akkaya A, Erbas G, Celik H, Isik S.. Normal liver, spleen, and kidney dimensions in neonates, infants, and children: evaluation with sonography. AJR Am J Roentgenol. 1998;171(6):1693–8. [DOI] [PubMed] [Google Scholar]
- 4.Zhang B, Lewis SM.. A study of the reliability of clinical palpation of the spleen. Clin Lab Haematol. 1989;11(1):7–10. [DOI] [PubMed] [Google Scholar]
- 5.Joshi R, Singh A, Jajoo N, Pai M, Kalantri SP.. Accuracy and reliability of palpation and percussion for detecting hepatomegaly: a rural hospital-based study. Indian J Gastroenterol. 2004;23(5):171–4. [PubMed] [Google Scholar]
- 6.Capaccioli L, Stecco A, Vanzi E, Brizzi E.. Ultrasonographic study on the growth and dimensions of healthy children and adults organs. Ital J Anat Embryol. 2000;105(1):1–50. [PubMed] [Google Scholar]
- 7.Haddad-Zebouni S, Hindy R, Slaba S, Aoun N, Mourani C, Abi Ghanem S, et al.. Ultrasonographic evaluation of the kidney, liver and spleen size in children. Arch Pediatr. 1999;6(12):1266–70. [DOI] [PubMed] [Google Scholar]
- 8.Kim J-H, Kim M-J, Lim SH, Kim J, Lee M-J.. Length and Volume of Morphologically Normal Kidneys in Korean Children: Ultrasound Measurement and Estimation Using Body Size. Korean J Radiol. 2013;14(4):677–82. [DOI] [PMC free article] [PubMed] [Google Scholar]
- 9.Loftus WK, Gent RJ, LeQuesne GW, Metreweli C.. Renal length in Chinese children: sonographic measurement and comparison with western data. J Clin Ultrasound. 1998;26(7):349–52. [DOI] [PubMed] [Google Scholar]
- 10.Rosenbaum DM, Korngold E, Teele RL.. Sonographic assessment of renal length in normal children. AJR Am J Roentgenol. 1984;142(3):467–9. Epub 1984/03/01. [DOI] [PubMed] [Google Scholar]
- 11.Safak AA, Simsek E, Bahcebasi T.. Sonographic assessment of the normal limits and percentile curves of liver, spleen, and kidney dimensions in healthy school-aged children. J Ultrasound Med. 2005;24(10):1359–64. [DOI] [PubMed] [Google Scholar]
- 12.Gavela T, Sánchez M, Gómez G, Gallego S, Martínez J, Moya M.. Ultrasonographic study of kidney size in children. Nefrología J. 2006;26(3):325–9. [PubMed] [Google Scholar]
- 13.Dhingra B, Sharma S, Mishra D, Kumari R, Pandey RM, Aggarwal S.. Normal values of liver and spleen size by ultrasonography in Indian children. Indian Pediatr. 2010;47(6):487–92. [DOI] [PubMed] [Google Scholar]
- 14.Wong IY, Copp HL, Clark CJ, Wu HY, Shortliffe LD.. Quantitative ultrasound renal parenchymal area correlates with renal volume and identifies reflux nephropathy. J Urol. 2009;182(4 Suppl):1683–7. Epub 2009/08/21. doi: 10.1016/j.juro.2009.03.075. PubMed PMID: . [DOI] [PubMed] [Google Scholar]
- 15.Fitzsimons RB. KIDNEY LENGTH IN THE NEWBORN MEASURED BY ULTRASOUND. Acta Paediatrica. 1983;72(6):885–7. [DOI] [PubMed] [Google Scholar]
- 16.Holloway H, Jones TB, Robinson AE, Harpen MD, Wiseman HJ.. Sonographic determination of renal volumes in normal neonates. Pediatr Radiol. 1983;13(4):212–4. Epub 1983/01/01. [DOI] [PubMed] [Google Scholar]
- 17.Blane CE, Bookstein FL, DiPietro MA, Kelsch RC.. Sonographic standards for normal infant kidney length. AJR Am J Roentgenol. 1985;145(6):1289–91. Epub 1985/12/01. [DOI] [PubMed] [Google Scholar]
- 18.Haugstvedt S, Lundberg J.. Kidney size in normal children measured by sonography. Scand J Urol Nephrol. 1980;14(3):251–5. Epub 1980/01/01. [DOI] [PubMed] [Google Scholar]
- 19.Sargent MA, Gupta SC.. Sonographic measurement of relative renal volume in children: comparison with scintigraphic determination of relative renal function. AJR Am J Roentgenol. 1993;161(1):157–60. Epub 1993/07/01. doi: 10.2214/ajr.161.1.8390789. PubMed PMID: . [DOI] [PubMed] [Google Scholar]
- 20.Scott JE, Hunter EW, Lee RE, Matthews JN.. Ultrasound measurement of renal size in newborn infants. Arch Dis Child. 1990;65(4 Spec No):361–4. PubMed PMID: PMC1590153. [DOI] [PMC free article] [PubMed] [Google Scholar]
- 21.Fernandes MM, Lemos CC, Lopes GS, Madeira EP, Santos OR, Dorigo D, et al.. Normal renal dimensions in a specific population. Int Braz J Urol. 2002;28(6):510–5. Epub 2005/03/08. PubMed PMID: . [PubMed] [Google Scholar]
- 22.Musa MJ, Abukonna A.. Sonographic measurement of renal size in normal high altitude populations. Journal of Radiation Research and Applied Sciences. 2017;10(3):178–82. doi: 10.1016/j.jrras.2017.04.004. [DOI] [Google Scholar]
- 23.Kim I, Cheon J, Lee Y, Lee S, Kim O, Kim J, et al.. Kidney length in normal Korean children. J Korean Soc Ultrasound Med. 2010;29:181–8. [Google Scholar]
- 24.Zerin JM, Blane CE.. Sonographic assessment of renal length in children: A reappraisal. Pediatr Radiol. 1994;24(2):101–6. [DOI] [PubMed] [Google Scholar]
- 25.Schmidt IM, Molgaard C, Main KM, Michaelsen KF.. Effect of gender and lean body mass on kidney size in healthy 10-year-old children. Pediatr Nephrol. 2001;16(4):366–70. Epub 2001/05/17. PubMed PMID: . [DOI] [PubMed] [Google Scholar]
- 26.Neugarten J, Kasiske B, Silbiger SR, Nyengaard JR.. Effects of sex on renal structure. Nephron. 2002;90(2):139–44. Epub 2002/01/31. doi: 10.1159/000049033. PubMed PMID: . [DOI] [PubMed] [Google Scholar]
- 27.Michel SC, Forster I, Seifert B, Willi UV, Huisman TA.. Renal dimensions measured by ultrasonography in children: variations as a function of the imaging plane and patient position. Eur Radiol. 2004;14(8):1508–12. Epub 2004/04/29. doi: 10.1007/s00330-004-2332-2. PubMed PMID: . [DOI] [PubMed] [Google Scholar]


