

Abstract
Background
Patients with hepatitis B e-antigen (HBeAg)-negative chronic hepatitis B (CHB) and low-level viremia are a heterogeneous group. Identifying those at risk of developing active CHB requiring antiviral therapy is important. In this study, we prospectively characterize incidence rates and predictors of transitioning from inactive to active CHB in a North American adult cohort.
Methods
Participants in the multi-center NIDDK Hepatitis B Research Network (HBRN) cohort who were HBeAg-negative with baseline HBV DNA≤10,000 IU/mL were included. Cox regression models were used to estimate the proportion of individuals in three baseline HBV DNA categories (≤100, 101-≤2000, and 2001-≤10,000 IU/mL) who developed phase transition defined by HBV DNA>10,000 IU/mL and ALT>2x ULN or initiated treatment during follow-up.
Results
Of 970 participants meeting inclusion criteria, 15% experienced phase transition or initiated treatment over a median follow-up of 4 years; 9% of those with baseline HBV DNA ≤100 IU/mL, 14% with HBV DNA 101-≤2000 IU/mL, and 24% with HBV DNA 2001-≤10,000 IU/mL (p<0.001). The overall rate of phase transition or treatment initiation was 7.6 per 100 person-years; 4.6 in those with HBV DNA ≤100 IU/mL, 6.8 in 101-≤2000 IU/mL, and 12.2 in 2001-≤10,000 IU/mL (p<0.001). Factors independently associated with higher rate of phase transition or treatment initiation included HBV genotype B or C, higher baseline ALT and HBV DNA levels, lower platelet count, quantitative hepatitis B surface antigen >1000 IU/mL and hyperlipidemia. Only higher ALT, higher HBV DNA and lower platelets were associated with phase transition when patients starting treatment were censored.
Conclusions
The majority of adults in this North American cohort with HBeAg-negative CHB and low-level viremia remained inactive and off treatment over 4 years. Transition from inactive to active CHB is infrequent and predominantly associated with viral rather than host factors.
Introduction
The dynamic nature of chronic hepatitis B (CHB) infection is well-recognized, with inactive and active phases, the latter associated with hepatic necroinflammation and progression of fibrosis if prolonged. Current treatment guidelines recommend antiviral therapy for persons at risk for liver disease progression, namely those in the active, necroinflammatory phases. In contrast, patients with inactive CHB are not recommended for treatment, unless a specific indication exists such as established advanced fibrosis, a family history of hepatocellular carcinoma (HCC), or extrahepatic manifestations1.
The American Association for the Study of Liver Diseases (AASLD) guidelines defines an inactive carrier (IC) as an individual who is hepatitis B e antigen (HBeAg)-negative with HBV DNA<2000 IU/mL and normal alanine aminotransferase (ALT) 1. Prior studies have demonstrated a generally favorable prognosis with a low likelihood of liver fibrosis progression and cirrhosis development in ICs2,3. The risk of HCC is also low, ranging between 0.02-0.2 per 100 person-years, with higher risk in East Asian compared to Western countries4. On histologic analysis, ICs have minimal, if any, necroinflammatory activity and variable but generally mild fibrosis consistent with a benign course5. Since full suppression of virus has not been shown to improve outcomes in patients with low-level viremia, treatment of ICs is not indicated in most cases1.
The HBV DNA cut-off for HBeAg-negative immune active disease is a level above 2000 IU/mL based on an increased incidence of HCC 6, but a large proportion (38-55%) of HBeAg-negative patients under care in the United States fall into an “indeterminant” category7,8, including those with HBV DNA<2000 IU/mL and ALT greater than 2 times upper limit of normal (>2x ULN) or HBV DNA>2000 IU/mL and ALT <2x ULN. Whether the natural history of indeterminant HBeAg-negative patients differ from those considered inactive based on current HBV DNA cut-offs is not well-characterized, yet crucial for decision-making on CHB treatment.
Existing population-based longitudinal studies on the natural history of HBeAg-negative ICs come from individual countries within Asia2,9–11 and Europe3,12–14. Key limitations of these studies include small numbers, homogenous populations, and inconsistent definitions for both cohort inclusion and outcomes, leading to wide variations in estimates. North American cohorts with greater heterogeneity may provide insight into additional factors, such as race and genotype, that impact natural history. Here, we examine the incidence and predictors of transitioning to active phenotype among a large prospective cohort of HBeAg-negative patients with inactive or indeterminant disease arising from a diverse North American population.
Methods
Study population
We performed a longitudinal analysis of adults enrolled in the Hepatitis B Research Network (HBRN) Adult Cohort Study from January 2011 to June 2017. The HBRN Adult Cohort Study is a cooperative network of 21 clinical sites within the United States and Toronto, Canada funded by the National Institute of Diabetes and Digestive and Kidney Diseases (NIDDK, NCT01263587). All enrolled participants were HBsAg-positive, older than 18 years of age and not on antiviral therapy at enrollment. Those with hepatic decompensation, liver cancer, solid organ or bone marrow transplantation and human immunodeficiency virus infection were excluded. Treatment after enrollment occurred through HBRN clinical trials or as per standard of care at individual sites. Follow-up visits and laboratory testing were completed at week 12 after enrollment (as a supplemental visit to baseline data collection) and then every 24 weeks thereafter, as previously reported15.
Inclusion criteria for the study cohort was all HBeAg-negative adults with low-level viremia (defined as a HBV DNA level ≤10,000 IU/mL at entry into study). This HBV DNA cut-off was chosen to include participants in the HBeAg-negative indeterminant group (HBV DNA 1000-10,000 IU/mL and ALT<ULN or HBV DNA<1000 IU/mL and ALT >ULN-<2xULN)7. Those with acute infection, lacking HBV DNA results within 6 months of entry, or initiating treatment within 6 months of entry were excluded (see Figure 1).
Figure 1. Selection of study cohort.
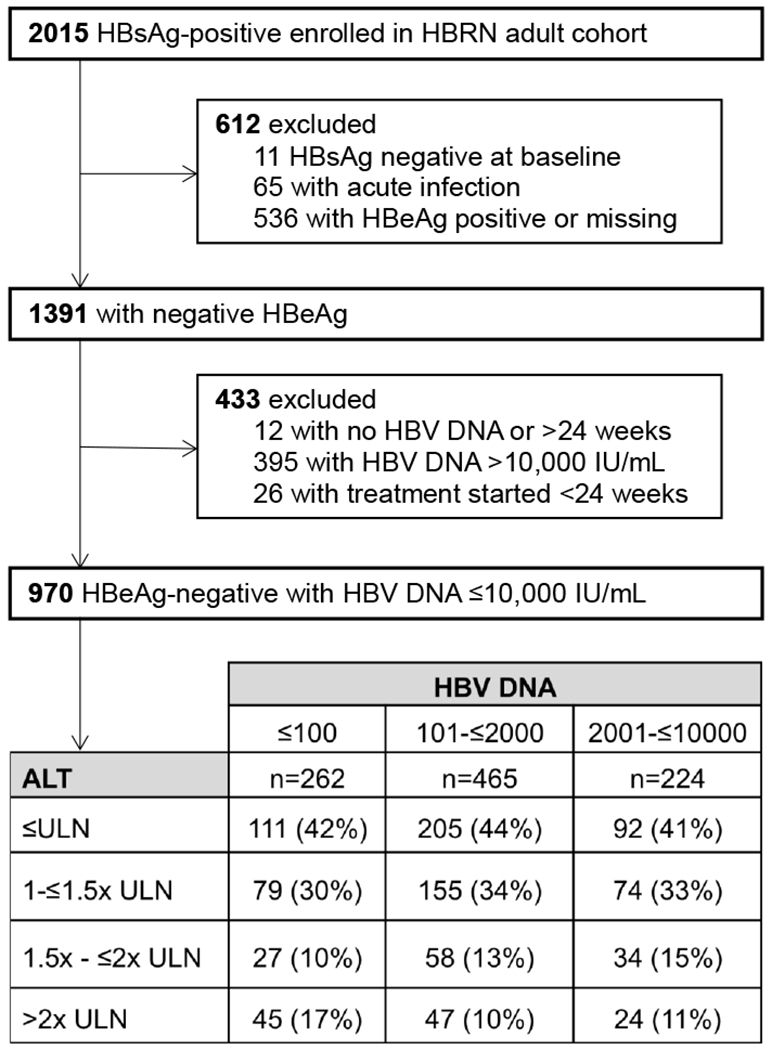
Abbreviations: HBsAg = hepatitis B surface antigen; HBRN = Hepatitis B Research Network; HBeAg = hepatitis B early antigen; HBV = hepatitis B virus; ALT = alanine aminotransferase; ULN = upper limit of normal
*19 participants are missing ALT at baseline and 12 weeks. For analysis requiring both ALT and HBV DNA at baseline, the sample size is reduced to 951. Upper limit of normal is defined as 30 U/L for males and 20 U/L for females.
The HBRN Steering Committee approved all study protocols. Institutional review board or ethics committee approval was obtained from all clinical sites and all participants provided written informed consent.
Study design
Primary outcome for this study was phase transition, defined as first instance of HBV DNA level >10,000 IU/mL and ALT >2x ULN, or treatment initiation starting more than 24 weeks after entry into study. ULN for ALT was defined as 30 U/L for males and 20 U/L for females in line with prior HBRN publications16. Treatment initiation was at the discretion of the treating physician and reasons for initiation were not recorded; we included treatment as an outcome due to inability to capture phase transition once treatment was initiated. We chose the term phase transition to more precisely describe a spontaneous transition from inactive to active phase and to distinguish from reactivation, which denotes the abrupt changes in HBV DNA and ALT levels typically described in the setting of chemotherapy or immunosuppression. Incidence of primary outcome was examined across HBV DNA level at entry: ≤100, 101-≤2000, and 2001-≤10,000 IU/mL.
We performed a secondary analysis limited to the inactive group based on the current guideline-based threshold for treatment initiation (HBV DNA ≤2000 IU/mL)1. We examined a similar outcome of time to phase transition, in this instance, transition to HBV DNA>2000 IU/mL and ALT>2x ULN or treatment initiation on follow-up. Outcome was compared between those with HBV DNA ≤100 and 101-≤2000 IU/mL. Sensitivity analyses were also performed with phase transition alone as outcome with “treatment initiation” censored, with higher ULN of ALT per AASLD guidelines (25 U/L for females and 35 U/L for males)1, and exclusion of participants reporting history of hyperlipidemia and/or diabetes.
Clinical and laboratory assessments
Serological testing for HBV DNA, quantitative HBsAg, HBeAg, and HBV genotype were performed in a central laboratory. The following assays were used: HBV DNA by Roche real-time polymerase chain reaction assay (COBAS Ampliprep/COBAS Taqman HBV Test, Branchburg, NJ) with a lower limit of quantitation of 20 IU/mL; quantitative HBsAg by Elecsys HBsAg II Quant (Roche Diagnostics) with a lower limit of 0.05 IU/mL; qualitative HBeAg by EIA (Diasorin, ETI-EBK PLUS) and quantitative HBeAg by Elecsys HBeAg Test (Roche Diagnostics) with a lower limit of 0.3 IU/mL; and HBV genotype by mass spectrometry17. When results from the central laboratory were not available, results from local laboratories at clinical sites were used for analysis.
Hyperlipidemia and diabetes were self-reported clinical diagnoses at entry into study. Fibrosis-4 index was calculated using the following equation: age [years] × AST [IU/L]/platelet count [expressed as platelets × 109/L] × (ALT½[IU/L])18. AST-to-platelet ratio index (APRI) was calculated as: (AST/upper limit of normal)/platelet count (expressed as platelets × 109/L) × 10019.
Statistical analysis
Descriptive statistics were used to summarize demographic, clinical and virologic characteristics of participants. Frequencies and percentages are reported for categorical data and medians with interquartile range for continuous data. Comparisons of these characteristics across categories of HBV DNA levels were made using Chi-square test or its exact version for categorical variables, and Kruskal-Wallis test for continuous variables.
Evolution of HBV DNA levels and ALT levels over the follow-up period was depicted using color-coded heat-maps. In the heat-maps, we carried forward the last non-missing HBV DNA and ALT levels for intermittent missing values. However, if no future data were available, observations were treated as censored. Percentage of participants in different HBV DNA and ALT categories were estimated using a longitudinal generalized linear model to account for missing data due to short follow-up and unavailability of such tests. The percentages in each HBV DNA and ALT category considered separately at each follow-up time point were obtained using the predictions from this model for each baseline HBV DNA category. Since the proportion of missing HBV DNA and ALT levels vary at each time point during follow-up, the estimated percent of participants in each HBV DNA and ALT category is presented as a range. In addition, maximum percentages of HBV DNA excursions >10,000 IU/mL and ALT >2x ULN are presented at the time point during follow-up in which they occurred.
Kaplan Meier method was used to estimate the cumulative proportion of phase transition over time stratified by baseline HBV DNA categories and compared using a log-rank test. We assessed the association between baseline characteristics and the phase transition using a Cox proportional hazard model. We fitted univariate proportional hazard models for each baseline covariate, and variables with p<0.20 in the univariate model were then used in a multivariable model with a stepwise selection approach where covariates were retained in the model if the p-value was <0.05.
Analyses were conducted using SAS 9.4 (SAS Institute Inc., Cary, NC.) and R version 3.2.0 (R Core Team, 2013). All tests reported were two-sided and p-values less than 0.05 were considered statistically significant.
Results
Characteristics of HBeAg-negative cohort with low-level viremia
Of 2015 total participants recruited into the HBRN Adult Cohort Study, 970 (48.1%) met inclusion criteria (Figure 1). The median age of participants was 43 (IQR 35-54) years and approximately half were female. The racial breakdown of the overall cohort included 64% Asian, 14% White, 20% Black and 3% other including Asian-Pacific Islander and mixed race. Hispanic ethnicity comprised 2% of the total cohort. The majority of Asian (91%) and Black (74%) participants were foreign-born. At entry, 408 (43%) of 951 participants with available ALT data had a normal ALT; 308 (32%) had an ALT between ULN-≤1.5x ULN and 119 (13%) had an ALT between >1.5x ULN-≤2x ULN (see Figure 1). A small number of participants with low-level viremia had ALT >2x ULN at entry into study (n=116, 12%). 11.1% of participants reported prior oral nucleos(t)ide therapy (at least 6 months prior to entry). 5.1% were positive for hepatitis D antibody and 2.6% positive for hepatitis C antibody.
A summary of baseline viral and host characteristics stratified by category of HBV DNA level at entry (≤100, 101-≤2000, and 2001-≤10,000 IU/mL) is presented in Table 1. At baseline, only estimated duration of infection, body mass index (BMI), qHBsAg, presence of precore mutations, and baseline FIB-4 score differed significantly across the three HBV DNA categories (all p<0.05) (Table 1). Quantitative HBsAg was 2.8 log10 IU/mL in the lowest HBV DNA category, compared to 3.2 log10 IU/mL in the higher categories (p<0.001). Precore mutations were more frequent among higher DNA categories. Of those with HBV DNA ≤100 IU/mL at entry 6% had a FIB-4 score >3.25 consistent with advanced fibrosis20 compared to 2% in those with HBV DNA 101-≤2000 IU/mL and 1% in those with HBV DNA 2001-≤10,000 IU/mL (p=0.02). Estimated duration of infection was longer in the higher HBV DNA categories. Body mass index was highest in lowest HBV DNA category and lowest in the highest HBV DNA category. Age, sex, race and metabolic co-morbidities did not differ among the three groups.
Table 1.
Baseline characteristics across baseline categories of HBV DNA for participants with HBV DNA≤10,000 IU/mL (n=951)
| HBV DNA level (IU/mL) | ||||
|---|---|---|---|---|
| ≤100 n=262 | 101 to ≤2000 n=465 | 2001 to ≤10,000 n=224 | p-value | |
| Age, years | 42 (33-54) | 43 (35-54) | 44 (37-51) | 0.73 |
| Male | 116 (44%) | 231 (50%) | 111 (50%) | 0.33 |
| Race | 0.28 | |||
| White | 40 (15%) | 66 (14%) | 26 (12%) | |
| Black | 63 (24%) | 82 (18%) | 41 (18%) | |
| Asian | 151 (58%) | 303 (65%) | 152 (68%) | |
| Other | 7 (3%) | 13 (3%) | 5 (2%) | |
| Hispanic | 7 (3%) | 5 (1%) | 6 (3%) | 0.20 |
| Married or living in a marriage-like relationship | 168 (65%) | 341 (74%) | 154 (69%) | 0.08 |
| Education | 0.54 | |||
| Less than high school | 37 (14%) | 76 (17%) | 25 (11%) | |
| High school diploma or equivalent | 53 (20%) | 90 (20%) | 35 (16%) | |
| Some college or above | 169 (66%) | 290 (64%) | 161 (72%) | |
| Diabetes | 16 (6%) | 32 (7%) | 14 (6%) | 0.91 |
| Hyperlipidemia | 34 (13%) | 64 (14%) | 30 (14%) | 0.94 |
| Lipid lowering mediations | 25 (28%) | 47 (40%) | 22 (37%) | 0.22 |
| BMI, kg/m2 | 25.4 (23.1-,28.2) | 24.9 (21.9-28.1) | 23.9 (21.9-27.0) | 0.006 |
| Vertical transmission | 92 (50%) | 175 (54%) | 97 (59%) | 0.50 |
| Estimated duration of infection, years | 30 (18-40) | 35 (22-45) | 37 (23-45) | 0.01 |
| HBV genotype | n=138 | n=435 | n=219 | 0.81 |
| A | 28 (20%) | 98 (23%) | 54 (25%) | |
| B | 42 (30%) | 145 (33%) | 82 (37%) | |
| C | 42 (30%) | 129 (30%) | 55 (25%) | |
| D | 18 (13%) | 44 (10%) | 19 (9%) | |
| Other | 8 (6%) | 15 (3%) | 7 (3%) | |
| HBV mutations | n=48 | n=214 | n=131 | |
| Precore | 11 (23%) | 86 (40%) | 66 (50%) | 0.004 |
| Core promoter | 13 (27%) | 82 (38%) | 47 (36%) | 0.36 |
| Prior HBV therapy | 30 (12%) | 49 (11%) | 28 (13%) | 0.75 |
| AST, U/L | 25 (20-33) | 25 (21-31) | 24 (20-31) | 0.28 |
| ALT, U/L | 26 (20-41) | 26 (20-37) | 27 (20-39) | 0.82 |
| Platelet count, x103/mm3 | 220 (182-264) | 218 (179-261) | 226 (185-260) | 0.57 |
| Quantitative HBsAg, IU/mL | 2.8 (1.6-3.7) | 3.2 (2.3-3.8) | 3.2 (2.7-3.9) | <0.001 |
| APRI | 0.08 | |||
| ≤0.50 | 176 (81%) | 349 (86%) | 164 (87%) | |
| >0.50-1.50 | 35 (16%) | 54 (13%) | 22 (12%) | |
| >1.50 | 7 (3%) | 3 (1%) | 2 (1%) | |
| FIB-4 | 0.019 | |||
| <1.45 | 169 (78%) | 318 (79%) | 152 (81%) | |
| 1.45-3.25 | 37 (17%) | 79 (20%) | 34 (18%) | |
| >3.25 | 12 (6%) | 6 (2%) | 2 (1%) | |
Abbreviations: HBV = hepatitis B virus; AST = aspartate aminotransferase; ALT = alanine aminotransferase; APRI = AST-to-platelet ratio index; FIB-4 = fibrosis-4 score; HBsAg = hepatitis B surface antigen; BMI = body mass index
Numbers represents frequency (percent) for categorical variables and median (25th percentile, 75th percentile) for continuous variables.
Evolution of HBV DNA and ALT levels during follow-up
The median duration of follow-up was 4 years (IQR 1.4-5.3 years) with a median of 9 (IQR 4-12) follow-up visits per participant. Excursions of HBV DNA over 10,000 IU/mL or ALT ratio >2 after entry are presented for individual participants over 5 years of follow-up in Supplementary Figure 1. Color-coded heat maps in Figure 2A demonstrate that the majority of participants displayed stability with respect to HBV DNA levels over time, with most remaining in the same or lower HBV DNA group throughout follow-up.
Figure 2. Changes in study cohort with respect to A) HBV DNA category and B) ALT category over duration of follow-up (n=970).
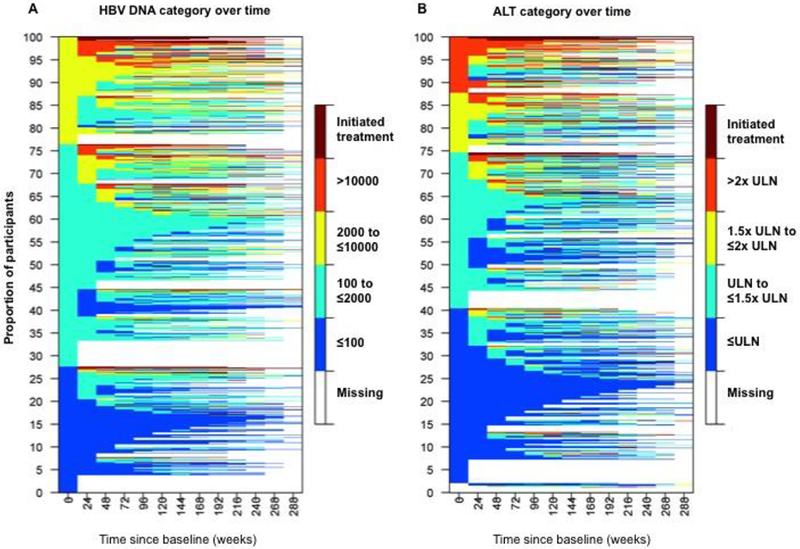
Abbreviations: ALT=alanine aminotransferase; ULN=upper limit of normal
Color-coded heat-maps demonstrate evolution of HBV DNA (left panel) and ALT (right panel) categories over duration of follow-up for each individual participant (1 participant for each line). Starting from the left-most time point (week 0) one can see the shift in the proportion of participants from one category to others. For example, in the left panel approximately 28% of the participants start with HBV DNA <= 100 IU/mL (represented by blue color), however, by week 24 only about 17% of them are observed to be in the same category, and similarly for others.
Time since baseline visit is represented on the x-axis in 24-week intervals. Color tiles represent HBV DNA and ALT category at each follow-up visit. Color-coding of HBV DNA/ALT categories are as follows: Dark blue = HBV DNA≤100 or ALT≤ULN; Light blue = HBV DNA 100-≤2000 or ALT 1-1.5x ULN; Yellow = HBV DNA 2000-≤10,000 or ALT 1.5-2x ULN; and Orange = HBV DNA>10,000 or ALT>2x ULN. Maroon tiles represent initiation of treatment. White tiles (missing) represent censoring when no further follow-up is available.
Units for HBV DNA is IU/mL, ULN for ALT is 30 U/L for males and 20 U/L for females. Missing values between measurements were imputed by carrying the last non-missing observation forward. Of note, only 2% of paired consecutive HBV DNA and ALT measurements in our cohort were more than 60 weeks apart. Note 19 participants without baseline ALT were included in heatmap as missing at baseline in panel B.
The proportion of participants who remained in the same baseline or lower HBV DNA category was comparable across groups. In the lowest HBV DNA category, an estimated 61-70% of the participants remained in the lowest category over the follow-up period. Similarly, an estimated 71-77% with HBV DNA between 101-≤2000 IU/mL and 67-80% with HBV DNA between 2001-≤10,000 IU/mL remained in the same or moved to a lower level HBV DNA category. A maximum of 3% of the participants with HBV DNA≤100 IU/mL exceeded HBV DNA 10,000 IU/mL during follow-up (at week 168) compared to 8% with HBV DNA 101-≤2000 IU/mL (at week 168) and 22% with HBV DNA 2001-≤10,000 IU/mL (at week 96).
In Figure 2B, changes in ALT levels during follow-up are presented. In participants with normal ALT at baseline, an estimated 65-74% remained with normal ALT over the follow-up period. Additionally, 74-80% with ALT ULN-≤1.5x ULN and 75-81% with ALT 1.5x ULN-≤2x ULN stayed in the same or lower ALT category. The estimated maximum proportion exceeding ALT 2x ULN during follow-up was 3%, 9% and 18% with each successively higher baseline ALT category, respectively (all occurring at week 240).
Frequency of Phase Transition
Phase transition was investigated in 834 participants with HBV DNA ≤10,000 IU/mL and ALT ≤2x ULN at cohort entry. Of these, 97 experienced phase transition or initiated treatment (7.6 per 100 person-years). Rates of phase transition or treatment initiation varied significantly across the DNA categories (4.6, 6.8, and 12.2 per 100 person-years in those with HBV DNA ≤100 IU/mL, 101-≤2000 IU/mL, and 2001-≤10,000 IU/mL respectively [p<0.001]). The 5-year cumulative incidence for phase transition in these three HBV DNA categories was: 9.2%, 13.6%, and 24.2%, respectively (p<0.001) (Figure 3). When treatment initiation was censored, there were 55 phase transitions (overall rate 3.6 per 100 person-years). The incidence rate of phase transition with censoring of treatment was 0.8, 3.7 and 5.9 per 100 person-years and the cumulative incidence rate at 5 years was 2.4%, 8.3%, and 13.3% respectively for HBV DNA≤100, 101-≤2000, and 2001-≤10,000 IU/mL (p<0.001).
Figure 3. Cumulative incidence of phase transition or treatment initiation for participants with A) phase transition and/or treatment initiation and B) phase transition with censoring of treatment initiation over 5 years of follow-up stratified by HBV DNA category (n=834).
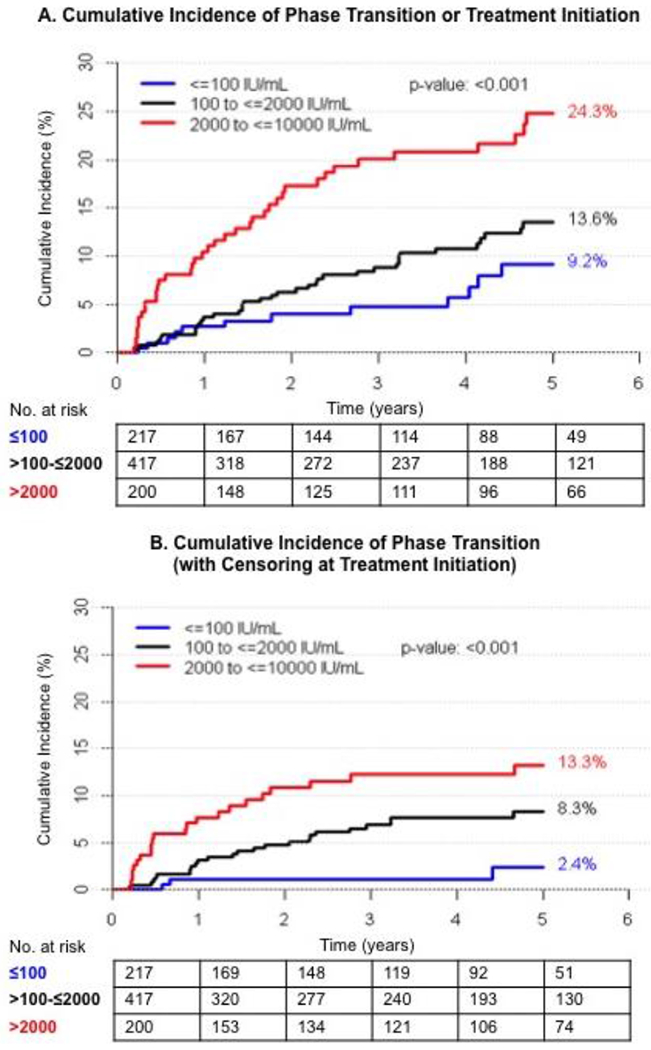
The Kaplan-Meier plots show up to five-years of follow-up, when a reasonable number of participants were still at risk of phase transition (n=236 in Panel A and n=255 in Panel B).
Comparison of cumulative incidence rates from secondary and sensitivity analyses are presented in Table 2. Of 634 participants with HBV DNA ≤2000 IU/mL at baseline, the cumulative incidence rate of phase transition or treatment initiation at 5 years was 9.7% and 15.9% respectively for HBV DNA≤100 and 101-≤2000 (p=0.09), and the cumulative incidence rate of phase transition with censoring of treatment was 3.0% and 10.6% (p=0.003) (see Supplementary Figure 2). Cumulative incidence rates did not change with use of higher ULN of ALT (Supplementary Figure 3).
Table 2.
Factors independently associated with phase transition or treatment initiation in HBeAg-negative CHB patients HBV DNA≤10,000 IU/mL (n=547)
| Covariates* | Adjusted HR (95% CI) | Five-Year Cumulative % |
|---|---|---|
| Genotype A | Ref | 10.7 |
| B | 3.8 (1.8-8.4) | 21.7 |
| C | 2.4 (1.1-5.0) | 17.1 |
| D | 1.0 (0.2-3.7) | 5.2 |
| Other | 0.6 (0.1-5.0) | 10.7 |
| No history of hyperlipidemia | Ref | 13.2 |
| History of hyperlipidemia | 2.8 (1.6-4.9) | 27.6 |
| ALT (U/L) ≤ULN | Ref | 8.9 |
| >ULN to ≤1.5x ULN | 2.3 (1.3-4.03) | 19.4 |
| 1.5x ULN to ≤2x ULN | 3.1 (1.6-5.9) | 26.1 |
| HBV DNA (IU/mL) ≤100 | Ref | 9.2 |
| 100 to ≤2000 | 2.5 (0.9-7.1) | 13.6 |
| 2000 to ≤10,000 | 4.6 (1.6-13.2) | 24.7 |
| Platelet count (per 20000 mm3 decline) | 1.2 (1.1-1.3) | N/A** |
| HBsAg (IU/mL) ≤1000 | Ref | 14.7 |
| HBsAg >1000 | 1.8 (1.0-3.0) | 16.6 |
Abbreviations: HBeAg = hepatitis B early antigen; CHB = chronic hepatitis B; HR = hazard ratio; Ref = reference; ALT = alanine aminotransferase; ULN = upper limit of normal; HBV DNA = hepatitis B virus deoxyribonucleic acid; HBsAg = hepatitis B surface antigen
The variables that were selected by step-wise selection included APRI instead of platelet count. Since AST and ALT are highly correlated, APRI was replaced in the model with platelet count. Basal core promoter and pre-core mutations were not included in the multivariable model due to the high proportion of missing data.
Platelet count was included as a continuous random variable. Five-year rates not applicable.
By year 5 (week 240), 11% of the total cohort had started treatment. In addition, a total of 21 (2%) participants seroreverted to HBeAg positive (1.2 per 100 person-years) while 58 (6%) participants lost HBsAg (5.4 per 100 person-years). The rates of HBsAg loss were 7.2, 5.4, and 3.6 per 100 person-years respectively, for HBV DNA categories ≤100, 101-≤2000, and >2000 IU/mL (p = 0.001).
Predictors of Phase Transition
On univariate analysis, variables associated with higher hazard of phase transition or treatment initiation included older age, lower education level, medical history of diabetes, hyperlipidemia, lower platelet count and higher ALT, AST, HBV DNA level, qHBsAg level, APRI, and FIB-4 score (all p<0.05) (Supplementary Table 1). Factors associated with higher hazard of phase transition alone with censoring of treatment initiation included higher ALT, AST, APRI, HBV DNA, and qHBsAg, and lower platelet count (p<0.05).
In multivariable Cox regression (see Table 3), phase transition or treatment initiation were independently predicted by baseline HBV DNA ≥2000 IU/mL (HR 4.6, 95% CI 1.6-13.2) but not 101-≤2000 IU/mL (HR 2.5, 95% CI 0.9-7.1) compared to those with ≤100 IU/mL. Compared to normal ALT levels, ALT between ULN-1.5x ULN and 1.5x-2x ULN were associated with a 2.3-fold (95% CI 1.3-4.0) and 3.1-fold (95% CI 1.6-5.9) increased risk of phase transition or treatment initiation, respectively. Other predictors included genotype B vs. A (HR 3.8, 95% CI 1.8-8.4), C vs A (HR 2.4, 95% CI 1.1 – 5.0), lower platelet count (HR 1.2, 95% CI 1.1-1.3 per 20000 mm3 decline), and qHBsAg >1000 IU/mL (HR 1.8, 95% CI 1.0-3.0). History of hyperlipidemia was the sole host characteristic associated with phase transition in the multivariable model; participants with hyperlipidemia had a 27.6% 5-year cumulative incidence of phase transition or treatment initiation compared to 13.2% without hyperlipidemia (HR 2.8, 95% CI 1.6-4.9). Participants with hyperlipidemia were older (55 vs 41 years), more likely male (62% vs 46%), had longer duration of infection (43 vs 33 years), and had higher median ALT levels (30 vs 26 U/L) (all p<0.05) (Supplementary Table 2). With censoring of treatment among those with HBV DNA ≤10,000 IU/mL, only higher ALT and HBV DNA categories, and lower platelet count were associated with higher risk of phase transition (Supplementary Table 3).
Table 3.
Cumulative incidence rates at 5 years of follow-up by differential HBV DNA and ALT cut-offs
| Cohort inclusion | |||
|---|---|---|---|
| Outcome | HBV DNA ≤10000 | HBV DNA ≤2000 | Higher ALT cut-offsa |
| Phase transition or treatment initiation | |||
| >2000 | 24.3% | -- | 24.8% |
| >100-≤2000 | 13.6% | 15.9% | 13.4% |
| ≤100 | 9.2% | 9.7% | 9.1% |
| Phase transition alone | |||
| >2000 | 13.3% | -- | 12.5% |
| >100-≤2000 | 8.3% | 10.6% | 7.8% |
| ≤100 | 2.4% | 3.0% | 1.6% |
Upper limit of normal of ALT defined as >25 U/L for females and >35 U/L for males.
Multivariable predictors of phase transition or treatment initiation in secondary analysis of patients with HBV DNA ≤2000 IU/mL included history of diabetes (HR 4.0, 95% CI: 2.0-7.8) and ALT >1.5-2x ULN (HR 3.3, 95% CI 1.7-6.4) compared to normal ALT. Those with HBV DNA 100 to ≤2000 IU/mL did not have significantly higher rates of phase transition or treatment initiation compared to <100 IU/mL (HR 1.5, 95% CI 0.9-2.8) (Supplementary Table 4). Additionally, predictors using higher ULN of ALT remained the same other than qHBsAg >1000 IU/mL no longer meeting statistical significance (HR 1.5, 95% CI 0.9-2.5) (Supplementary Table 5). When participants with self-reported hyperlipidemia and/or diabetes were excluded from analysis, predictors of phase transition or treatment initiation remained the same (data not shown). In particular, ALT remained an independent predictor of outcome.
Discussion
Chronic hepatitis B remains a public health threat, affecting at least 850,000 individuals (possibly as high as 2.2 million) in the United States21,22. This study focuses on the natural history of HBeAg-negative CHB infection using a large, prospectively studied, multiethnic cohort of adult patients from the United States and Canada. We found that 85% of HBeAg-negative patients with low-level viremia (HBV DNA ≤10,000 IU/mL) remained inactive or off treatment over 5 years. As expected, risk of phase transition increased with successively higher HBV DNA and ALT categories. Viral characteristics, such as genotype and qHBsAg, in our cohort were more predictive of phase transition than host factors such as age and race.
By studying the first instance of HBV DNA and ALT excursion and including treatment initiation in our primary outcome, our estimates represent the maximum rates of phase transition and true spontaneous transitions to active CHB are likely even less frequent. Additionally, our heat-maps show few had sustained transition with most reverting to a lower HBV DNA and ALT level on continued follow-up. We also demonstrate that rates of phase transition are similarly low among those with HBV DNA ≤2,000 regardless of whether the HBV DNA threshold for transition was 2000 (as espoused by current guidelines) or 10,000 IU/mL (15.9% vs 13.6%, respectively, if HBV DNA 101-≤2000). Thus, the vast majority of HBeAg-negative patients with low-level viremia, even those outside of standard definitions for inactive carrier state, remain stable over time. In fact, we would argue based on these results that many patients with HBeAg-negative CHB with HBV DNA between 2000-10,000 IU/mL can be safely monitored with low chance of transition to active disease off treatment.
Although published literature on phase transition use differing HBV DNA and ALT thresholds for cohort inclusion and outcome definitions, these studies consistently demonstrate a benign course for those with HBeAg-negative disease and low-level viremia as reported in our study. In the largest previous prospective study from North America of 414 Alaskan ICs, phase transition, defined as HBV DNA>2000 IU/mL and ALT>40 IU/mL, was also infrequent at 9% occurring over six years23. Results from an Italian study showed that among HBeAg-negative patients with HBV DNA <20,000 IU/mL, 43% outside IC criteria transitioned to IC phenotype versus 2% transitioned to active CHB within 5 years24. Notably, 13% of those with baseline HBV DNA <20,000 IU/mL were classified as active CHB within the 1st year of follow-up, emphasizing that using a single baseline value to determine phenotype will overestimate phase transition on follow-up. Overall, reported rates of transitioning from inactive to active phenotype appears higher in patients from endemic regions, with an incidence of 1.5-6.9 per 100 person-years9,11,25, compared to 0.08-1.2 per 100 person-years in non-endemic regions12,23,26. Age at infection, time to HBeAg seroconversion and HBV genotype are proposed contributors to this difference27. Potential reasons for the higher incidence rate of phase transition of 7.6 per 100 person-years in our cohort include inclusion of patients with higher viral load at baseline and abnormal ALT, use of a single baseline measurement to determine phenotype, counting a single excursion as phase transition, and the inclusion of treatment initiation as part of the composite outcome. Notably definition of ULN of ALT also varies by study, but impact of this is likely minimal as suggested by our sensitivity analysis. Based on these cohort differences, whether there is truly a distinction in transition rates between our multiethnic, but predominantly Asian cohort, and other more homogenous cohorts cannot be ascertained.
Patients with HBV DNA>2000 IU/mL compared to <100 IU/mL carried a 5-fold higher risk of phase transition in our cohort. These patients should still be closely monitored, regardless of ALT level, with the appreciation that only 13% will transition over 5 years (if not treated). Among those with very low viral load (HBV DNA<100 IU/mL), HBsAg seroclearance (10%) was more likely than phase transition (2%) over five years. Thus, in HBeAg-negative patients with very low level of viremia, an elevation of ALT should prompt investigation into alternate causes such as medications, alcohol and steatosis. The low likelihood of phase transition supports current guideline recommendations to monitor HBV DNA and ALT every 6-12 months in HBeAg-negative ICs1. In addition, HBsAg should be checked at least annually to detect spontaneous HBsAg seroclearance, which confers substantially improved prognosis in the absence of cirrhosis28.
Quantitative HBsAg at levels ≥1000 IU/mL was independently associated with phase transition in our study and may be a promising marker to help determine appropriate intervals for viral load testing and differentiate those more likely to transition among HBeAg-negative, particularly those who are indeterminant. Within the HBRN, lowest baseline qHBsAg levels were seen in ICs, with differing levels by HBV genotype: highest in genotype A, lowest in genotype B and intermediate in genotypes C and D29. Other studies have also found significantly lower qHBsAg levels in ICs compared to active CHB30. A combined qHBsAg <1000 IU/mL and HBV DNA <2000 IU/mL distinguishes ICs from HBeAg-negative immune active CHB with a sensitivity of 41-94% and specificity of 72-96%31–34, and very low qHBsAg levels <50 IU/mL predict HBsAg seroclearance10,31. In a multinational, racially diverse cohort of 292 HBeAg-negative patients, a combined HBsAg level <100 IU/mL and HBV DNA <2000 IU/mL could identify those who remained ICs for entirety of follow-up with a specificity of 98% (but sensitivity 35%)35. While HBsAg quantification shows promise as a complementary biomarker to HBV DNA, further study is needed to determine appropriate clinical use and testing intervals, particularly in cohorts with diverse HBV genotypes.
Unexpectedly, we found a clinical history of hyperlipidemia, reported in 13% and similar across HBV DNA categories, conferred a nearly 3-fold increased risk of phase transition or treatment initiation. Participants with hyperlipidemia were older, more often male and had longer duration of infection, all potential reasons that healthcare providers may be more likely to initiate treatment outside of usual criteria. Consistent with this, hyperlipidemia was not independently associated with phase transition alone. Hyperlipidemia may also be a surrogate for metabolic syndrome and presence of non-alcoholic fatty liver disease, a potential secondary cause of liver injury that is increasingly reported in CHB patients36,37, and within the HBRN, metabolic syndrome is associated with higher ALT levels38. However, ALT remained an independent predictor of phase transition when individuals with hyperlipidemia or diabetes were excluded from analysis. Additionally, it must be acknowledged that hyperlipidemia as a self-reported clinical diagnosis may have led to misclassification. Further studies are warranted to clarify the relationship between hyperlipidemia, metabolic syndrome and the natural history of CHB infection.
Strengths of this study include a large sample size and improved generalizability with the inclusion of patients of varying ethnicity from multiple clinical sites. Furthermore, the prospective collection of data with serial laboratory tests strengthens the confidence in our findings. However, several limitations exist. The first is lack of baseline or follow-up fibrosis assessment by liver biopsy or non-invasive methods which would allow evaluation of fibrosis progression, a superior prognosticator of clinical outcome than ALT activity. While we could not exclude patients with advanced fibrosis at baseline, we suspect this number is quite low with FIB4 score>3.25 in only 2% of the cohort. We also did not feel that excluding patients with a high FIB4 score was appropriate, as criteria for inactive disease does not take fibrosis into account. Second, data on pre-core/basal core mutations and metabolic syndrome were unavailable in a significant proportion of patients, limiting our ability to assess the impact of these characteristics on phase transition. We also use a single measurement for cohort inclusion in order to maximize sample size, which likely captured active patients at entry but serves to emphasize that the low rates we reported represent the ceiling of phase transition rates. Lastly, even a follow-up time of five years is inadequate to capture a sufficient number of events to study CHB clinical endpoints. Transition to active disease defined by HBV DNA and ALT levels, however, is an established risk factor for cirrhosis and mortality9,12.
In summary, phase transition or initiation of CHB therapy occurs infrequently in North American HBeAg-negative patients with low-level viremia, including indeterminant individuals with HBV DNA between 2000 and 10,000 IU/mL, supporting current guidelines for monitoring rather than treatment of ICs. More frequent follow-up remains indicated for HBeAg-negative CHB patients with higher HBV DNA, above normal ALT and qHBsAg levels >1000 IU/mL. Future studies incorporating combinations of existing and emerging biomarkers to differentiate ICs from active CHB has practical clinical implications that may allow us to more precisely and efficiently intervene upon HBeAg-negative patients at-risk for CHB-related complications.
Supplementary Material
References
- 1.Terrault NA, Lok ASF, McMahon BJ, et al. Update on prevention, diagnosis, and treatment of chronic hepatitis B: AASLD 2018 hepatitis B guidance. Hepatology 2018;67:1560–99. [DOI] [PMC free article] [PubMed] [Google Scholar]
- 2.Wong GL, Chan HL, Yu Z, Chan HY, Tse CH, Wong VW. Liver fibrosis progression is uncommon in patients with inactive chronic hepatitis B: a prospective cohort study with paired transient elastography examination. J Gastroenterol Hepatol 2013;28:1842–8. [DOI] [PubMed] [Google Scholar]
- 3.Zacharakis G, Koskinas J, Kotsiou S, et al. The role of serial measurement of serum HBV DNA levels in patients with chronic HBeAg(−) hepatitis B infection: association with liver disease progression. A prospective cohort study. J Hepatol 2008;49:884–91. [DOI] [PubMed] [Google Scholar]
- 4.Villa E, Fattovich G, Mauro A, Pasino M. Natural history of chronic HBV infection: special emphasis on the prognostic implications of the inactive carrier state versus chronic hepatitis. Dig Liver Dis 2011;43 Suppl 1:S8–14. [DOI] [PubMed] [Google Scholar]
- 5.Papatheodoridis GV, Manolakopoulos S, Liaw YF, Lok A. Follow-up and indications for liver biopsy in HBeAg-negative chronic hepatitis B virus infection with persistently normal ALT: a systematic review. J Hepatol 2012;57:196–202. [DOI] [PubMed] [Google Scholar]
- 6.Chen CJ, Yang HI, Su J, et al. Risk of hepatocellular carcinoma across a biological gradient of serum hepatitis B virus DNA level. JAMA 2006;295:65–73. [DOI] [PubMed] [Google Scholar]
- 7.Di Bisceglie AM, Lombardero M, Teckman J, et al. Determination of hepatitis B phenotype using biochemical and serological markers. J Viral Hepat 2017;24:320–9. [DOI] [PMC free article] [PubMed] [Google Scholar]
- 8.Spradling PR, Xing J, Rupp LB, et al. Distribution of disease phase, treatment prescription and severe liver disease among 1598 patients with chronic hepatitis B in the Chronic Hepatitis Cohort Study, 2006–2013. Aliment Pharmacol Ther 2016;44:1080–9. [DOI] [PubMed] [Google Scholar]
- 9.Chu CM, Liaw YF. Incidence and risk factors of progression to cirrhosis in inactive carriers of hepatitis B virus. Am J Gastroenterol 2009;104:1693–9. [DOI] [PubMed] [Google Scholar]
- 10.Yim SY, Um SH, Jung JY, et al. Role of hepatitis B surface antigen (HBsAg) in identifying true inactive HBsAg carriers infected with genotype C hepatitis B virus. J Clin Gastroenterol 2014;48:166–71. [DOI] [PubMed] [Google Scholar]
- 11.Taida T, Arai M, Kanda T, et al. The prognosis of hepatitis B inactive carriers in Japan: a multicenter prospective study. J Gastroenterol 2017;52:113–22. [DOI] [PubMed] [Google Scholar]
- 12.Fattovich G, Olivari N, Pasino M, D’Onofrio M, Martone E, Donato F. Long-term outcome of chronic hepatitis B in Caucasian patients: mortality after 25 years. Gut 2008;57:84–90. [DOI] [PubMed] [Google Scholar]
- 13.Manno M, Camma C, Schepis F, et al. Natural history of chronic HBV carriers in northern Italy: morbidity and mortality after 30 years. Gastroenterology 2004;127:756–63. [DOI] [PubMed] [Google Scholar]
- 14.Papatheodoridis GV, Chrysanthos N, Hadziyannis E, Cholongitas E, Manesis EK. Longitudinal changes in serum HBV DNA levels and predictors of progression during the natural course of HBeAg-negative chronic hepatitis B virus infection. J Viral Hepat 2008;15:434–41. [DOI] [PubMed] [Google Scholar]
- 15.Ghany MG, Perrillo R, Li R, et al. Characteristics of adults in the hepatitis B research network in North America reflect their country of origin and hepatitis B virus genotype. Clin Gastroenterol Hepatol 2015;13:183–92. [DOI] [PMC free article] [PubMed] [Google Scholar]
- 16.Prati D, Taioli E, Zanella A, et al. Updated definitions of healthy ranges for serum alanine aminotransferase levels. Ann Intern Med 2002;137:1–10. [DOI] [PubMed] [Google Scholar]
- 17.Ganova-Raeva L, Ramachandran S, Honisch C, Forbi JC, Zhai X, Khudyakov Y. Robust hepatitis B virus genotyping by mass spectrometry. J Clin Microbiol 2010;48:4161–8. [DOI] [PMC free article] [PubMed] [Google Scholar]
- 18.Sterling RK, Lissen E, Clumeck N, et al. Development of a simple noninvasive index to predict significant fibrosis in patients with HIV/HCV coinfection. Hepatology 2006;43:1317–25. [DOI] [PubMed] [Google Scholar]
- 19.Wai CT, Greenson JK, Fontana RJ, et al. A simple noninvasive index can predict both significant fibrosis and cirrhosis in patients with chronic hepatitis C. Hepatology 2003;38:518–26. [DOI] [PubMed] [Google Scholar]
- 20.Kim BK, Kim DY, Park JY, et al. Validation of FIB-4 and comparison with other simple noninvasive indices for predicting liver fibrosis and cirrhosis in hepatitis B virus-infected patients. Liver Int 2010;30:546–53. [DOI] [PubMed] [Google Scholar]
- 21.Cohen C, Evans AA, London WT, Block J, Conti M, Block T. Underestimation of chronic hepatitis B virus infection in the United States of America. J Viral Hepat 2008;15:12–3. [DOI] [PMC free article] [PubMed] [Google Scholar]
- 22.Kowdley KV, Wang CC, Welch S, Roberts H, Brosgart CL. Prevalence of chronic hepatitis B among foreign-born persons living in the United States by country of origin. Hepatology 2012;56:422–33. [DOI] [PubMed] [Google Scholar]
- 23.Tohme RA, Bulkow L, Homan CE, Negus S, McMahon BJ. Rates and risk factors for hepatitis B reactivation in a cohort of persons in the inactive phase of chronic hepatitis B-Alaska, 2001-2010. J Clin Virol 2013;58:396–400. [DOI] [PMC free article] [PubMed] [Google Scholar]
- 24.Oliveri F, Surace L, Cavallone D, et al. Long-term outcome of inactive and active, low viraemic HBeAg-negative-hepatitis B virus infection: Benign course towards HBsAg clearance. Liver Int 2017;37:1622–31. [DOI] [PubMed] [Google Scholar]
- 25.Hsu YS, Chien RN, Yeh CT, et al. Long-term outcome after spontaneous HBeAg seroconversion in patients with chronic hepatitis B. Hepatology 2002;35:1522–7. [DOI] [PubMed] [Google Scholar]
- 26.Tong MJ, Trieu J. Hepatitis B inactive carriers: clinical course and outcomes. J Dig Dis 2013;14:311–7. [DOI] [PubMed] [Google Scholar]
- 27.Chen YC, Chu CM, Liaw YF. Age-specific prognosis following spontaneous hepatitis B e antigen seroconversion in chronic hepatitis B. Hepatology 2010;51:435–44. [DOI] [PubMed] [Google Scholar]
- 28.Chen YC, Liaw YF. Spontaneous HBsAg seroclearance confers excellent prognosis except in patients with cirrhosis. Hepatology 2004;40:501; author reply −2. [DOI] [PubMed] [Google Scholar]
- 29.Brouwer WP, Cloonan YK, Feld JJ, et al. Hepatitis B Surface Antigen (HBsAg) Levels Differ Across HBV Genotype and Phenotype: Results from the Adult Cohort Study of the NIDDK-Sponsored Hepatitis B Research Network. Journal of Hepatology 2014;60:S49. [Google Scholar]
- 30.Brunetto MR, Oliveri F, Colombatto P, et al. Hepatitis B surface antigen serum levels help to distinguish active from inactive hepatitis B virus genotype D carriers. Gastroenterology 2010;139:483–90. [DOI] [PubMed] [Google Scholar]
- 31.Ungtrakul T, Sriprayoon T, Kusuman P, et al. Role of quantitative hepatitis B surface antigen in predicting inactive carriers and HBsAg seroclearance in HBeAg-negative chronic hepatitis B patients. Medicine (Baltimore) 2017;96:e6554. [DOI] [PMC free article] [PubMed] [Google Scholar]
- 32.Maimone S, Caccamo G, Squadrito G, et al. A combination of different diagnostic tools allows identification of inactive hepatitis B virus carriers at a single time point evaluation. Liver Int 2017;37:362–8. [DOI] [PubMed] [Google Scholar]
- 33.Liu J, Yang HI, Lee MH, et al. Serum Levels of Hepatitis B Surface Antigen and DNA Can Predict Inactive Carriers With Low Risk of Disease Progression. Hepatology 2016;64:381–9. [DOI] [PubMed] [Google Scholar]
- 34.Martinot-Peignoux M, Lapalus M, Laouenan C, et al. Prediction of disease reactivation in asymptomatic hepatitis B e antigen-negative chronic hepatitis B patients using baseline serum measurements of HBsAg and HBV-DNA. J Clin Virol 2013;58:401–7. [DOI] [PubMed] [Google Scholar]
- 35.Brouwer WP, Lik-Yuen Chan H, Brunetto MR, et al. Repeated Measurements of Hepatitis B Surface Antigen Identify Carriers of Inactive HBV During Long-term Follow-up. Clin Gastroenterol Hepatol 2016. [DOI] [PubMed] [Google Scholar]
- 36.Shi JP, Fan JG, Wu R, et al. Prevalence and risk factors of hepatic steatosis and its impact on liver injury in Chinese patients with chronic hepatitis B infection. J Gastroenterol Hepatol 2008;23:1419–25. [DOI] [PubMed] [Google Scholar]
- 37.Bondini S, Kallman J, Wheeler A, et al. Impact of non-alcoholic fatty liver disease on chronic hepatitis B. Liver Int 2007;27:607–11. [DOI] [PubMed] [Google Scholar]
- 38.Khalili M, Shuhart MC, Lombardero M, et al. Relationship Between Metabolic Syndrome, Alanine Aminotransferase Levels, and Liver Disease Severity in a Multiethnic North American Cohort With Chronic Hepatitis B. Diabetes Care 2018;41:1251–9. [DOI] [PMC free article] [PubMed] [Google Scholar]
Associated Data
This section collects any data citations, data availability statements, or supplementary materials included in this article.