

Summary
The lymphatic system comprises blind-ended tubes that collect interstitial fluid and return it to the circulatory system. In mammals, unidirectional lymphatic flow is driven by muscle contraction working in conjunction with valves. Accordingly, defective lymphatic valve morphogenesis results in backflow leading to edema. In fish species, studies dating to the 18th century failed to identify lymphatic valves, a precedent that currently persists, raising the question of whether the zebrafish could be used to study the development of these structures. Here, we provide functional and morphological evidence of valves in the zebrafish lymphatic system. Electron microscopy revealed valve ultrastructure similar to mammals, while live imaging using transgenic lines identified the developmental origins of lymphatic valve progenitors. Zebrafish embryos bearing mutations in genes required for mammalian valve morphogenesis show defective lymphatic valve formation and edema. Together, our observations provide a foundation from which to further investigate lymphatic valve formation in zebrafish.
eTOC
The zebrafish lymphatic system is thought to be devoid of valves. Here, Shin et al. provide morphological, molecular, and genetic evidence of functional valves in the larval zebrafish lymphatic system. This work provides a foundation for studying lymphatic valve development in the zebrafish.
Introduction
The lymphatic system is a network of blind-ended tubes that are essential for fluid homeostasis (Tammela and Alitalo, 2010). Lymphatic vessels are divided into two functional classes: capillaries and collecting vessels. In lymphatic capillaries, endothelial cells are highly permeable to facilitate fluid uptake from interstitial space and lack mural cells. By contrast, collecting lymphatic vessels feature a significant basement membrane and vascular smooth muscle coverage. Unlike blood vessels, where circulation is driven by the heart, lymphatic flow is stimulated by skeletal muscle contraction in mammals (Bazigou and Makinen, 2013). Accordingly, an essential feature of lymphatic collecting vessels are bicuspid valves that promote unidirectional fluid flow from lymphatic capillaries into collecting vessels towards connection points with the circulatory system. Consistent with their importance for lymphatic function, defects in valve morphogenesis lead to pathological interstitial fluid accumulation (Petrova et al., 2004).
In mouse embryos, valve morphogenesis initiates with selective upregulation of Gata2 and Prox1 in lymphatic valve endothelial cells around E15, followed by increased expression of Foxc2 and Nfatc1 (Kazenwadel et al., 2015; Norrmen et al., 2009). Loss of these transcription factors leads to an arrest in lymphatic valve formation (Kazenwadel et al., 2015; Norrmen et al., 2009; Petrova et al., 2004). Moreover, human patients with lymphedema-distichiasis or Emberger’s syndrome bear mutations in FOXC2 or GATA2, respectively, and display abnormal valve formation and lymphedema, underscoring their conserved role in lymphatic valve development (Kazenwadel et al., 2015; Petrova et al., 2004). Following initial specification, lymphatic valve endothelial cells express adhesion molecules, exhibit cuboidal morphology, and condense into a ring-like cluster around the lumen (Sabine et al., 2012). At the same time, lymphatic valve endothelial cells begin to express extracellular matrix (ECM) components (Bazigou et al., 2009; Norrmen et al., 2009) and subsequently form semilunar bicuspid leaflets that protrude into the collecting vessel lumen (Sabine et al., 2012). Functional lymphatic valve leaflets consist of flattened endothelial cells surrounding a thick ECM core.
The zebrafish is a highly impactful model to study lymphatic development (Koltowska et al., 2013; Mauri et al., 2018). In vivo time-lapse imaging of zebrafish embryos has enabled insights into the developmental origins of lymphatic vessels and their progenitors (Nicenboim et al., 2015; Yaniv et al., 2006). At the same time, forward genetic screens have revealed genes required for lymphatic morphogenesis in zebrafish, including those subsequently found to be mutated in humans with lymphedema (Alders et al., 2009; Hogan et al., 2009). Surprisingly, it was not until 2006 that lymphatic vessels were definitively characterized in the zebrafish embryo (Yaniv et al., 2006), despite studies as early as the 1700’s that described a functional lymphatic system in teleost fish (Hewson and Hunter, 1769). Interestingly, from their early work, Hewson and Hunter could not definitively identify a valve in the lymphatic system of fishes (Hewson and Hunter, 1769). Consequently, current precedent is that the zebrafish lymphatic system does not possess valves (Koltowska et al., 2013). However, in this study we provide convincing morphological, molecular, and genetic evidence for the presence of functional valves in the zebrafish lymphatic system. Together, our studies overturn 250 years of precedent and demonstrate that the zebrafish will be a worthwhile model for investigating the development of lymphatic valves.
Results
Identification and morphology of lymphatic valves in zebrafish larvae.
We previously found that facial lymphatic vessels (FLVs; see Figure 1A, B) are essential for fluid homeostasis in zebrafish larvae, while those in the trunk are dispensable (Shin et al., 2016b). In the course of those studies, we noted incomplete perfusion of the facial lymphatic system following injection of QDots into the caudal root of the FLV, with a slight constriction evident at the point where flow was blocked (Figure 1B, C). In these particular cases, most larvae maintained in anesthetic (Tricaine) to prevent skeletal muscle contraction continued to exhibit this block (Figure 1D). By contrast, larvae allowed to recover for 30 minutes without Tricaine always showed complete perfusion (Figure 1E), suggesting that muscle contraction facilitates flow into the rostral section of the FLV. In the mammalian lymphatic system, unidirectional flow is governed by muscle contraction together with valves to prevent backflow. Therefore, we hypothesized that a valve regulated flow between two discrete compartments in the facial lymphatic system (Figure 1F).
Figure 1. Functional evidence of a lymphatic valve in the zebrafish facial lymphatic system.
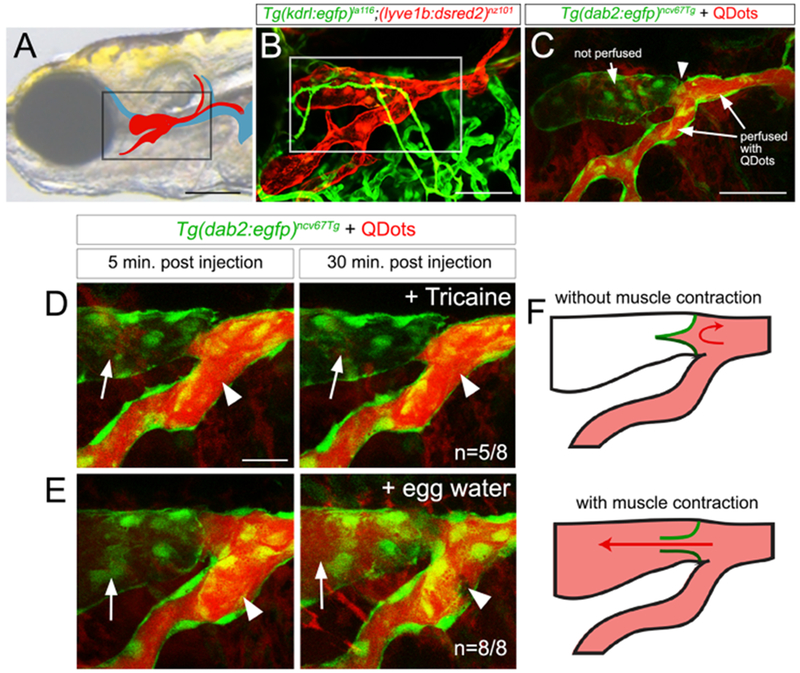
(A) FLV (red) and veins (blue). Box indicates region in (B). Scale bar = 250 μm.
(B) Confocal micrograph of facial lymphatics (red; Tg(lyve1b:dsred2)nz101) and blood vessels (green; Tg(kdrl:egfp)la116) at 5 days post fertilization (dpf). White outline indicates region in (C). Scale bar = 100 μm.
(A-E) Lateral views, anterior to the left, dorsal is up.
(C-E) TgBAC(dab2:egfp)ncv67Tg embryos with Qdots injected into FLV.
(C) 5 dpf, scale bar = 100 μm; white arrowhead indicates blocked flow.
(D, E) 7 dpf, scale bar = 50 μm. Arrows and arrowheads denote rostral and caudal regions of the FLV. n=number of embryos with indicated phenotype versus all analyzed in each class.
(F) Schematic summary of (D, E). Green lines are valve leaflets, red is FLV perfusion.
To determine if valves were present in the FLV, we applied electron microscopy (EM), focusing on the region where we observed blocked flow. At 4 days post fertilization (dpf), we identified endothelial cells immediately rostral to the FLV branchpoint that protruded from both the dorsal and ventral vessel walls into and spanning the lumen (Figure 2A; Video S1). At 7 and 14dpf, two separate leaflets comprising flattened endothelial cells spanned the lumen (Figure 2B, C; Video S2, 3). To better visualize lymphatic valve structure, we performed 3dimensional reconstruction of scanning EM (SEM) serial sections from a 7 dpf larva. This analysis revealed a bicuspid valve with each leaflet comprising 3 cells and nuclei of the rostral-most cells aligned distally within the lumen (Video S4, see Figure 5E). Higher magnification analysis of transmitted EM sections at 14 dpf demonstrated evidence that endothelial cells within the leaflet were attached to an extracellular matrix (ECM) core (Figure 2D, E, denoted by yellow arrowheads), with structures reminiscent of collagen fibrils and electron-dense regions suggesting junctional complexes (arrowheads and arrows, respectively, in Figure 2F). More distally along the leaflet, similar electron dense regions were seen at sites of direct contact between lymphatic valve endothelial cells (Figure 2G). We also find evidence for a similar bicuspid leaflet structure within the FLV of medaka larvae at 7 and 17 dpf (Figure 2H, I) suggesting that lymphatic valves are a conserved anatomical feature in teleost fish. In zebrafish, we also noted the appearance of mural-like cells located immediately adjacent to facial lymphatic endothelial cells rostral to the valve at 7 dpf in SEM sections (Figure 2J). Cells in this same position express a pdgfrb-driven RFP transgene (Figure 2K; Ando et al., 2016) consistent with a mural cell identity, although they are not positive for acta2:mcherry, a marker for differentiated vascular smooth muscle cells, as late as 14 dpf (Figure S1; Whitesell et al., 2014). Together, these results provide morphological evidence of a bicuspid valve in the zebrafish facial lymphatic system with a structure similar to that in mammals.
Figure 2. Zebrafish lymphatic valve ultrastructure.
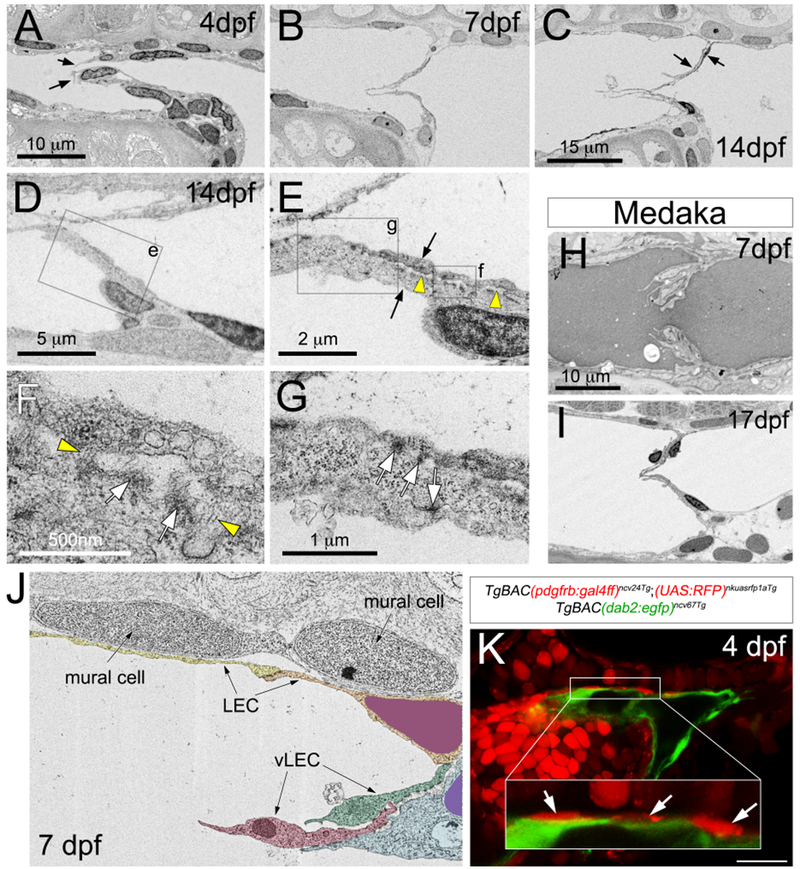
(A-J) Scanning (A-C, H-J) and transmission (D-G) electron micrographs at indicated stages. Lateral views, anterior to the left, dorsal is up. (A-G, J) Sagittal sections from zebrafish larvae. Scale bars are indicated. Images are representative of sections from at least 3 separate larvae.
(A) Arrows indicate distal-most lymphatic valve endothelial cells.
(C) Arrows indicate two separate lymphatic endothelial cells contributing to a leaflet.
(D-G) 14 dpf zebrafish larvae. (D) Box is region shown in (E).
(E) Arrows denote two lymphatic valve endothelial cells separated by an ECM core (yellow arrowheads). Boxes denote area in (F) and (G).
(F) Yellow arrowheads indicate fibril-like structures. White arrows denote electron-dense regions.
(G) White arrows indicate electron-dense regions.
(H, I) Horizontal sections of Medaka FLV at indicated stages.
(J) SEM at 7 dpf. Mural cells are indicated. Lymphatic endothelial cells (LEC) and valve LECs (vLEC) are pseudocolored.
(K) Confocal micrograph of indicated transgenic larvae at 4 dpf. Scale bar = 50 μm. White box is magnified in inset. Mural cells are denoted by white arrows.
Figure 5. itga9 is required for zebrafish lymphatic valve morphogenesis.
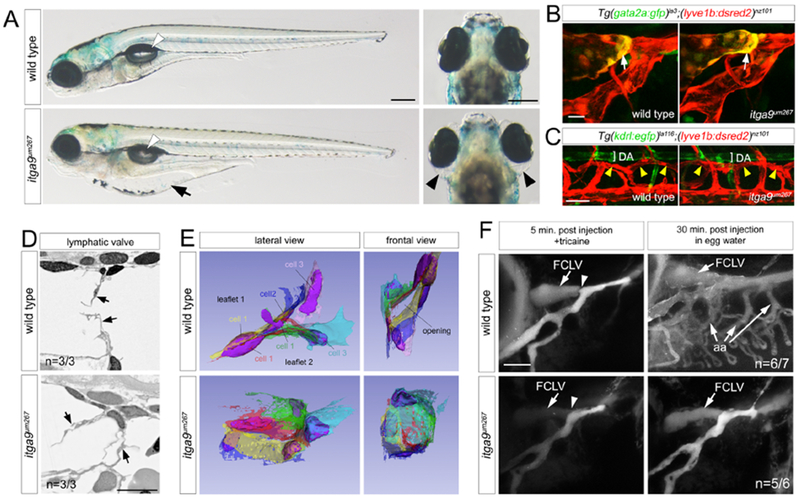
(A) Transmitted light images of live embryos of indicated genotype at 7dpf. Left panels, lateral views, dorsal is up, anterior to left. Arrow indicates gut edema. White arrowheads denote swim bladder. Right panels, dorsal views. Arrowheads indicate ocular edema. Scale bar = 250 μm.
(B) FLVs in Tg(gata2a:gfp)la3;(lyve1b:dsred2)nz101 larvae of indicated genotype at 4 dpf. White arrows indicate gata2a:gfp expression in presumptive lymphatic valve endothelial cells. Scale bar = 10 μm.
(C) Thoracic duct (yellow arrowheads) in Tg(kdrl:egfp)la116;(lyve1b:dsred2)nz101 larvae of indicated genotype at 7 dpf. DA - Dorsal aorta. (B, C) Confocal micrographs, lateral views, dorsal is up, anterior to left. Scale bar = 50 μm.
(D) Lymphatic valves (arrows) visualized by SEM in larvae of indicated genotype at 7 dpf. Scale bar = 10 μm. n=number of embryos with indicated phenotype.
(E) 3D reconstruction of SEM sections from 7 dpf sibling larvae of indicated genotype.
(F) Confocal micrographs of 6 dpf larvae with indicated treatment following QDot injection into the FLV. Facial collecting lymphatic vessel (FCLV) and aortic arch (aa) blood vessels are indicated. Arrowheads denote lymphatic valve location. Scale bar = 50 μm. n=number of embryos with indicated phenotype versus all analyzed in each class
Molecular characterization of lymphatic valve endothelial cells
In mouse, Gata2 is a determinant and marker of lymphatic valve endothelial identity (Geng et al., 2017; Koltowska et al., 2013). Therefore, we investigated expression of gata2a, an ortholog of mammalian Gata2, in zebrafish embryos bearing a BAC GFP reporter (Traver et al., 2003). Between 2 and 3 dpf, the FLV is formed by sprouting and fusion of endothelial cells from the common cardinal vein (CCV) and those originating from the primary head sinus (PHS; Okuda et al., 2012). At 2 dpf, gata2a:gfp is not detected in these endothelial populations, but is apparent in non-vascular cells in the brain (Figure S2A). Beginning at 3 dpf, low levels of gata2a:gfp appeared in lyve1b:dsRed2-positive lymphatic endothelial cells immediately rostral to the FLV branchpoint (Figure S2A), where the valve eventually forms. By 4 dpf, we observed gata2a:gfp near the FLV branchpoint (Figure 3A) in a ring-like structure (Figure 3B), similar to early stages of mouse vein valvulogenesis (Bazigou et al., 2011). At this stage, GFP was selectively expressed in the developing valve and rostral regions of the FLV, but not in caudal regions or in the lateral facial lymphatic branch (LFL, Figure 3A, B). By 7 dpf, gata2a:gfp- positive endothelial cells that protrude into the lumen and exhibit leaflet-like morphology became evident (Figure 3C, D, yellow arrows), consistent with EM observations (see above). At 14 dpf, GFP-positive endothelial cells exhibited bicuspid valve morphology, with the nuclei of each leaflet at the distal ends (Figure 3E, F), similar to the structure seen in 3D SEM reconstructions (Video S4; see Figure 5E). By this stage, gata2a:gfp was expressed at much higher levels in valve leaflet endothelial cells, where lyve1b:dsred2 appeared to be lower, compared to surrounding non-valve lymphatic endothelial cells (Figure 3F). We also noted gata2a:gfp in endothelial cells at a junction between the PHS and FLV (arrowheads in Figure 3A, C, G). This junction point suggests a direct connection between the circulatory and lymphatic systems where we would expect a lymphovenous valve. Indeed, we observed evidence of leaflet-like morphology in endothelial cells at this junction (Figure 3H–J). Accordingly, analysis by EM suggested the presence of a bicuspid valve between the junction of the PHS and FLV at 4 dpf (Figure 3K). Together with the results above, these observations show that the rostral compartment of the zebrafish larval FLV is connected directly to the circulatory system by a lymphovenous valve. Furthermore, this compartment is associated with mural-like cells and is functionally separated from the remainder of the FLV by a bicuspid valve. Therefore, we propose that this structure be referred to as the facial collecting lymphatic vessel (FCLV), while the parallel vessel caudal to the lymphatic valve continue to be referred to as the FLV.
Figure 3. Live imaging of gata2a:gfp expression in the developing lymphatic valve.
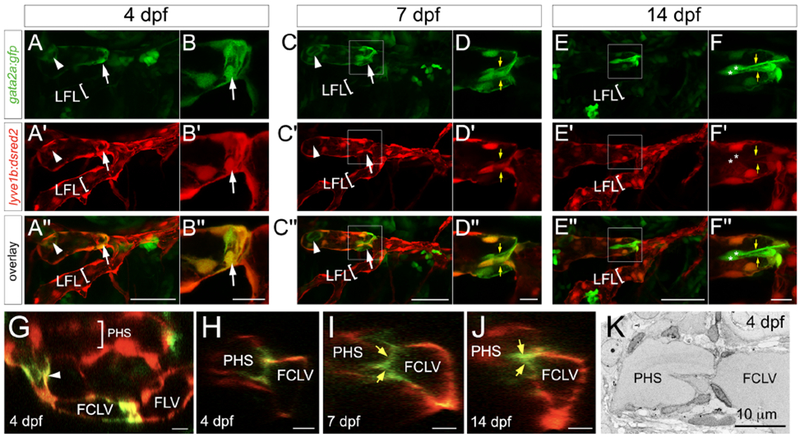
(A-J) Confocal micrographs of TgBAC(gata2a:gfp)la3;(lyve1b:dsred2)nz101 larvae at indicated stages. White arrowheads denote lymphovenous valve, arrows indicate developing lymphatic valve. Yellow arrows denote valve leaflets. (A-F) Lateral views, anterior to the left, dorsal is up. Images in A and B are not from same embryo. (G) Dorsal view, anterior to the left, medial is up. (H-J) Frontal view, medial to the left, dorsal is up. (A, C, E) Scale bar = 50 μm. (B, D, F-J) Scale bar = 10 μm. (C) White box indicates region in (D). (E) White box indicates region in (F). (K) SEM of lymphovenous valve at 4 dpf. Scale bar = 10 μm. LFL – lateral facial lymphatic, FCLV – facial collecting lymphatic vessel, FLV – facial lymphatic vessel, PHS – primary head sinus.
Along with Gata2, a number of other transcription factors are expressed in mammalian lymphatic valve endothelial cells, including Prox1, Nfatc1, and the forkhead factors Foxc1 and Foxc2 (Fatima et al., 2016; Geng et al., 2017; Koltowska et al., 2013). Prox1 immunostaining revealed widespread expression in zebrafish facial lymphatic endothelial cells, including presumptive valve cells, at 3 and 4 dpf (Figure S2B). High levels of Prox1 were maintained in lymphatic valve endothelial cells at 7 dpf and also persisted in most FLV endothelial cells (Figure S2B). Using an nfatc1:gal4ff BAC transgene (Pestel et al., 2016), we observed UAS-driven Kaede, a green fluorescent protein, at 2 dpf in the facial lymphatic sprout (FLS), which comprises progenitors that will contribute to the FLV (Okuda et al., 2012), along with progenitors originating from the posterior, but not anterior, regions of the PHS (Figure S3A and see below). By 3 and 4 dpf, Kaede is detectable in most facial lymphatic endothelial cells, including those in the nascent valve and the FCLV (Figure S3B, C). By 7 dpf, we observe Kaede in cells immediately adjacent to the developing valve, but expression is not as prominent in leaflet cells as that seen in TgBAC(gata2a:gfp)la3 larvae (compare Figure S3D to Figure 3E, F). Interestingly, we did not observe Kaede in trunk lymphatic endothelial cells at these stages (Figure S3A–D), suggesting that their identity is distinct from those in the facial lymphatic system.
While both Foxc1 and Foxc2 play roles in lymphatic valve morphogenesis in mouse development (Fatima et al., 2016), zebrafish lack an obvious Foxc2 ortholog. Nonetheless, we find that foxc1a is enriched in gata2a:gfp;lyve1b:dsred2-positive cells isolated by FACS from transgenic embryos, similar to gata2a itself (Figure S3E). Together, these observations demonstrate that zebrafish facial lymphatic endothelial cells, including those in the developing valve, express known determinants of lymphatic valve morphogenesis identified in mammals.
Embryonic origins of lymphatic valve endothelial cells.
The zebrafish FLV initially develops from 3 anatomically distinct endothelial populations. Proxl-positive cells emerge from the venous PHS as separate anterior and posterior clusters of lymphatic progenitors (referred to as PHS-LPA and PHS-LPP), and the FLS, which sprouts from the CCV (Okuda et al., 2012). These populations join to form the FLV, while a fourth population originating near the ventral aorta (VA-L) later contributes to the extending LFL (Eng et al., 2019). Given the close proximity of the PHS and the developing FLV, imaging the distinct endothelial cell populations in this region is challenging with available transgenic lines. Therefore, we sought to develop transgenic lines for easier visualization and tracking of valve progenitor cells. For this purpose, we utilized an enhancer element located in intron 4 of gata2a. Using previously generated ATAC-Seq datasets for endothelial and neural crest cells (Quillien et al., 2017; Trinh et al., 2017), we observed preferentially open chromatin in endothelial cells in this region (Figure 4A). Within this sequence we noted a conserved core element comprising Gata2, Nfatc1 and Ets binding sites (Figure 4A). Fragments bearing the homologous mammalian element can drive endothelial expression in mice (Khandekar et al., 2007), while deletions in the human enhancer are associated with lymphedema (Johnson et al., 2012). Using a fragment with 6 copies of this endothelial core element (gata2aECE), we generated transgenic lines expressing EGFP, a nuclear-localized form of super-folder GFP (nsfGFP), or the photoconvertible Kaede protein (Figure 4A). All lines exhibited consistent expression in the PHS-LPA, PHS-LPp and FLS, as well as the VA-L, at 2 dpf and in lymphatic valve endothelial cells at 7 and 14 dpf (Figure 4B, Figure S4, Video S5). We also noted earlier expression in blood vascular endothelial cells, which became reduced as development progressed (Figure S4). Thus, gata2aECE-driven transgenes should allow straightforward imaging of the FLV progenitors.
Figure 4. Visualizing the origin of lymphatic valve endothelial progenitors.
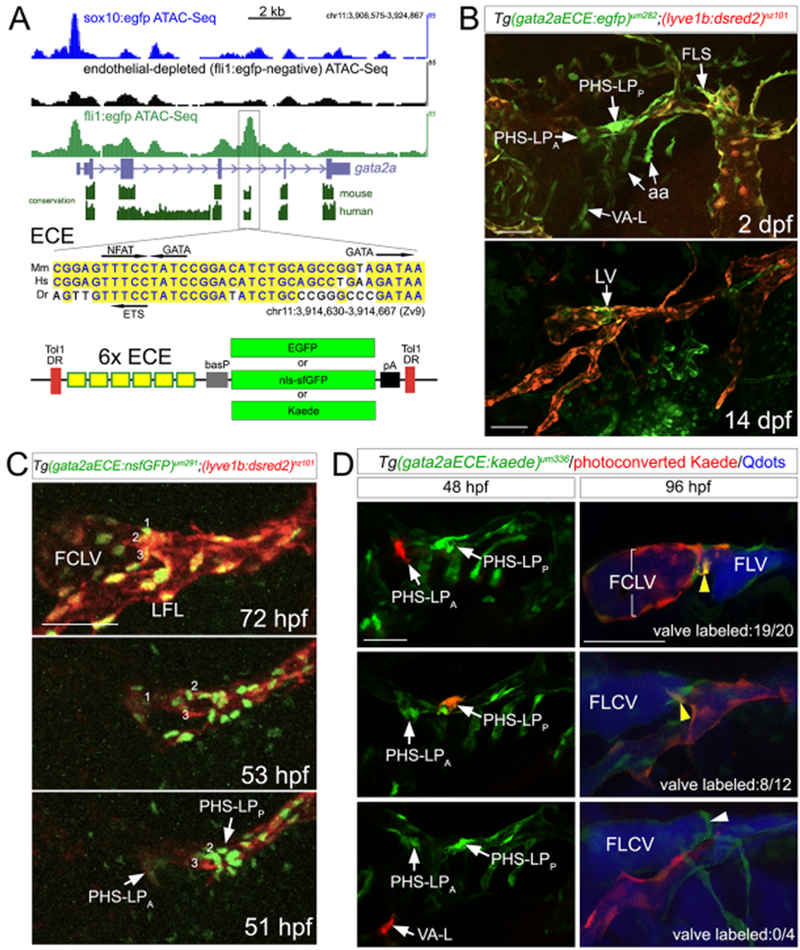
(A) Top, gata2a locus with conservation and published ATAC-Seq tracks from indicated cell types. Boxed area indicates location of endothelial core enhancer (ECE). Middle, ECE sequence conservation between zebrafish (Dr), mouse (Mm), and human (Hs). Transcription factor sites are indicated. Bottom, schematic of Tol1 constructs with indicated transgenes.
(B) Confocal micrographs of embryo at 2 dpf or larva at 14 dpf expressing indicated transgenes.
(C) Confocal micrographs at indicated time points from time-lapse analysis of Tg(gata2aECE:nsfGFP)um291;(lyve1b:dsred2)nz101 embryos. Lineage-traced cells indicated by numbers.
(D) Confocal micrographs of Tg(gata2aECE:kaede)um336 embryos. Left, embryos at 48 hpf imaged immediately after photoconversion (red cells). Right, matching embryos at 96 hpf following lymphangiography with QDots (blue). Arrowheads on panels at right denote presumptive lymphatic valve endothelial cells. Yellow arrowheads indicate cells expressing both photoconverted and native Kaede contributing to the lymphatic valve. Bottom right, white arrowhead denotes valve, but cells are only expressing the native green Kaede. n=number of embryos with yellow cells in valve versus all analyzed in each class.
(B-D) Lateral views, anterior to the left, dorsal is up. aa – aortic arch vessels, FCLV – facial collecting lymphatic vessel, FLS – facial lymphatic sprout, LFL – lateral facial lymphatic, LV-lymphatic valve, PHS-LPA – anterior primary head sinus derived lymphatic progenitor, PHS-LPP – posterior primary head sinus derived lymphatic progenitor, VA-L – ventrally derived anterior lymphatic progenitor. Scale bars = 50 μm.
To identify the origins of lymphatic valve endothelial cells, we performed confocal time lapse analysis on Tg(gata2aECE:nsfGFP)um291;(lyve1b:dsred2)nz101 embryos beginning at 51 hours post fertilization (hpf, Figure 4C, Video S6). By 72 hpf, we noted condensation of cells within the developing lymphatic valve (cells numbered in Figure 4C). Observation and tracing of selected single cells within this region from 72 hpf back to 51 hpf suggested that lymphatic valve endothelial cells derived from both the PHS-LPA and PHS-LPP populations (Figure 4C, Video S6). Similar behavior was observed in three separate embryos (data not shown). To confirm that cells from these populations contributed to the lymphatic valve, we utilized Tg(gata2aECE:kaede)um336 embryos, which show early Kaede expression in progenitor cells at 48 hpf that becomes progressively restricted to valve endothelial cells beginning at 4 dpf (Figure S4). This pattern permits early photoconversion in facial lymphatic progenitor cells (to give red fluorescence) with subsequent visualization of lymphatic valve endothelial cells by virtue of continued native Kaede expression (green fluorescence) and their anatomical position. Thus, Kaede-positive cells subjected to photoconversion that subsequently contribute to the lymphatic valve will appear as yellow. At 48 hpf, we selectively illuminated Kaede-positive cells in the PHS-LPA, PHS-LPp, or the VA-L with a UV laser, followed by confocal imaging to confirm Kaede photoconversion (Figure 4D). By 96 hpf, embryos in which cells from the PHS-LPA were photoconverted exhibited red fluorescence that was restricted to the FCLV and the nascent lymphatic valve in nearly every case (20 out of 20 embryos showing contribution to FCLV; 19 out of 20 to lymphatic valve), with less frequent contribution to the FLV (8 out of 20 embryos; Figure 4D, top). Photoconverted PHS-LPP cells in all embryos contributed to the FLV, but much less so to the FCLV (3 out of 12), although most embryos exhibited contribution to lymphatic valve endothelial cells (8 out of 12 embryos; Figure 4D, middle). By contrast, cells from the VA-L only contributed to the LFL and photoconverted cells were not observed in the FCLV, FLV, or lymphatic valve (Figure 4D, bottom). Thus, lymphatic valve endothelial cells derive from anatomically restricted populations of progenitor cells that initially arise from the venous PHS.
Integrin alpha 9 is required for lymphatic valve formation and function in zebrafish larvae
Our EM analysis suggested evidence for attachment of zebrafish lymphatic valve cells to an ECM core (see Figure 2E–G). A protein implicated in this process is Integrin alpha 9 (Itga9), which is required for lymphatic valve development in mouse (Bazigou et al., 2009; Huang et al., 2000). To investigate the requirement of itga9 for zebrafish lymphatic valve morphogenesis we first verified its expression in gata2a:gfp;lyve1b:dsred2-positive cells isolated by FACS (Figure S3E). We then generated zebrafish bearing a 7 nucleotide insertion in exon 1 that introduces a frame-shift immediately after the presumptive start codon, which would truncate Itga9 protein (itga9um228; Figure S5A). However, itga9um228 mutant embryos were normal and viable (data not shown), consistent with previous studies using a similar allele (Karpanen et al., 2017). Since exons 2 and 3 of itga9 encode in-frame methionines that could serve as alternative start codons (data not shown), we generated additional itga9 alleles: itga9um267, which removed all internal exons, itga9um316, which eliminates exons 20 to 25 encoding the transmembrane (TM) and cytoplasmic (Cyt) domains, and itga9um340, which is a microdeletion leading to a frameshift in exon 20 (Figure S5A). The latter two alleles truncate the protein prior to the TM. Embryos mutant for itga9um267 exhibited partially penetrant edema near the gut and eyes beginning at 7 dpf (Figure 5A, Figure S5B), despite normal patterning of facial and trunk lymphatic vessels (Figure 5B, C). Itga9um267 mutants appeared otherwise normal and inflated their swim bladders by 5 dpf (Figure 5A, data not shown). We did not note any defects in patterning or function of the cranial vasculature in itga9um267 mutant embryos, as indicated by angiography and quantification of vascular volume (Figure S5C). Importantly, itga9um267/um316 and itga9um267/um340 trans-heterozygous embryos, as well as embryos mutant for itga9um340, exhibited edema of similar characteristics and penetrance, but were otherwise normal (Figure S5B, D), suggesting that the defects in itga9um267 mutant embryos are specifically due to loss of itga9.
Further analysis of itga9um267 mutants suggested that lymphatic valve endothelial cells are normally specified, as indicated by gata2a:gfp expression (Figure 5B). However, EM revealed disorganized leaflet structure when compared to wild type siblings (Figure 5D). As noted above, 3D SEM reconstruction of lymphatic valve structure in a wild type sibling showed two well-formed leaflets, each consisting of three cells, with a partial opening (Figure 5E, Video S4). By contrast, reconstruction of an itga9um267 mutant lymphatic valve revealed endothelial cells that failed to organize into two distinct leaflets, while cell bodies spanned the lumen, with no obvious opening (Figure 5E, Video S7). This suggested that efficient flow through the FLV into the circulatory system may be compromised in itga9 mutants, leading to the observed edema. To investigate this possibility, we injected Qdots into the FLV of wild type or itga9um267 mutant siblings, then allowed them to recover for 30 minutes without Tricaine prior to imaging. In wild type larvae with fully perfused FLVs at 5 minutes post injection, we observed subsequent drainage of Qdots into the circulatory system after 30 minutes, as indicated by robust fluorescence in the aortic arch blood vessels (Figure 5F; n=6 out of 7). By contrast, we consistently failed to observe fluorescence from Qdots in the aortic arch vasculature of itga9um267 mutants (Figure 5F, n=5 out of 6), suggesting inefficient drainage from the FLVs into the circulatory system. Taken together, these results suggest that itga9 is required for proper lymphatic valve morphogenesis and lymphatic function in zebrafish larvae.
gata2a is required for lymphatic valve formation and function
In mouse and humans, Gata2 is a central regulator of lymphatic valve development (Kazenwadel et al., 2015; Kazenwadel et al., 2012). To determine if this was the case in zebrafish, we used embryos mutant for gata2aum27, in which a microdeletion leads to truncation of the protein prior to the essential zinc finger domains required for transcriptional activity (Supplementary Supplementary Table S1). Our previous characterization of gata2aum27 mutants revealed a failure of trunk blood flow, but relatively normal cranial circulation (Zhu et al., 2011). However, in the generation of gata2aum27 mutants used for the current study, this circulatory defect was partially penetrant (not shown). Furthermore, hey2um216 mutants, which display a fully penetrant loss of trunk circulation, do not exhibit edema and develop relatively normal lymphatic valve leaflets (Supplementary Table S1, Figure S6A, and data not shown). Nonetheless, we focused our analyses only on gata2aum27 mutant larvae with normal trunk circulation, which also displayed relatively normal patterning and function of cranial blood vessels (Figure S6B). Despite their normal circulatory function, gata2aum27 mutant larvae exhibited partially penetrant edema associated with the gut and eye at 7 dpf (Figure 6A, B). gata2aum27 mutants also fail to inflate their swim bladder and are not viable past late larval stages (Figure 6A, data not shown). Analysis by SEM showed lymphatic valve endothelial cells with cuboidal morphology, but no evidence of flattening or extension into the lumen as in wild type larvae at 4 dpf (Figure 6C, Video S8). By 6 dpf, gata2aum27 mutant valves exhibited a disorganized appearance similar to itga9um267 mutants (Figure 6C, compare to Figures 2B and 5D).
Figure 6. gata2a is required for lymphatic valve development.
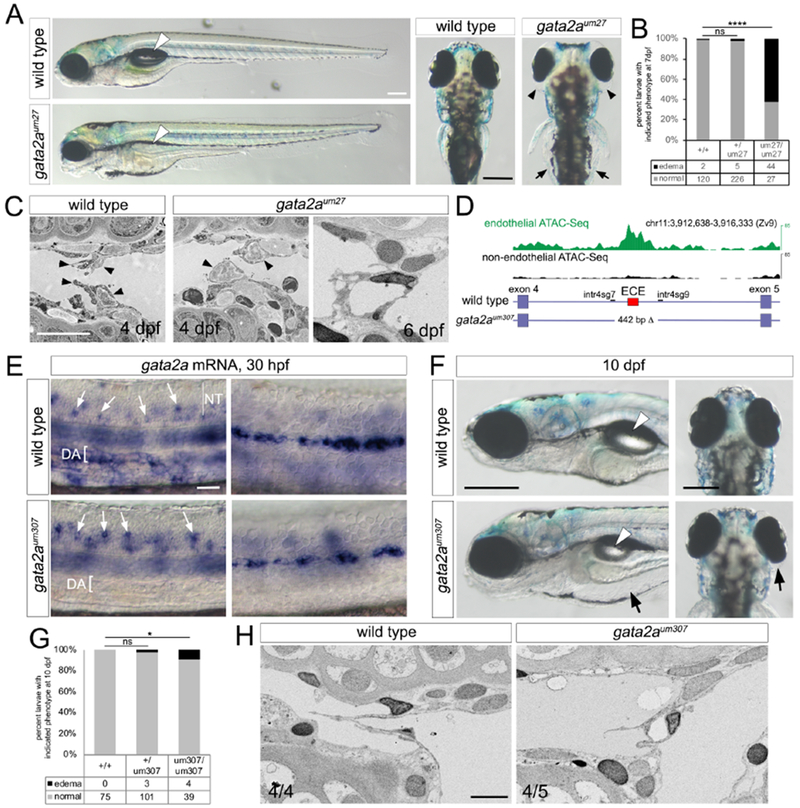
(A) Transmitted light images of larvae of indicated genotype at 7 dpf., Left panels, lateral view, anterior to the left, dorsal is up; white arrowhead denotes swim bladder. Right panels, anterior is up; black arrowheads denote ocular edema, arrows show gut edema. Scale bars = 250 μm.
(B, G) Penetrance of edema at (B) 7 dpf or (G) 10 dpf in larvae of indicated genotype; numbers of analyzed embryos are indicated. Fisher’s Exact test, * p<0.05, **** p<0.0001.
(C) SEM of FLVs at 4 and 6 dpf in larvae of indicated genotype. Arrowheads denote lymphatic valve endothelial cells. We refer readers to Figure 2B for comparison of 6 dpf mutant to wild type at a comparable stage. Scale bar = 10 μm.
(D) Schematic of gata2a locus showing ECE (red box) and gata2aum307 deletion, along with endothelial and non-endothelial ATAC-Seq mapped read density. Locations of Cas9 sgRNAs (intr4sg7, intr4sg9) are indicated.
(E) Whole mount in situ hybridization with gata2a riboprobe at 30 hpf in embryos of indicated genotype. Left and right panels are different focal planes of the same embryo. DA – dorsal aorta, NT – neural tube. Arrows indicate spinal neurons. Scale bar = 50 μm.
(F) Transmitted light images of larvae of indicated genotype at 10 dpf. Arrowheads denote inflated swim bladder, arrows indicate edema. Left panels, lateral view, anterior to the left, dorsal is up; right panels, anterior is up. Scale bars = 250 μm
(H) SEM micrographs of lymphatic valve in larvae of indicated genotype at 7 dpf. Scale bar = 5 μm. n=number of embryos with indicated phenotype/total number analyzed in each class.
In an effort to determine if lymphatic valve defects were due to an endothelial autonomous requirement for gata2a, we generated zebrafish bearing a deletion (gata2aum307; Supplementary Table S1) of the conserved intron 4 enhancer described above (see Figure 4A, Figure 6D). In situ hybridization analysis revealed loss of gata2a transcript in dorsal aorta endothelial cells in gata2aum307 mutant embryos, while expression in spinal neurons and lateral line primordium persisted (Figure 6E). Analysis of the exon 4/5 junction in gata2a transcript from gata2aum307 mutants demonstrated that this deletion did not affect splicing (Figure S6C, D). Similar to gata2aum27 mutants, we observed edema associated with the eyes and gut in gata2aum307 mutant embryos, albeit at lower penetrance (Figure 6F, G). Furthermore, gata2aum307 mutants showed poorly formed lymphatic valve leaflets without a clear opening (n=4 out of 4) compared to wild type siblings (n=4 out of 5) at 7 dpf (Figure 6H, Video S9). Together, these results suggest that gata2a is required in endothelial cells for normal lymphatic valve development in zebrafish.
A conserved network of transcription factors governs lymphatic endothelial valve specification and morphogenesis upstream of gata2a
During mouse lymphatic valve development, Gata2 is thought to act upstream of several transcription factors, including Prox1, Nfatc1, and Foxc2 (Geng et al., 2017). Furthermore, we find that orthologs of Prox1 and Nfatc1 are expressed in lymphatic valve endothelial cells or their progenitors in zebrafish larvae, together with foxc1a (see above). Therefore, we determined if these genes were likewise required for zebrafish lymphatic valve development. Previous studies have noted edema but normal lymphatic vessel patterning in prox1ai278 mutants, which bear a 10 bp deletion in exon 1 that causes a frameshift and premature truncation of the protein, (van Impel et al., 2014); Supplementary Table S1), similar to our observations (Figure 7A, B, E, data not shown). We likewise observe edema with normal lymphatic vessel patterning in larvae mutant for nfatc1um264, which bear a 5 bp deletion causing frameshift at amino acid 6 and expected truncation of the protein (Supplementary Table S1, Figure 7C–E). Both prox1a and nfatc1 mutants exhibit relatively normal circulatory function with only a mild decrease in vascular volume in the cranial vessels (Figure S7A, B). By contrast, embryos bearing a nonsense mutation in foxc1a that causes a premature truncation within the Forkhead domain (foxc1ap162) display severe pericardial edema and near complete loss of circulatory function by 48 hpf (Yue et al., 2018), likely due to an early failure to connect the outflow tract to the first aortic arch (Figure S7C–E). These early and severe circulatory defects preclude a straightforward analysis of lymphatic valve development. Therefore, we used a low dose injection of foxc1a mRNA to limit rescue to the early cardiovascular defects. Rescued foxc1ap162 mutant embryos showed increased penetrance of circulation and milder cardiac edema, although cranial vascular volume was lower (Figure S7C, D, F). Following early rescue, foxc1ap162 mutant larvae with normal circulation displayed gut and ocular edema by 6 dpf (Figure S7G, H) with normal FLV patterning at 4 dpf (Figure 7E). We further find that gata2a:gfp fails to be induced in presumptive lymphatic valve endothelial cells in embryos mutant for prox1ai278, nfatc1um264, or foxc1ap162 (early rescue) as early as 4 dpf (Figure 7E), suggesting a defect in specification. EM analysis in these mutants shows that lymphatic endothelial cells retained an epithelial morphology and failed to extend into the lumen at 4 dpf at the normal site of valve formation (Figure 7F; Videos S10–12). Thus, these transcription factors likely play a conserved role in lymphatic valve specification and morphogenesis in the zebrafish.
Figure 7. Conserved transcription factors are required for zebrafish lymphatic development.
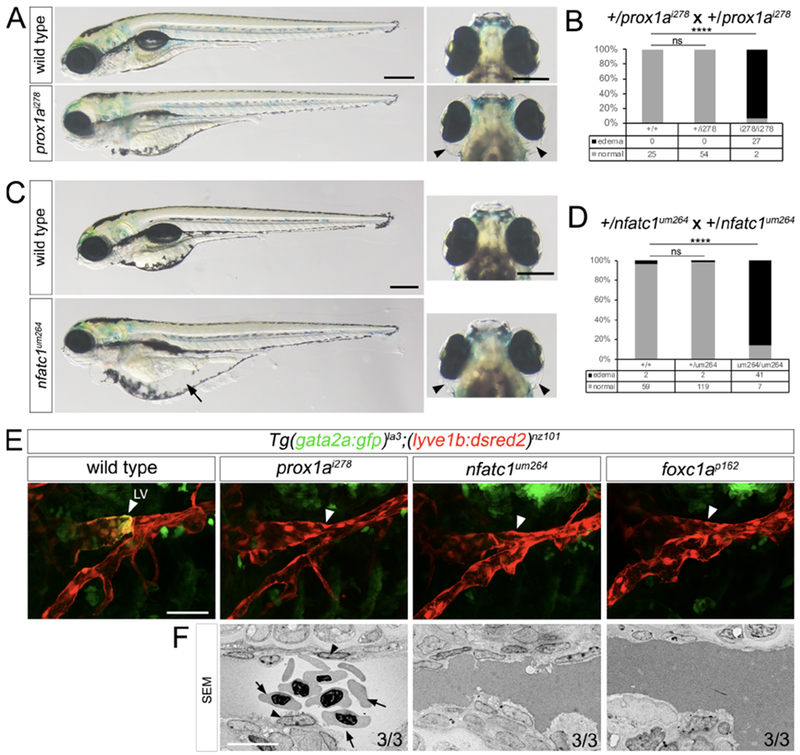
(A, C) Transmitted light images of larvae of indicated genotype at 5 dpf. Arrowheads and arrow show ocular and gut edema, respectively. Left panels, lateral views, dorsal is up anterior to the left. Right panels, dorsal views, anterior is up. Scale bars = 250 μm.
(B, D) Penetrance of edema at (B) 6 dpf and (D) 5 dpf in larvae of indicated genotype; numbers of embryos used for analysis are indicated. Fisher’s exact test, **** p<0.0001; ns = not statistically significant.
(E) Confocal micrographs of FLVs in Tg(gata2a:gfp)la3;(lyve1b:dsred2)nz101 larvae of indicated genotype at 4 dpf. White arrowheads indicate gata2a:gfp expression in lymphatic valve (LV) endothelial cells, or lack thereof. Scale bar = 50 μm.
(F) SEM of FLVs at 4 dpf in larvae of indicated genotype. Arrowhead denotes lymphatic valve endothelial cells. Arrows show red blood cells in FLV of prox1ai278 mutant. Scale bar = 10 μm. n=number of embryos with indicated phenotype/total analyzed in each class.
Discussion
In 1769, Hewson and Hunter provided a description of the lymphatic system in fishes, but failed to detect evidence for valves (Hewson and Hunter, 1769). Since that time, a general consensus emerged that lymphatic valves do not exist in fish. Consequently, these structures have gone unnoticed despite the increasing popularity of the zebrafish as a model organism for the study of lymphatic development (Koltowska et al., 2013). Here, we provide compelling evidence for the existence and function of lymphatic valves in zebrafish. Moreover, our finding of similar structures in Medaka larvae suggests that valves are likely a conserved feature of the teleost lymphatic system. Interestingly, using gata2a:gfp as a definitive marker for lymphatic valve endothelial cells, we only detect a single valve on each side of the FLV at early larval stages and no evidence for these structures in trunk lymphatic vessels. We have previously found that the entire trunk lymphatic system is dispensable for fluid homeostasis during larval stages (Shin et al., 2016b). Thus, it may be that there has not been evolutionary pressure for valves to develop in this anatomical location at these early stages. The low number of lymphatic valves may reflect a limited functional need due to the small size of the zebrafish larva at this stage. Indeed, valves are found at 1-2 mm intervals in adult human facial lymphatic collecting vessels (Pan et al., 2010), while the entire length of a 5 dpf zebrafish larvae is about 4 mm. Preliminary observations using the gata2a:gfp marker suggest that valves may be more numerous in the adult lymphatic system (data not shown). However, more rigorous analysis of these later stages is necessary before making a more definitive statement in this regard. Nonetheless, based on the previous success of the zebrafish as a model to investigate other aspects of lymphatic development, we believe that our studies will set the stage for its use to make future discoveries concerning lymphatic valve morphogenesis.
A major benefit to using the zebrafish to study lymphatic vessel development has been the ability to apply serial observations of live embryos, including application of time-lapse analysis. Such approaches provided the first definitive demonstration in vertebrates that lymphatic cells derive from venous progenitors and revealed lymphatic progenitor populations (Nicenboim et al., 2015; Yaniv et al., 2006). Here, we have applied time lapse analysis, along with lineage tracing using a photoconvertible protein, to identify the origins of lymphatic valve endothelial cells. We find that lymphatic valve endothelial cells derive from two separate populations that originate in the PHS and are known to contribute generally to the FLV (Okuda et al., 2012). Our lineage tracing studies suggest some degree of bias in these progenitor populations, with the anterior cell descendants largely restricted to the FCLV and posterior progenitors contributing more to caudal regions, while cells from both of these populations can contribute to the valve. Interestingly, these anatomical biases are reflected by expression of marker transgenes: gata2a:gfp is restricted to the FCLV, while nfatc1:gal4ff initiates only in posterior progenitors, before expanding to include most FLV endothelial cells. These observations suggest the existence of lymphatic endothelial cells with distinct identities, which may be governed by different genetic pathways. Alternatively, the expression differences may reflect differential responses to flow in the FCLV and FLV. In cardiac and lymphatic valves, expression patterns in endothelial cells up and downstream of the valve proper are distinct, owing to different flow characteristics in these locations (Geng et al., 2017). Given the known responsiveness of Gata2 to oscillatory shear stress (OSS; Janardhan et al., 2017; Kazenwadel et al., 2015), the observed differences in transgene expression may thus reflect incorporation of physiological cues. In any event, future studies will be required to determine if anatomical lineage-restriction represents a hard-wired genetic pathway and whether or how physiological cues can influence this process.
In mouse, Gata2 is thought to act upstream of Foxc2, Prox1, and Nfatc1 to drive lymphatic valve formation (Geng et al., 2017; Kazenwadel et al., 2015). Indeed, both Prox1 and Foxc2 are direct targets of Gata2 and their expression is reduced by loss of Gata2 in human and mouse lymphatic endothelial cells (Kazenwadel et al., 2015). Thus, it is somewhat surprising that we find gata2a:gfp expression to be extinguished in the presumptive lymphatic valve endothelial cells of zebrafish embryos mutant for prox1a, foxc1a, or nfatc1. Moreover, the severity of lymphatic valve defects in gata2a mutant embryos appears milder than those associated with loss of prox1a, foxc1a, or nfatc1. Together, these observations would be consistent with gata2a being downstream, rather than upstream, of these factors. Interestingly, an assessment of Gata2 expression in comparable mouse models is currently lacking, raising the possibility that our findings reveal a more complex interaction between these transcription factors during lymphatic valve development than previously considered. Our results would still be consistent with current models since Gata2 does not appear to be required for more general lymphatic endothelial expression of Prox1, Foxc2 or Nfatc1 at early stages. Instead, Gata2 may only act upstream of these factors in the context of initiating a valve endothelial cell program. Our findings in zebrafish would be consistent with this model, as we observe both Prox1 and nfatc1:gal4ff expression more broadly than, and preceding, gata2a:gfp expression. Our observations suggest that Gata2 expression may require components of a general lymphatic endothelial program for its initial expression or maintenance. The additional trigger for initiating its expression may be lymphatic flow, since, as noted above, Gata2 expression is responsive to OSS in lymphatic endothelial cell cultures. In any event, our genetic analysis in zebrafish suggests a more complex degree of regulation between these transcription factors than was previously appreciated. It will be of interest to determine if these findings will be similar in mice lacking Prox1, Nfatc1, or Foxc1/2.
In just the past decade, the zebrafish has become a valuable model to study lymphatic development. Its use in this regard has led to the discovery of mechanisms important for lymphatic specification and patterning, as well as identification of candidate genes responsible for human lymphedema syndromes (Koltowska et al., 2013). Based on these precedents, we believe that the work presented here will provide an important foundation from which to launch future studies to identify and dissect genetic pathways essential for lymphatic valve formation. Such studies will require new tools and resources to permit direct visualization of lymphatic valve endothelial cells and to better characterize their molecular identity. Such efforts will likely aid in establishing the zebrafish as a powerful model for investigating lymphatic valve development.
STAR METHODS
LEAD CONTACT AND MATERIALS AVAILABILITY
Further information and requests for reagents and resources should be directed to and will be fulfilled by the Lead Contact, Nathan D. Lawson (nathan.lawson@umassmed.edu).
EXPERIMENTAL MODEL AND SUBJECT DETAILS
Zebrafish and maintenance
Zebrafish were handled according to approved University of Massachusetts Medical School Institutional Animal Care and Use Committee protocols. Mutant and transgenic lines used in this study are listed in the Key Resources Table. Generation of new alleles is described below. The TgBAC(dab2:egfp)ncv67Tg transgenic line was generated using BAC CH211–273H19 (BACPAC Resources, Oakland, CA) according to standard methods (Bussmann and Schulte-Merker, 2011).
KEY RESOURCES TABLE
| REAGENT or RESOURCE | SOURCE | IDENTIFIER |
|---|---|---|
| Antibodies | ||
| Anti-Prox1 | AngioBio | 11-002P |
| Anti-mCherry | GeneTex 8 | GTX12850 |
| Donkey Anti-Rabbit IgG-HRP | Abcam | ab6802 |
| Goat Anti-Rabbit IgG-HRP | Abcam | ab6721 |
| Chemicals, Peptides, and Recombinant Proteins | ||
| Qtracker 655 Vascular Labels | ThermoFisher | Q21021MP |
| Qtracker 705 Vascular Labels | ThermoFisher | Q21061MP |
| Critical Commercial Assays | ||
| TSA Plus Fluorescein System | PerkinElmer | NEL741001KT |
| TSA Cy3 Fluorescein System | PerkinElmer | NEL744001KT |
| KASP Master Mix (High ROX) | LGC Group | KBS-1016-022 |
| PACE genotyping Master Mix (High ROX) | 3Cr Bioscience | 001-0010 |
| Experimental Models: Organisms/Strains | ||
| Zebrafish: TgBAC(dab2:egfp)ncv67 | this study | ncv67Tg |
| Zebrafish: hey2um216 | this study | um216 |
| Zebrafish: itga9um228 | this study | um228 |
| Zebrafish: nfatc1um246 | this study | um246 |
| Zebrafish: itga9um267 | this study | um267 |
| Zebrafish: Tg(gata2ECE:egfp)um282 | this study | um282 |
| Zebrafish: Tg(gata2ECE:nsfGFP)um291 | this study | um291 |
| Zebrafish: gata2aum307 | this study | um307 |
| Zebrafish: itga9um316 | this study | um316 |
| Zebrafish: Tg(gata2ECE:kaede)um336 | this study | um336 |
| Zebrafish: itga9um340 | this study | um340 |
| Zebrafish: Tg(UAS:kaede)rk8Tg | (Hatta et al., 2006) | ZDB-ALT-040913-6 |
| Zebrafish: TgBAC(gata2a:gfp)la3 | (Traver et al., 2003) | ZDB-ALT-051223-2 |
| Zebrafish: Tg(kdrl:egfp)la116 | (Choi et al., 2007) | ZDB-ALT-070529-1 |
| Zebrafish: Tg(UAS:egfp)nkuasgfp1aTg | (Asakawa et al., 2008) | ZDB-ALT-080528-1 |
| Zebrafish: Tg(UAS:rfp)nkuasrfp1aTg | (Asakawa et al., 2008) | ZDB-ALT-080528-1 |
| Zebrafish: gata2aum27 | (Zhu et al., 2011) | ZDB-ALT-111201-1 |
| Zebrafish: Tg(acta2:mcherry)ca8 | (Whitesell et al., 2014) | ZDB-ALT-120508-2 |
| Zebrafish: Tg(lyve1b:dsred2)nz101 | (Okuda et al., 2012) | ZDB-ALT-120723-3 |
| Zebrafish: prox1ai278 | (van Impel et al., 2014) | ZDB-ALT-140522-1 |
| Zebrafish: foxc1ap162 | (Banerjee et al., 2015) | ZDB-ALT-140721-2 |
| Zebrafish: TgBAC(pdgfrb:gal4ff)ncv24 | (Ando et al., 2016) | ZDB-ALT-160609-3 |
| Zebrafish: TgBAC(nfatc1:gal4ff)mu286 | (Pestel et al., 2016) | ZDB-ALT-181212-6 |
| Oligonucleotides | ||
| see Table S2 | ||
| Recombinant DNA | ||
| Plasmid: p5E-6xgata2aECEbasp | this study | |
| Plasmid: p5E-6xgata2aECE | this study | |
| Plasmid: pCS-foxc1a-2a-tdTomato | this study | |
| Plasmid: pME-foxc1a | this study | |
| Plasmid: pME-Kaede | this study | |
| Plasmid: pME-nls-sfGFP | this study | |
| Plasmid: pTone-gata2aECE-EGFP | this study | |
| Plasmid: pTone-gata2aECE-nsGFP | this study | |
| Plasmid: pTone-gata2aECE-Kaede | this study | |
| Plasmid: pME-gata2a | this study | |
| Plasmid: pDR-nfatc1_sgRNA2 | this study | |
| Plasmid: pDR-itga9_sgRNA1 | this study | |
| Plasmid: pDR-itga9_sgRNA4 | this study | |
| Plasmid: pDR-itga9_sgRNA7 | this study | |
| Plasmid: pDR-gata2a_int4_sgRNA7 | this study | |
| Plasmid: pDR-hey2_sgRNA1 | this study | |
| Plasmid: pDR-gata2a_int4_sgRNA8 | this study | |
| Plasmid: pCS-nlstdTomato | this study | |
| Plasmid: pflk1 | (Lawson et al., 2001) | RRID:Addgene_13061 |
| Plasmid: pCSDest2 | (Villefranc et al., 2007) | RRID:Addgene_22424 |
| Plasmid: pENTRbasEGFP | (Villefranc et al., 2007) | RRID:Addgene_22453 |
| Plasmid: pDR274 | (Hwang et al., 2013) | RRID:Addgene_42250 |
| Plasmid: p3E-mcs1 | (Moore et al., 2013) | RRID:Addgene_49004 |
| Plasmid: pME-6MTnlstdTomato2A | (Shin et al., 2016a) | RRID:Addgene_67685 |
| Plasmid: pToneDest | (Shin et al., 2016b) | RRID:Addgene_67691 |
| Plasmid: pToneTP | (Shin et al., 2016b) | RRID:Addgene_67692 |
| Plasmid: p3E-2A-tdTomato | (Shin et al., 2016b) | RRID:Addgene_67707 |
| Plasmid: pMJ915 | (Lin et al., 2014) | RRID:Addgene_69090 |
| Software and Algorithms | ||
| NIH Image/FIJI | NIH | |
| Adobe Photoshop CS5, CS6, CC | Adobe | |
| Adobe Premiere CC | Adobe | |
| Imaris 9.1 | Bitplane | |
| ZEN2010 | Zeiss | |
| ZEN2011 | Zeiss | |
| MultiTime Series PLUS Macro | Zeiss | |
| QuickTimePro 7 | Apple | |
| 3D slicer | BWH Harvard Medical School | |
| Other | ||
| KASP genotyping – see Table S3 | ||
METHOD DETAILS
Plasmid construction
To generate a lymphatic valve enhancer construct, we synthesized a Q-Block DNA fragment (Quintara Biosciences) bearing 6 tandem copies of a 38 bp conserved element in gata2a intron 4 (chr11:3,914,630-3,914,667, danRer7/Zv9) with or without a carp beta-actin minimal promoter flanked by attB4 and attB1 recombination sites. These fragments were used in separate BP reaction with pDONR-P4P1R (Invitrogen) to generate p5E-gata2aECE and p5E-gata2aECE-basp, respectively. To construct a middle entry clone for Kaede, we synthesized a gBlock (Integrated DNA Technologies) bearing its coding sequence with a Kozak ATG and flanked by attB1 and attB2 sites. This fragment was used in a BP reaction with pDONR-221 to give pME-Kaede. For a nuclear-localized marker, we amplified a fragment containing superfolder GFP (sfGFP) using a forward primer bearing an attB1 site, a Kozak ATG, 6x myc epitope and SV40 nuclear localization signal (NLS), along with a reverse primer bearing an additional SV40 NLS followed by an attB2 site (see Supplementary Table S2 for primer sequences). The resulting PCR product was used in a BP reaction with pDONR-221 to give pME-6MT-nls-sfGFP (referred to in the text as “nsfGFP”). To generate an injection construct for expressing Kaede, we used pToneDest, p5E-gata2aECE-basp, pME-Kaede and p3E-MCS in an LR reaction to yield pTol1-gata2aECE-kaede. For expression of nls-sfGFP, we used pToneDest, p5E-gata2aECE-basp, pME-nsfGFP and p3E-MCS in an LR reaction to yield pTol1-gata2aECE-nsfGFP. To express EGFP, we used pToneDest, p5E-6xgata2aECe, pENTRbasGFP and p3E-mcs1 in an LR reaction to give pTol1-gata2aECE-EGFP. To generate pME-foxc1a, full-length of foxc1a cDNA without stop codon flanked by attB1 and attB2 was amplified from 24hpf cDNA and recombined into pDONR221 using BP clonase II (ThermoFisher). pME-foxc1a and p3E-2A-tdTomato were then recombined into pCSDest2 using LR clonase II (ThermoFisher) to generate pCS-foxc1a-2a-tdTomato. In parallel, pME-myc-nlstdTomato-2A and p3E-mcs1 were used in an LR reaction to generate pCS-nlstdTomato. To generate templates for cas9 sgRNAs, we annealed oligonucleotide pairs containing overhangs for BsaI (see Supplementary Table S2) and ligated them into BsaI site of pDR274 as previously described (Kok et al., 2015).
Knockout generation and genotyping
We generated zebrafish bearing mutations in gata2a, nfatc1, and itga9 using ribonucleoprotein complexes of purified S. pyogenes Cas9 complexed to appropriate sgRNAs. SpCas9–2xNLS protein was expressed from pMJ915 (Lin et al., 2014) in E. coli Rosetta (DE3) pLysS cells, and then purified following the published protocol (Anders et al., 2014). Briefly, cells were grown at 37°C to an OD600 of 0.4, then shifted to 18°C and i nduced for 16 hours with 1 mM IPTG. Following induction, cells were lysed and the protein purified through three chromatography steps: 1) Ni-NTA resin, 2) cation exchange chromatography (HiTrap-S) and 3) size-exclusion chromatography (Superdex-200). The SpCas9 fraction from the size exclusion column was buffer exchanged into 1x Phosphate Buffered Saline (PBS), concentrated to 24 μM and frozen at −80°C in small aliquots. Guide RNAs (sgRNAs) were synthesized as described elsewhere (Kok et al., 2015). Appropriate amount of sgRNA and purified Cas9 were incubated at room temperature for 20 minutes prior to injection. For itga9um267, we co-injected Cas9/sgRNA complexes at 16 fmole/25 pg per embryo against targets flanking the gene (itga9-sgRNA1 and 7). For nfatc1, 16 fmoles Cas9 protein with 20 pg of sgRNA targeting exon2 of the nfatc1 gene was injected per embryo. For gata2aum307, Cas9/sgRNA complexes at 8 fmoles/120 pg and 108pg of sgRNAs (intr4-sgRNA7 and 8, respectively) per embryo was co-injected against the inton4. For itga9um228, we co-injected 10 pg itga9-sgRNA1 and 50pg cas9 mRNA. For itga9um316 and itga9um340, we co-injected Cas9/sgRNA complexes at 16 fmoles/80 pg (sgRNA4) and 98 pg (sgRNA7) of sgRNAs per embryo against exon 20 and 25. For hey2um216, we injected 300 pg mRNA encoding Cas9 and 30 pg of hey2-sgRNA1. See Supplementary Table S1 for additional allele information. Spacer sequence of all sgRNAs, genotyping primers and restriction enzymes for indel detection are listed in Supplementary Tables 1 and 2. Identification and primary characterization of founders was handled as previously (Kok et al., 2015). After identification of founder alleles, we applied KASP genotyping for gata2aum27, gata2aum307, prox1ai278, foxc1ap162, nfatc1um264, itga9um267 and hey2um216 using a OneStep RealTime PCR machine (ThermoFisher) according to recommended guidelines (LGC group). Sequence information for ordering KASP assays are listed in Supplementary Table 3. PACE genotyping Mater Mix (3Cr Bioscience) was alternatively used for the KASP genotyping assay to itga9um267.
Injections
pCS-foxc1a-2a-tdTomato and pCS-nlstdTomato were linearized with NotI and used to synthesize mRNA using the mMESSAGE mMACHINE SP6 Transcription kit (ThermoFisher). To rescue early foxc1ap162 defects, 12.5 pg of mRNA encoding Foxc1a-2A-tdTomato or nlstdTomato was injected into 1-cell stage embryos from an incross of foxc1ap162 heterozygous parents bearing Tg(lyve1b:dsred2)nz101 and TgBAC(gata2a:gfp)la3. Embryos were separated at 2 dpf based on blood circulation and grown to 4 dpf. Only embryos without pericardial edema at 4 dpf were used for analysis by confocal or electron microscopy. To establish transgenic lines, we co-injected 25 pg pTol1-gata2aECE-Kaede, pTol1-gata2aECE-nsfGFP, or pTol1-gata2aECE-EGFP together with 50 pg of mRNA encoding Tol1 transposase into 1-cell stage zebrafish embryos.
Facial lymphatic perfusion
Microangiography was performed as previously (Shin et al., 2016b), except that Qtracker 655 Vascular Labels (Qdot655, ThermoFisher) were injected between the gill and pectoral fin into the facial lymphatic system of anesthetized TgBAC(dab2:egfp)ncv67Tg embryos. Embryos with successful and specific perfusion of the caudal region of the facial lymphatic vessel were identified using an MZFLIII fluorescence dissection microscope and imaged by confocal microscopy. After imaging, each embryo was given a unique identifier number and transferred into egg water in a single well of a 24-well plate with or without 2x Tricaine. After 30 minutes, the embryos were re-anesthetized and subjected to confocal microscopy.
Immunostaining and whole mount in situ hybridization
Tg(lyve1b:dsred2)nz101 at 3, 4 and 7dpf were fixed overnight with 8% paraformaldehyde in PBS at 4°C, treated with 3% H 2O2 in methanol for 30 minutes, then stored in 100% methanol at −20°C. Embryos were cut in half between the head and trunk to aid antibody penetration. For permeabilization, embryos were treated with H2O for 3 hours followed by PBS/0.1% Tween-20/1% TritonX-100 for 30 minutes. Subsequent immunostaining was performed as described elsewhere (Shin et al., 2016a; Shin et al., 2016b). 1/500 rabbit Anti-mCherry polyclonal antibody ( GeneTex) and 1/1000 goat or donkey anti rabbit IgG(H+L)-HRP were used for primary and secondary reaction, respectively. DsRed2 staining was enhanced by TSA Plus amplification kit (PerkinElmer) using tyramide-FITC. For antigen retrieval to detect Prox1, embryos were incubated in citrate buffer at 98°C for 20 minutes, treated with ProteinaseK at 30 μg/mL for 10 minutes and fixed with 8% paraformaldehyde in PBS for 45 minutes at room temperature. Subsequent handling was as previously described (Shin et al., 2016b). Whole mount in situ hybridization using antisense riboprobes labeled with digoxigenin (DIG) was performed as described elsewhere (Hauptmann and Gerster, 1994). A DIG-labeled kdrl riboprobe was synthesized using T7 RNA polymerase (Roche) and p-flk1 linearized with EcoRI as a template. A gata2a riboprobe was synthesized with T7 using a PCR-amplified fragment from pME-gata2a as a template.
Imaging
For time-lapse analysis, three embryos bearing Tg(gata2aECE:nls-sfGFP)um291;(lyve1b:dsred2)nz101 at 50hpf were embedded in 0.8% Low melt agarose/egg water with 1x Tricaine in a 35-mm coverslip dish. The dish was then mounted in a handmade recirculating chamber equipped with 2 separate Peri-Static Pumps (inlet and outlet; Cole-Parmer) based on a previously published design (Kamei and Weinstein, 2005). Imaging was performed on a Zeiss LSM 710NLO microscope using simultaneous excitation with 488 nm and 561 nm laser lines. The microscope and stage were housed in an Incubator XL 2000 Axio Imager DARK (PECON) and equipped with a TempModuleS Heating Unit set to 32°C to adjust embryonic development to normal as we noticed the development in our experimental setting was slightly delayed. Separate 400 mL Reservoir sbottle for inlet eggwater/1xTricaine and outlet collection were placed within the incubator. Laser power was minimized (4%, at 488nm; 4% at 561nm) to prevent photo-bleaching. Scan speed was set at 7, with 2 frame-averages and bidirectional scan at 8 Bit, 512 × 512 pixel. For each embryo, between 120 and 130 images were captured at 2pm intervals every 15min. To enable parallel multi-sample imaging (n=3), we used the Multi Time Series PLUS macro with ZEN 2010 software (Zeiss). To generate time-lapse movies, 4D .lsm files were opened using Imaris 9.1 (Bitplane), rotated as necessary and exported as an .avi file. To convert .avi formatted movies, they were imported to FIJI and exported as individual TIF files, which were then reassembled in .mov format using QuickTimePro 7. Movie (.mov) files were then imported into Adobe Premiere CC where they were labeled and finally exported as .mp4 files. Standard confocal imaging was performed as previously (Shin et al., 2016b). Rotating 3D reconstructions of confocal stacks were generated using Imaris and exported as .avi files, which were processed as described above.
Statistical measurement of vascular volume of wt and mutants
After angiography of Qdot655 (Figure S5C, 6B) or Qdot705 (Figure 1C–E, Figure 4D and Figure 5F) confocal images (1024 x 1024 pixels with 3μm interval) of vascular perfusion in head region was taken. The 3D confocal stack images were analyzed using Imaris. Vascular volume (voxel) in a certain cube (X:300 x Y:300 x Z:50 pixels) including basal communicating artery, posterior communicating segments, posterior mesencephalic central artery and central arteries was volume-rendered and measured in mutant (n=3) compared with that of the wild type (n=3).
Photoconversion
Kaede protein was photoconverted by using a UV laser on an LSM700 using the ROI and bleaching tool (405nm with maximum power and from 75 to 300 iterations) in ZEN 2011 software. Immediately after photoconversion, we captured confocal images using 488 nm and 555 nm lasers and each embryo was given a unique identifier number and grown in separate wells of a 24-well plate. At 4dpf, confocal images of the embryos were taken using 488 nm and 555 nm lasers and analyzed using FIJI ImageJ ver2.0.
qPCR using isolated lymphatic valve cells
FACS was performed using dissociated cells from 5-day embryos bearing the TgBAC(gata2a:gfp)la3 and Tg(lyve1b:dsred2)nz101 to isolate 4 cell populations: gata2a:gfp-positive/lyve1b:dsred2-positive, gata2a:gfp-positive/lyve1b:dsred2-negative, gata2a:gfp-negative/lyve1b:dsred2-positive, and double-negative. Total RNA from each cell population was isolated using Trizol (ThermoFisher) and was further purified using RNA Clean & Concentrator-25 with on-column DNaseI treatment (Zymo Research). 70 ng of RNA was reverse transcribed using SuperScript III First-Strand synthesis SuperMix (ThermoFisher) and qPCR was performed using gene-specific primer sets (see Table S2) and PowerSybr Green Master Mix (ThermoFisher) on a StepOnePlus Real-Time PCR machine (ThermoFisher). ΔΔCq values (2^-(tCT-refCT)) normalized to eef1a1l1 levels expression were used to measure fold change between single- or double-positive populations and the negative population.
Electron microscopy
Embryos under anesthesia were separated into head (for SEM and TEM) and trunk (for gDNA isolation and genotyping) using a 23G needle. Heads were transferred in 96-well PCR plate filled with 2% paraformaldehyde/1.25% Glutaraldehyde/0.025M phosphate buffer (pH 7.5) and kept at 4°C. Trunks were placed into individual wel ls of a separate 96-well PCR plate filled with 0.05M NaOH followed by digestion at 98°C and neutralization with 0.5M Tris-HCl (pH 7.4), then subjected to KASP genotyping. After rinsing with 0.05 M phosphate buffer, heads were post-fixed with 1% OsO4 at 4°C for 2 hours and then dehydrated with an alcohol series. After treating with QY-1 (Nisshin EM, Japan) for resin infiltration, specimens were embedded in epoxy resin (Epon 812 TAAB Laboratories, Aldermaston, Berks, UK) at 60°C for 3 days. For Scanning Electron Microscopy (SEM), serial semi-thin sections at 500 nm were cut on an Ultracut microtome (Leica EM-UC6), mounted on glass slides (100 sections per slide) and stained with toluidine blue 1% (w/v) and sodium tetraborate1% (w/v) solution. Images of all serial sections were captured using Virtual Slide Scanner (NanoZoomer, Hamamatsu Photonics K. K., Japan) and aligned using the 3D software (Fiji ImageJ). Target sections containing lymphatic or lymphovenous valves were selected in virtual serial sections, stained with uranyl acetate and lead stain solution (Sigma), and then coated with Platinum to make the slide glass surface conductive. Back-Scattered Electron images of the surface of target sections were acquired using a SU8010 scanning electron microscope (Hitachi, Japan) with 3mm working distance, accelerate voltage at 5.0 kv and magnification at 2.0 k. At least 3 larvae each for mutant or wild type were analyzed. For Transmission Electron Microscopy (TEM), ultra-thin sections sliced at 60 nm were mounted on copper grids. Sections containing lymphatic valves were stained with uranyl acetate and lead stain solution and imaged with a H-7650 transmission electron microscope (Hitachi, Japan) with accelerate voltage at 100 kv. To generate image stacks of scanning electron microscopy sections, 500 nm serial-section images were automatically aligned using the ‘StackReg’ plugin in Fiji/Image J (https://imagej.net/StackReg). The aligned images were carefully checked visually and corrected manually if necessary. Movie files containing image stacks in .avi format were processed as above.
3D reconstruction of SSA–SEM images
200 nm serial-section images were automatically aligned using the ‘StackReg’ plugin in Fiji/Image J. The aligned images were carefully checked visually and corrected manually if necessary. Subsequently, they were imported into Photoshop CS5 (Adobe), and the cytoplasm and nuclei consisting of lymphatic leaflets were manually pseudo-colored and segmented by tracing their boundaries on different layers. Using 3D slicer (https://www.slicer.org/), the layers from serial section images were reconstructed and surface-rendered to create a 3D animation of two leaflets in which each cell or nucleus is recognized by pseudo color.
QUANTIFICATION AND STATISTICAL ANALYSIS
For comparison of phenotypic penetrance, we applied Fisher’s exact test. For comparison of vascular volumes, we applied Students t-test. The values for n and error bars are described in relevant Figure legends.
DATA AND CODE AVAILABILITY
This study did not generate datasets or code.
Supplementary Material
Figure S1. Expression of acta2:mcherry. Related to Figure 2.
Confocal micrographs of Tg(acta2:mcherry)ca8;TgBAC(dab2:egfp)ncv67Tg embryos at indicated stage. Arrowheads indicate vascular smooth muscle cells immediately ventral to the dorsal aorta (DA). Posterior cardinal vein (PCV) and thoracic duct (TD) are also indicated. Lateral views, anterior to the left, dorsal is up. Scale bars are 50 μm.
Figure S2. Molecular characterization of lymphatic valve endothelial cells in zebrafish. Related to Figure 3.
(A) Confocal micrographs of TgBAC(gata2a:gfp)la3;(lyve1b:dsred2)nz101 embryos at indicated stages. White box indicates region of higher magnification images shown for each stage. White arrows denote GFP expression in lyve1b:dsred2-positive cells in the region where the lymphatic valve will ultimately form.
(B) Confocal micrographs of Tg(lyve1b:dsred2)nz101 larvae fixed at indicated stages and subjected to immunostaining to detect Prox1 (red) or DsRed2 (green; detected using an antibody against mCherry). White arrowheads indicate Prox1 expression in facial lymphatic endothelial cells. White arrows denote Prox1 expression in presumptive lymphatic valve endothelial cells.
(A, B) Lateral views, anterior to the left, dorsal is up. Scale bars are 50 μm.
Figure S3. Expression of lymphatic valve markers in zebrafish larvae. Related to Figure 3.
(A-D) Confocal micrographs of TgBAC(nfatc1:gal4ff)mu286;(uas:kaede)rk8;(lyve1b:dsred2)nz101 embryos, lateral views, anterior to the left, dorsal is up. Stage is indicated. FCLV – facial collecting lymphatic vessel, FLS – facial lymphatic sprout, ISVe – intersegmental vein, LFL – lateral facial lymphatic vessel, PCV – posterior cardinal vein, PHS – primary head sinus, PHS-LPA – primary head sinus-derived anterior lymphatic progenitor, PHS-LPP – primary head sinus-derived posterior lymphatic progenitor, TD – thoracic duct. (A) Left panels, facial lymphatic system. Right panels, trunk lymphatic system. Scale bars are 50 μm. (B-D) Left panels, full vertical projection of confocal stacks showing facial lymphatic system. Middle panels, area of magnification noted on left panel with selected confocal sections to illustrate expression in lymphatic endothelial cells. Arrowheads indicate region of developing lymphatic valve. Right panels, trunk lymphatic system. Scale bars are 50 μm. (E) Fold enrichment of indicated transcript by qRT-PCR comparing indicated cell populations isolated from TgBAC(gata2a:gfp)la3;(lyve1b:dsred2)nz101 embryos at 5 or 6 dpf by FACS. Error bars are standard deviation across three biological replicates.
Figure S4. Expression patterns in gata2aECE transgenic lines. Related to Figure 4.
Stages and transgenic lines are indicated. Lateral views, anterior is to the left, dorsal is up. Left panels in each set, facial lymphatic system, right panels in each set, trunk lymphatic vessels. aa – aortic arch blood vessel, DA – dorsal aorta, ISLyV – intersomitic lymphatic vessel, ISV – intersomitic vessel, LV – lymphatic valve, PCV – posterior cardinal vein, TD – thoracic duct, PHS-PA – anterior PHS-derived lymphatic progenitor cells, PHS-PP – posterior PHS-derived lymphatic progenitor cells, FLS – facial lymphatic sprout. Scale bars are 50 μm. Upper and lower left-hand corner panels for Tg(gata2aECE:egfp)um282;(lyve1b:dsred2)nz101 embryo and larva at 2 and 14 dpf, respectively, are the same as images shown in Figure 4B.
Figure S5. Zebrafish itga9 mutants. Related to Figure 5.
(A) Schematic showing genomic structure (left) and protein domains (right) affected by targeted itga9 mutations generated in this study.
(B) Graph depicting penetrance of edema in genotyped embryos from an incross between heterozygous individuals bearing the indicated itga9 mutation. Data pooled from at least 3 separate crosses. Numbers of embryos of indicated genotypes used for the analysis are shown below the graph. Fisher’s exact test, * p<0.05, **** p<0.0001, ns – not statistically significant.
(C) Confocal microangiography of wild type and itga9um267 mutant siblings at 7 dpf. No significant changes in vascular volume were detected, and patterning appeared normal. n=3 embryos for each indicated genotype; Student’s t-test, p-value is indicated on graph. Error bars represent mean with standard deviation.
(D) Images of wild type and mutant sibling at 7 dpf of indicated genotype showing edema associated with the gut and eye, denoted by black arrows in the left and right panels, respectively. Inflated swim bladder in all larvae indicated by white arrowheads. Scale bars are 250 μm.
Figure S6. Characterization of gata2a mutants. Related to Figure 6.
(A) Transmitted light images of embryos of indicated genotype at 5 dpf. Graph indicates proportion of embryos of indicated genotype with or without trunk circulation; all hey2um216 mutant embryos displayed cranial circulation, Fisher’s exact test, **** p<0.0001. Scale bars are 250 μm. SEM micrograph showing lymphatic valve leaflets in a hey2um216 mutant embryo at 6 dpf; scale bar is 5 μm.
(B) Confocal microangiography of wild type and gata2aum27 mutant siblings at 4 dpf. No significant changes in vascular volume were detected, and patterning appeared normal. Student’s t-test, 3 embryos from each genotype, p=0.776. Error bars represent mean with standard deviation. Scale bar is 100 μm.
(C) gata2a locus showing location of primers used for RT-PCR. Gel image shows PCR products following amplification with indicated primers from cDNA from pools of 2 to 3 embryos of indicated genotype.
(D) Traces from directly sequenced PCR products amplified from cDNA across the gata2a exon4-exon5 junction from two separate embryos pools of indicated genotype.
Figure S7. Rescuing early defects in foxc1ap162 mutant embryos. Related to Figure 7.
(A,B,F) Quantification of vascular volume by confocal microangiography in embryos of indicated genotype at 4 dpf. No significant changes in vascular volume were detected, although values were consistently lower in mutant embryos; n=3 embryos of each indicated genotype, Student’s t-test, p-values are indicated on graphs. Error bars represent mean with standard deviation.
(C) Transmitted light images of wild type, foxc1ap162 mutant, and rescued foxc1ap162 mutant siblings at 4 dpf. Lateral views, anterior to the left, dorsal is up, scale bar is 250 μm. Arrow denotes pericardial edema, or reduction thereof in rescued sibling.
(D) Graph showing penetrance of circulation at 48 hpf in embryos from an incross of foxc1ap162 carriers left uninjected or injected with foxc1a mRNA. Numbers of embryos of indicated genotypes used for the analysis are shown below the graph. Fisher’s exact test, * p<0.05, ****p<0.0001.
(E) Whole mount in situ hybridization using a kdrl antisense riboprobe to visualize blood vascular endothelial cells. Arrows indicate the following structures: end – ventricular endocardium, aa1 – first aortic arch, LDA – lateral dorsal aortae. foxc1ap162 mutants do not form a connection between the aa1 and the heart at 24 hpf. Scale bar is 50 μm.
(G) Transmitted light images of wild type and rescued foxc1ap162 mutant siblings at 6 dpf. Left panels, lateral views, anterior to the left, dorsal is up. Arrow denotes fluid accumulation near the gut. Right panels, dorsal views, anterior is up; scale bars are 250 μm. Arrowheads indicate excess fluid surrounding the eyes.
(H) Graph showing penetrance of edema at 6 dpf in larvae from a cross of carriers for foxc1ap162. Embryos from these crosses were injected with foxc1a mRNA to rescue early cardiovascular defects. Numbers of embryos of indicated genotypes used for the analysis are shown below the graph. Fisher’s exact test, **** p<0.0001.
VIDEO S5. Related to Figure 4. Rotation of confocal image stack from a Tg(gata2aECE:egfp)um281;(lyve1b:dsred2)nz101 embryos at 2 dpf. Facial lymphatic sprout (FLS), as well as anterior and posterior primary head sinus-derived progenitor populations (PHS-LPA, PHS-LPP, respectively) are indicated.
VIDEO S6. Related to Figure 4. Time lapse video of lymphatic valve progenitors in a Tg(gata2aECE:nsfGFP)um291;(lyve1b:dsred2)nz101 embryo from 48 hpf to 72 hpf.
VIDEO S7. Related to Figure 5. Rotation of 3-dimensional reconstruction of SEM sections from a itga9um287 mutant embryo at 7 dpf. Wild type sibling is shown in Video S4.
VIDEO S8. Related to Figure 6. Stack of SEM sections from gata2aum27 mutant larva at 4 dpf.
VIDEO S9. Related to Figure 6. Stack of SEM sections from gata2aum307 mutant larva at 7 dpf.
VIDEO S10. Related to Figure 7. Stack of SEM sections from prox1ai278 mutant larva at 4 dpf.
VIDEO S11. Related to Figure 7. Stack of SEM sections from nfatc1um264 mutant larva at 4 dpf.
VIDEO S12. Related to Figure 7. Stack of SEM sections from a rescued foxc1ap162 mutant larva at 4 dpf.
VIDEO S1. Stack of SEM sections from wild type larva at 4 dpf. Related to Figure 2.
VIDEO S2. Stack of SEM sections from wild type larva at 7 dpf. Related to Figure 2
VIDEO S3. Stack of SEM sections from wild type larva at 14 dpf. Related to Figure 2.
VIDEO S4. Rotation of 3-dimensional reconstruction of SEM sections from a wild type sibling embryo at 7 dpf. 3 cells in each leaflet are labeled, as is the valve opening. Related to Figure 2.
Highlights.
Zebrafish lymphatic valves are similar to their mammalian counterparts
In vivo imaging of zebrafish lymphatic valves identifies their developmental origins
The function of known lymphatic valve regulators is genetically conserved in zebrafish
Acknowledgements
We thank Dr. David Traver for TgBAC(gata2a:gfp)la3 fish, Dr. Sarah Childs for Tg(acta:mcherry)ca8 fish, Dr. Benjamin Hogan for prox1ai278 mutants, and Dr. Michael Granato for foxc1ap162 mutants. The pMJ915 plasmid construct was a gift of Dr. J. Doudna (Addgene #69090) and pDR274 a gift from Dr. K. Joung (Addgene #42250). This work was supported by R35HL140017 from NHLBI (N. D. L.), R01AI117839 and R01GM115911 (S.A.W.), and JP17gm0610010 from AMED-CREST (Japan Agency for Medical Research and Development, Core Research for Evolutional Science and Technology; N. M.).
Footnotes
Publisher's Disclaimer: This is a PDF file of an unedited manuscript that has been accepted for publication. As a service to our customers we are providing this early version of the manuscript. The manuscript will undergo copyediting, typesetting, and review of the resulting proof before it is published in its final citable form. Please note that during the production process errors may be discovered which could affect the content, and all legal disclaimers that apply to the journal pertain.
Declaration of Interests
The authors declare no competing interests.
References
- Alders M, Hogan BM, Gjini E, Salehi F, Al-Gazali L, Hennekam EA, Holmberg EE, Mannens MM, Mulder MF, Offerhaus GJ, et al. (2009). Mutations in CCBE1 cause generalized lymph vessel dysplasia in humans. Nature genetics 41, 1272–1274. [DOI] [PubMed] [Google Scholar]
- Anders C, Niewoehner O, Duerst A, and Jinek M (2014). Structural basis of PAM-dependent target DNA recognition by the Cas9 endonuclease. Nature 513, 569–573. [DOI] [PMC free article] [PubMed] [Google Scholar]
- Ando K, Fukuhara S, Izumi N, Nakajima H, Fukui H, Kelsh RN, and Mochizuki N (2016). Clarification of mural cell coverage of vascular endothelial cells by live imaging of zebrafish. Development 143, 1328–1339. [DOI] [PMC free article] [PubMed] [Google Scholar]
- Asakawa K, Suster ML, Mizusawa K, Nagayoshi S, Kotani T, Urasaki A, Kishimoto Y, Hibi M, and Kawakami K (2008). Genetic dissection of neural circuits by Tol2 transposon-mediated Gal4 gene and enhancer trapping in zebrafish. Proceedings of the National Academy of Sciences of the United States of America 105, 1255–1260. [DOI] [PMC free article] [PubMed] [Google Scholar]
- Banerjee S, Hayer K, Hogenesch JB, and Granato M (2015). Zebrafish foxc1a drives appendage-specific neural circuit development. Development 142, 753–762. [DOI] [PMC free article] [PubMed] [Google Scholar]
- Bazigou E, Lyons OT, Smith A, Venn GE, Cope C, Brown NA, and Makinen T (2011). Genes regulating lymphangiogenesis control venous valve formation and maintenance in mice. The Journal of clinical investigation 121, 2984–2992. [DOI] [PMC free article] [PubMed] [Google Scholar]
- Bazigou E, and Makinen T (2013). Flow control in our vessels: vascular valves make sure there is no way back. Cell Mol Life Sci 70, 1055–1066. [DOI] [PMC free article] [PubMed] [Google Scholar]
- Bazigou E, Xie S, Chen C, Weston A, Miura N, Sorokin L, Adams R, Muro AF, Sheppard D, and Makinen T (2009). Integrin-alpha9 is required for fibronectin matrix assembly during lymphatic valve morphogenesis. Developmental cell 17, 175–186. [DOI] [PMC free article] [PubMed] [Google Scholar]
- Bussmann J, and Schulte-Merker S (2011). Rapid BAC selection for tol2-mediated transgenesis in zebrafish. Development 138, 4327–4332. [DOI] [PubMed] [Google Scholar]
- Choi J, Dong L, Ahn J, Dao D, Hammerschmidt M, and Chen JN (2007). FoxH1 negatively modulates flk1 gene expression and vascular formation in zebrafish. Developmental biology 304, 735–744. [DOI] [PMC free article] [PubMed] [Google Scholar]
- Eng TC, Chen W, Okuda KS, Misa JP, Padberg Y, Crosier KE, Crosier PS, Hall CJ, Schulte-Merker S, Hogan BM, et al. (2019). Zebrafish facial lymphatics develop through sequential addition of venous and non-venous progenitors. EMBO Rep. [DOI] [PMC free article] [PubMed] [Google Scholar]
- Fatima A, Wang Y, Uchida Y, Norden P, Liu T, Culver A, Dietz WH, Culver F, Millay M, Mukouyama YS, et al. (2016). Foxc1 and Foxc2 deletion causes abnormal lymphangiogenesis and correlates with ERK hyperactivation. The Journal of clinical investigation 126, 2437–2451. [DOI] [PMC free article] [PubMed] [Google Scholar]
- Geng X, Cha B, Mahamud MR, and Srinivasan RS (2017). Intraluminal valves: development, function and disease. Disease models & mechanisms 10, 1273–1287. [DOI] [PMC free article] [PubMed] [Google Scholar]
- Hatta K, Tsujii H, and Omura T (2006). Cell tracking using a photoconvertible fluorescent protein. Nature protocols 1, 960–967. [DOI] [PubMed] [Google Scholar]
- Hauptmann G, and Gerster T (1994). Two-color whole-mount in situ hybridization to vertebrate and Drosophila embryos. Trends Genet 10, 266. [DOI] [PubMed] [Google Scholar]
- Hewson W, and Hunter W (1769). An Account of the Lymphatic System in Fish. By the Same. Philosophical Transactions of the Royal Society of London 59, 204–215. [Google Scholar]
- Hogan BM, Bos FL, Bussmann J, Witte M, Chi NC, Duckers HJ, and Schulte-Merker S (2009). Ccbe1 is required for embryonic lymphangiogenesis and venous sprouting. Nature genetics 41, 396–398. [DOI] [PubMed] [Google Scholar]
- Huang XZ, Wu JF, Ferrando R, Lee JH, Wang YL, Farese RV Jr., and Sheppard D(2000). Fatal bilateral chylothorax in mice lacking the integrin alpha9beta1. Molecular and cellular biology 20, 5208–5215. [DOI] [PMC free article] [PubMed] [Google Scholar]
- Hwang WY, Fu Y, Reyon D, Maeder ML, Tsai SQ, Sander JD, Peterson RT, Yeh JR, and Joung JK (2013). Efficient genome editing in zebrafish using a CRISPR-Cas system. Nature biotechnology 31, 227–229. [DOI] [PMC free article] [PubMed] [Google Scholar]
- Janardhan HP, Milstone ZJ, Shin M, Lawson ND, Keaney JF Jr., and Trivedi CM (2017). Hdac3 regulates lymphovenous and lymphatic valve formation. The Journal of clinical investigation 127, 4193–4206. [DOI] [PMC free article] [PubMed] [Google Scholar]
- Johnson KD, Hsu AP, Ryu MJ, Wang J, Gao X, Boyer ME, Liu Y, Lee Y, Calvo KR, Keles S, et al. (2012). Cis-element mutated in GATA2-dependent immunodeficiency governs hematopoiesis and vascular integrity. The Journal of clinical investigation 122, 3692–3704. [DOI] [PMC free article] [PubMed] [Google Scholar]
- Kamei M, and Weinstein BM (2005). Long-term time-lapse fluorescence imaging of developing zebrafish. Zebrafish 2, 113–123. [DOI] [PubMed] [Google Scholar]
- Karpanen T, Padberg Y, van de Pavert SA, Dierkes C, Morooka N, Peterson-Maduro J, van de Hoek G, Adrian M, Mochizuki N, Sekiguchi K, et al. (2017). An Evolutionarily Conserved Role for Polydom/Svep1 During Lymphatic Vessel Formation. Circulation research 120, 1263–1275. [DOI] [PMC free article] [PubMed] [Google Scholar]
- Kazenwadel J, Betterman KL, Chong CE, Stokes PH, Lee YK, Secker GA, Agalarov Y, Demir CS, Lawrence DM, Sutton DL, et al. (2015). GATA2 is required for lymphatic vessel valve development and maintenance. The Journal of clinical investigation 125, 2979–2994. [DOI] [PMC free article] [PubMed] [Google Scholar]
- Kazenwadel J, Secker GA, Liu YJ, Rosenfeld JA, Wildin RS, Cuellar-Rodriguez J, Hsu AP, Dyack S, Fernandez CV, Chong CE, et al. (2012). Loss-of-function germline GATA2 mutations in patients with MDS/AML or MonoMAC syndrome and primary lymphedema reveal a key role for GATA2 in the lymphatic vasculature. Blood 119, 1283–1291. [DOI] [PMC free article] [PubMed] [Google Scholar]
- Khandekar M, Brandt W, Zhou Y, Dagenais S, Glover TW, Suzuki N, Shimizu R, Yamamoto M, Lim KC, and Engel JD (2007). A Gata2 intronic enhancer confers its pan-endothelia-specific regulation. Development 134, 1703–1712. [DOI] [PubMed] [Google Scholar]
- Kok FO, Shin M, Ni CW, Gupta A, Grosse AS, van Impel A, Kirchmaier BC, Peterson-Maduro J, Kourkoulis G, Male I, et al. (2015). Reverse genetic screening reveals poor correlation between morpholino-induced and mutant phenotypes in zebrafish. Developmental cell 32, 97–108. [DOI] [PMC free article] [PubMed] [Google Scholar]
- Koltowska K, Betterman KL, Harvey NL, and Hogan BM (2013). Getting out and about: the emergence and morphogenesis of the vertebrate lymphatic vasculature. Development 140, 1857–1870. [DOI] [PubMed] [Google Scholar]
- Lawson ND, Scheer N, Pham VN, Kim CH, Chitnis AB, Campos-Ortega JA, and Weinstein BM (2001). Notch signaling is required for arterial-venous differentiation during embryonic vascular development. Development 128, 3675–3683. [DOI] [PubMed] [Google Scholar]
- Lin S, Staahl BT, Alla RK, and Doudna JA (2014). Enhanced homology-directed human genome engineering by controlled timing of CRISPR/Cas9 delivery. Elife 3, e04766. [DOI] [PMC free article] [PubMed] [Google Scholar]
- Mauri C, Wang G, and Schulte-Merker S (2018). From fish embryos to human patients: lymphangiogenesis in development and disease. Curr Opin Immunol 53, 167–172. [DOI] [PubMed] [Google Scholar]
- Moore JC, Sheppard-Tindell S, Shestopalov IA, Yamazoe S, Chen JK, and Lawson ND (2013). Post-transcriptional mechanisms contribute to Etv2 repression during vascular development. Developmental biology 384, 128–140. [DOI] [PMC free article] [PubMed] [Google Scholar]
- Nicenboim J, Malkinson G, Lupo T, Asaf L, Sela Y, Mayseless O, Gibbs-Bar L, Senderovich N, Hashimshony T, Shin M, et al. (2015). Lymphatic vessels arise from specialized angioblasts within a venous niche. Nature 522, 56–61. [DOI] [PubMed] [Google Scholar]
- Norrmen C, Ivanov KI, Cheng J, Zangger N, Delorenzi M, Jaquet M, Miura N, Puolakkainen P, Horsley V, Hu J, et al. (2009). FOXC2 controls formation and maturation of lymphatic collecting vessels through cooperation with NFATc1. J Cell Biol 185, 439–457. [DOI] [PMC free article] [PubMed] [Google Scholar]
- Okuda KS, Astin JW, Misa JP, Flores MV, Crosier KE, and Crosier PS (2012). lyve1 expression reveals novel lymphatic vessels and new mechanisms for lymphatic vessel development in zebrafish. Development 139, 2381–2391. [DOI] [PMC free article] [PubMed] [Google Scholar]
- Pan WR, le Roux CM, Levy SM, and Briggs CA (2010). The morphology of the human lymphatic vessels in the head and neck. Clin Anat 23, 654–661. [DOI] [PubMed] [Google Scholar]
- Pestel J, Ramadass R, Gauvrit S, Helker C, Herzog W, and Stainier DY (2016). Realtime 3D visualization of cellular rearrangements during cardiac valve formation. Development 143, 2217–2227. [DOI] [PMC free article] [PubMed] [Google Scholar]
- Petrova TV, Karpanen T, Norrmen C, Mellor R, Tamakoshi T, Finegold D, Ferrell R, Kerjaschki D, Mortimer P, Yla-Herttuala S, et al. (2004). Defective valves and abnormal mural cell recruitment underlie lymphatic vascular failure in lymphedema distichiasis. Nature medicine 10, 974–981. [DOI] [PubMed] [Google Scholar]
- Quillien A, Abdalla M, Yu J, Ou J, Zhu LJ, and Lawson ND (2017). Robust Identification of Developmentally Active Endothelial Enhancers in Zebrafish Using FANS-Assisted ATAC-Seq. Cell reports 20, 709–720. [DOI] [PMC free article] [PubMed] [Google Scholar]
- Sabine A, Agalarov Y, Maby-El Hajjami H, Jaquet M, Hagerling R, Pollmann C, Bebber D, Pfenniger A, Miura N, Dormond O, et al. (2012). Mechanotransduction, PROX1, and FOXC2 cooperate to control connexin37 and calcineurin during lymphatic-valve formation. Developmental cell 22, 430–445. [DOI] [PubMed] [Google Scholar]
- Shin M, Beane TJ, Quillien A, Male I, Zhu LJ, and Lawson ND (2016a). Vegfa signals through ERK to promote angiogenesis, but not artery differentiation. Development 143, 3796–3805. [DOI] [PMC free article] [PubMed] [Google Scholar]
- Shin M, Male I, Beane TJ, Villefranc JA, Kok FO, Zhu LJ, and Lawson ND (2016b). Vegfc acts through ERK to induce sprouting and differentiation of trunk lymphatic progenitors. Development 143, 3785–3795. [DOI] [PMC free article] [PubMed] [Google Scholar]
- Tammela T, and Alitalo K (2010). Lymphangiogenesis: Molecular mechanisms and future promise. Cell 140, 460–476. [DOI] [PubMed] [Google Scholar]
- Traver D, Paw BH, Poss KD, Penberthy WT, Lin S, and Zon LI (2003). Transplantation and in vivo imaging of multilineage engraftment in zebrafish bloodless mutants. Nature immunology 4, 1238–1246. [DOI] [PubMed] [Google Scholar]
- Trinh LA, Chong-Morrison V, Gavriouchkina D, Hochgreb-Hagele T, Senanayake U, Fraser SE, and Sauka-Spengler T (2017). Biotagging of Specific Cell Populations in Zebrafish Reveals Gene Regulatory Logic Encoded in the Nuclear Transcriptome. Cell reports 19, 425–440. [DOI] [PMC free article] [PubMed] [Google Scholar]
- van Impel A, Zhao Z, Hermkens DM, Roukens MG, Fischer JC, Peterson-Maduro J, Duckers H, Ober EA, Ingham PW, and Schulte-Merker S (2014). Divergence of zebrafish and mouse lymphatic cell fate specification pathways. Development 141, 1228–1238. [DOI] [PMC free article] [PubMed] [Google Scholar]
- Villefranc JA, Amigo J, and Lawson ND (2007). Gateway compatible vectors for analysis of gene function in the zebrafish. Developmental dynamics : an official publication of the American Association of Anatomists 236, 3077–3087. [DOI] [PMC free article] [PubMed] [Google Scholar]
- Whitesell TR, Kennedy RM, Carter AD, Rollins EL, Georgijevic S, Santoro MM, and Childs SJ (2014). An alpha-smooth muscle actin (acta2/alphasma) zebrafish transgenic line marking vascular mural cells and visceral smooth muscle cells. PloS one 9, e90590. [DOI] [PMC free article] [PubMed] [Google Scholar]
- Yaniv K, Isogai S, Castranova D, Dye L, Hitomi J, and Weinstein BM (2006). Live imaging of lymphatic development in the zebrafish. Nature medicine 12, 711–716. [DOI] [PubMed] [Google Scholar]
- Yue Y, Jiang M, He L, Zhang Z, Zhang Q, Gu C, Liu M, Li N, and Zhao Q (2018). The transcription factor Foxc1a in zebrafish directly regulates expression of nkx2.5, encoding a transcriptional regulator of cardiac progenitor cells. The Journal of biological chemistry 293, 638–650. [DOI] [PMC free article] [PubMed] [Google Scholar]
- Zhu C, Smith T, McNulty J, Rayla AL, Lakshmanan A, Siekmann AF, Buffardi M, Meng X, Shin J, Padmanabhan A, et al. (2011). Evaluation and application of modularly assembled zinc-finger nucleases in zebrafish. Development 138, 4555–4564. [DOI] [PMC free article] [PubMed] [Google Scholar]
Associated Data
This section collects any data citations, data availability statements, or supplementary materials included in this article.
Supplementary Materials
Figure S1. Expression of acta2:mcherry. Related to Figure 2.
Confocal micrographs of Tg(acta2:mcherry)ca8;TgBAC(dab2:egfp)ncv67Tg embryos at indicated stage. Arrowheads indicate vascular smooth muscle cells immediately ventral to the dorsal aorta (DA). Posterior cardinal vein (PCV) and thoracic duct (TD) are also indicated. Lateral views, anterior to the left, dorsal is up. Scale bars are 50 μm.
Figure S2. Molecular characterization of lymphatic valve endothelial cells in zebrafish. Related to Figure 3.
(A) Confocal micrographs of TgBAC(gata2a:gfp)la3;(lyve1b:dsred2)nz101 embryos at indicated stages. White box indicates region of higher magnification images shown for each stage. White arrows denote GFP expression in lyve1b:dsred2-positive cells in the region where the lymphatic valve will ultimately form.
(B) Confocal micrographs of Tg(lyve1b:dsred2)nz101 larvae fixed at indicated stages and subjected to immunostaining to detect Prox1 (red) or DsRed2 (green; detected using an antibody against mCherry). White arrowheads indicate Prox1 expression in facial lymphatic endothelial cells. White arrows denote Prox1 expression in presumptive lymphatic valve endothelial cells.
(A, B) Lateral views, anterior to the left, dorsal is up. Scale bars are 50 μm.
Figure S3. Expression of lymphatic valve markers in zebrafish larvae. Related to Figure 3.
(A-D) Confocal micrographs of TgBAC(nfatc1:gal4ff)mu286;(uas:kaede)rk8;(lyve1b:dsred2)nz101 embryos, lateral views, anterior to the left, dorsal is up. Stage is indicated. FCLV – facial collecting lymphatic vessel, FLS – facial lymphatic sprout, ISVe – intersegmental vein, LFL – lateral facial lymphatic vessel, PCV – posterior cardinal vein, PHS – primary head sinus, PHS-LPA – primary head sinus-derived anterior lymphatic progenitor, PHS-LPP – primary head sinus-derived posterior lymphatic progenitor, TD – thoracic duct. (A) Left panels, facial lymphatic system. Right panels, trunk lymphatic system. Scale bars are 50 μm. (B-D) Left panels, full vertical projection of confocal stacks showing facial lymphatic system. Middle panels, area of magnification noted on left panel with selected confocal sections to illustrate expression in lymphatic endothelial cells. Arrowheads indicate region of developing lymphatic valve. Right panels, trunk lymphatic system. Scale bars are 50 μm. (E) Fold enrichment of indicated transcript by qRT-PCR comparing indicated cell populations isolated from TgBAC(gata2a:gfp)la3;(lyve1b:dsred2)nz101 embryos at 5 or 6 dpf by FACS. Error bars are standard deviation across three biological replicates.
Figure S4. Expression patterns in gata2aECE transgenic lines. Related to Figure 4.
Stages and transgenic lines are indicated. Lateral views, anterior is to the left, dorsal is up. Left panels in each set, facial lymphatic system, right panels in each set, trunk lymphatic vessels. aa – aortic arch blood vessel, DA – dorsal aorta, ISLyV – intersomitic lymphatic vessel, ISV – intersomitic vessel, LV – lymphatic valve, PCV – posterior cardinal vein, TD – thoracic duct, PHS-PA – anterior PHS-derived lymphatic progenitor cells, PHS-PP – posterior PHS-derived lymphatic progenitor cells, FLS – facial lymphatic sprout. Scale bars are 50 μm. Upper and lower left-hand corner panels for Tg(gata2aECE:egfp)um282;(lyve1b:dsred2)nz101 embryo and larva at 2 and 14 dpf, respectively, are the same as images shown in Figure 4B.
Figure S5. Zebrafish itga9 mutants. Related to Figure 5.
(A) Schematic showing genomic structure (left) and protein domains (right) affected by targeted itga9 mutations generated in this study.
(B) Graph depicting penetrance of edema in genotyped embryos from an incross between heterozygous individuals bearing the indicated itga9 mutation. Data pooled from at least 3 separate crosses. Numbers of embryos of indicated genotypes used for the analysis are shown below the graph. Fisher’s exact test, * p<0.05, **** p<0.0001, ns – not statistically significant.
(C) Confocal microangiography of wild type and itga9um267 mutant siblings at 7 dpf. No significant changes in vascular volume were detected, and patterning appeared normal. n=3 embryos for each indicated genotype; Student’s t-test, p-value is indicated on graph. Error bars represent mean with standard deviation.
(D) Images of wild type and mutant sibling at 7 dpf of indicated genotype showing edema associated with the gut and eye, denoted by black arrows in the left and right panels, respectively. Inflated swim bladder in all larvae indicated by white arrowheads. Scale bars are 250 μm.
Figure S6. Characterization of gata2a mutants. Related to Figure 6.
(A) Transmitted light images of embryos of indicated genotype at 5 dpf. Graph indicates proportion of embryos of indicated genotype with or without trunk circulation; all hey2um216 mutant embryos displayed cranial circulation, Fisher’s exact test, **** p<0.0001. Scale bars are 250 μm. SEM micrograph showing lymphatic valve leaflets in a hey2um216 mutant embryo at 6 dpf; scale bar is 5 μm.
(B) Confocal microangiography of wild type and gata2aum27 mutant siblings at 4 dpf. No significant changes in vascular volume were detected, and patterning appeared normal. Student’s t-test, 3 embryos from each genotype, p=0.776. Error bars represent mean with standard deviation. Scale bar is 100 μm.
(C) gata2a locus showing location of primers used for RT-PCR. Gel image shows PCR products following amplification with indicated primers from cDNA from pools of 2 to 3 embryos of indicated genotype.
(D) Traces from directly sequenced PCR products amplified from cDNA across the gata2a exon4-exon5 junction from two separate embryos pools of indicated genotype.
Figure S7. Rescuing early defects in foxc1ap162 mutant embryos. Related to Figure 7.
(A,B,F) Quantification of vascular volume by confocal microangiography in embryos of indicated genotype at 4 dpf. No significant changes in vascular volume were detected, although values were consistently lower in mutant embryos; n=3 embryos of each indicated genotype, Student’s t-test, p-values are indicated on graphs. Error bars represent mean with standard deviation.
(C) Transmitted light images of wild type, foxc1ap162 mutant, and rescued foxc1ap162 mutant siblings at 4 dpf. Lateral views, anterior to the left, dorsal is up, scale bar is 250 μm. Arrow denotes pericardial edema, or reduction thereof in rescued sibling.
(D) Graph showing penetrance of circulation at 48 hpf in embryos from an incross of foxc1ap162 carriers left uninjected or injected with foxc1a mRNA. Numbers of embryos of indicated genotypes used for the analysis are shown below the graph. Fisher’s exact test, * p<0.05, ****p<0.0001.
(E) Whole mount in situ hybridization using a kdrl antisense riboprobe to visualize blood vascular endothelial cells. Arrows indicate the following structures: end – ventricular endocardium, aa1 – first aortic arch, LDA – lateral dorsal aortae. foxc1ap162 mutants do not form a connection between the aa1 and the heart at 24 hpf. Scale bar is 50 μm.
(G) Transmitted light images of wild type and rescued foxc1ap162 mutant siblings at 6 dpf. Left panels, lateral views, anterior to the left, dorsal is up. Arrow denotes fluid accumulation near the gut. Right panels, dorsal views, anterior is up; scale bars are 250 μm. Arrowheads indicate excess fluid surrounding the eyes.
(H) Graph showing penetrance of edema at 6 dpf in larvae from a cross of carriers for foxc1ap162. Embryos from these crosses were injected with foxc1a mRNA to rescue early cardiovascular defects. Numbers of embryos of indicated genotypes used for the analysis are shown below the graph. Fisher’s exact test, **** p<0.0001.
VIDEO S5. Related to Figure 4. Rotation of confocal image stack from a Tg(gata2aECE:egfp)um281;(lyve1b:dsred2)nz101 embryos at 2 dpf. Facial lymphatic sprout (FLS), as well as anterior and posterior primary head sinus-derived progenitor populations (PHS-LPA, PHS-LPP, respectively) are indicated.
VIDEO S6. Related to Figure 4. Time lapse video of lymphatic valve progenitors in a Tg(gata2aECE:nsfGFP)um291;(lyve1b:dsred2)nz101 embryo from 48 hpf to 72 hpf.
VIDEO S7. Related to Figure 5. Rotation of 3-dimensional reconstruction of SEM sections from a itga9um287 mutant embryo at 7 dpf. Wild type sibling is shown in Video S4.
VIDEO S8. Related to Figure 6. Stack of SEM sections from gata2aum27 mutant larva at 4 dpf.
VIDEO S9. Related to Figure 6. Stack of SEM sections from gata2aum307 mutant larva at 7 dpf.
VIDEO S10. Related to Figure 7. Stack of SEM sections from prox1ai278 mutant larva at 4 dpf.
VIDEO S11. Related to Figure 7. Stack of SEM sections from nfatc1um264 mutant larva at 4 dpf.
VIDEO S12. Related to Figure 7. Stack of SEM sections from a rescued foxc1ap162 mutant larva at 4 dpf.
VIDEO S1. Stack of SEM sections from wild type larva at 4 dpf. Related to Figure 2.
VIDEO S2. Stack of SEM sections from wild type larva at 7 dpf. Related to Figure 2
VIDEO S3. Stack of SEM sections from wild type larva at 14 dpf. Related to Figure 2.
VIDEO S4. Rotation of 3-dimensional reconstruction of SEM sections from a wild type sibling embryo at 7 dpf. 3 cells in each leaflet are labeled, as is the valve opening. Related to Figure 2.
Data Availability Statement
This study did not generate datasets or code.