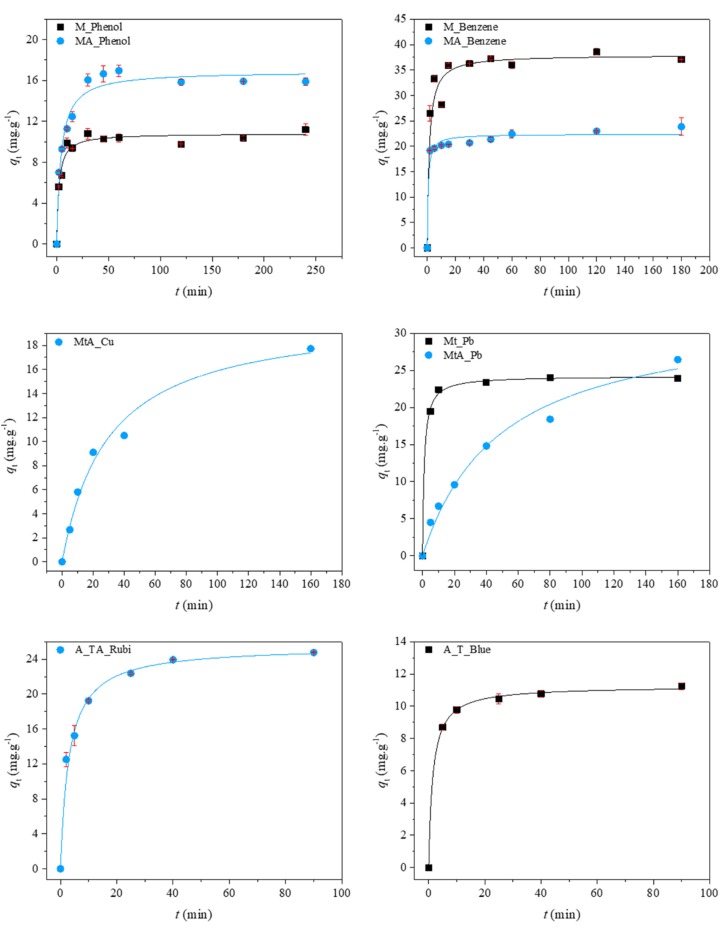
Figure 3.
Representative plots of the fit of non-linearized form of pseudo-second order equation (solid line) to the data of experimental adsorption capacity as function of time, for the studied adsorbents towards VOCs (C0 = 100 ppm, 15 rpm, 20 °C), heavy metals (C0 = 200 ppm, 15 rpm, 20 °C) and dyes (C0 = 50 ppm, 15 rpm, 20 °C) in aqueous solution.

