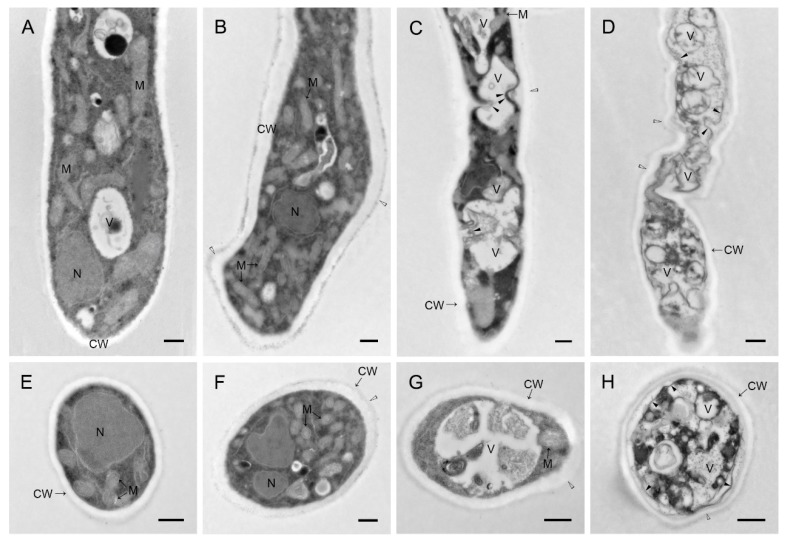
Figure 7.
Cytology of hyphae of V. mali under different concentrations of WH01 treated at 48 h. (A) and (E) were the transverse and longitudinal sections of hyphae, respectively, under 0 mg/L treatment. (B) and (F) were the transverse and longitudinal sections of hyphae WH01 treatment, respectively, under 3 mg/L treatment. Mitochondrial contents in hyphae increased with malformation of hyphae. (C) and (G) were the transverse and longitudinal sections of hyphae, respectively, under 6 mg/L treatment. Malformation and vacuolization of hyphae with plasmolysis slightly was exhibited. (D) and (H) were the transverse and longitudinal sections of hyphae, respectively, under 12 mg/L treatment. The range of malformation, vacuolization, and plasmolysis of hyphae increased more. Bar = 500 nm. (CW: cell wall, N: nucleus, M: mitochondria, V: vacuole, “▲” (black triangle): plasmolysis, “△” (white triangle): malformation of hyphae)

