Abstract
Despite global connectivity, societies seem to be increasingly polarized and fragmented. This phenomenon is rooted in the underlying complex structure and dynamics of social systems. Far from homogeneously mixing or adopting conforming views, individuals self-organize into groups at multiple scales, ranging from families up to cities and cultures. In this paper, we study the fragmented structure of American society using mobility and communication networks obtained from geo-located social media data. We find self-organized patches with clear geographical borders that are consistent between physical and virtual spaces. The patches have multi-scale structure ranging from parts of a city up to the entire nation. Their significance is reflected in distinct patterns of collective interests and conversations. Finally, we explain the patch emergence by a model of network growth that combines mechanisms of geographical distance gravity, preferential attachment and spatial growth. Our observations are consistent with the emergence of social groups whose separated association and communication reinforce distinct identities. Rather than eliminating borders, the virtual space reproduces them as people mirror their offline lives online. Understanding the mechanisms driving the emergence of fragmentation in hyper-connected social systems is imperative in the age of the Internet and globalization.
Keywords: social networks, spatial fragmentation, Twitter data
1. Introduction
The increasing polarization of societies is becoming apparent around the world. Despite access to global communication [1], people seem to be splitting into groups that mostly listen to their own members [2–4]. Individual choices of association due to ideologies [5–7], occupations [8,9] or consumer habits [10] can drive the emergence of social polarization or fragmentation [9,11]. While different social features affect processes of homophily and influence, in this work, we study how fundamental geographical factors also affect the large-scale structure of social interactions and communication networks. Previous studies have proposed distance as the driving factor for social interactions [12–14]. We show that the structure of the emergent social networks is richer than what distance alone can explain and includes the influence of factors like administrative borders and urban structures. It is crucial to understand the structural and geographical properties of collective association and their relationship to the social space.
The social space is defined as the place where people meet and interact [15]. While group cohesion is strongly influenced by internal communication, weaker external ties are necessary for integration at larger scales, providing individuals with information and resources beyond the borders of their own community [15–20]. Previous studies have shown that the structure of both strong and weak ties affects the behaviour of social systems, including the spread of innovation [21], business and culture [22], crime systems [23] and the development of regional and national events [24]. Social fragmentation affects the way information flows among individuals [25] and consequently their emergent behaviours [5,9,26], including political or physical conflict [27–30].
The recent availability of large-scale datasets obtained from communication or transaction records for landlines, mobile phones, social media and banknote circulation has considerably improved our ability to study social systems [31–34]. Geo-located data sources, such as Twitter, enable direct observation of social interactions and collective behaviours with unprecedented detail. While the Twitter user base is known to skew younger and more urban [35,36], the large size of its user base and high frequency of tweets has enabled new types of studies of networks and geo-located activities. For example, Twitter data have been used in studies on a wide range of behavioural phenomena, including human migration, disease outbreaks, and patterns of happiness and lifestyle [37–42].
Networks of human mobility [31,34,43–45] and communication [10,34,37,46–49] reveal the existence of geo-located communities or patches. Researchers have used Twitter data on mobility to show where geo-located communities deviate from administrative boundaries in Great Britain [42]. Others have generated networks of Twitter communications and examined community formation in various countries [37] or in a natural disaster [41]. While these studies analyse the structure of mobility or communication networks separately, we show that these two are not independent from one another and rather that networks in physical space are mirrored in the virtual space.
In this work, we use geo-located Twitter data to identify two networks in the US, human mobility and communication. We show that the specific geographical patches of both networks are very similar. We validate the significance of these patches by analysing hashtag use by location and find similar patterns of divergence as in the mobility and communication networks. Finally, we build a model of network growth to understand the generic statistical properties of the natural human dynamics observed in the data. Our model combines a distance gravity component for cluster formation with preferential attachment and spatial growth mechanisms to allow clusters to differentiate in geographical space and grow over time. This work provides an extensive depiction of geographic network dynamics and social fragmentation in the USA.
2. Material and methods
2.1. Data
We use geo-located Twitter data to generate geographical networks based on where people travel or communicate. The data were obtained using the Twitter Streaming Application Programming Interface (API). We collected tweets from 22 August 2013 to 25 December 2013, totalling over 87 million tweets posted by over 2.8 million users in the USA.
2.2. Networks
We analyse mobility and communication patterns by generating geographical networks. Nodes represent a lattice of 0.1° latitude × 0.1° longitude cells overlaid on a map of the USA. Each cell is approximately 10 km wide. There are about 400 000 cells comprising inhabited areas of the USA. Network edges reflect two types of data: mobility and communication. In the mobility network, edges are created when a user u tweets consecutively from two locations, i and j. In the communication network, edges are created when a user u at location i mentions another user v that has most recently tweeted at location j. The weight of an edge represents the number of people who either travel or communicate between i and j. These networks aggregate the heterogeneities of human activities in a large-scale representation of social collective behaviours [50].
2.3. Methods
The term network fragmentation is often used in the literature to describe the process of network dismantling [51,52]. In this work, we use the term ‘social fragmentation’ to represent the modular structure of a social system due to the absence of links and nodes. This is in line with terminology from other works that employ community detection methods such as the Girvan–Newman method [53].
We analyse social fragmentation by applying the Louvain method [54] with modularity optimization [55] to the mobility and communication networks obtained from Twitter data. The Louvian algorithm starts by considering each node as a single community. Iteratively, nodes move to the neighbouring communities and join them to maximize modularity (M). Modularity is a scalar value −1 < M < 1 that quantifies how distant the number of edges inside a community are from those of a random distribution. Negative modularities occur when nodes are assigned to the wrong communities, zero occurs when all the nodes are assigned to a single community, and higher values represent increasingly optimal partitions as the values get closer to 1 [56,57].
To study communities at multiple scales, we use a generalized version of modularity [54] that includes a resolution parameter γ. In the conventional modularity equation, γ = 1 and the same weight is given to observed links and expected links from a randomized network. In the generalized form, γ < 1 gives more weight to the observed links, which generates larger communities, while γ > 1 puts more weight on the randomized term and generates smaller communities. Because it is a method with multiple maxima, we chose partitions that are robust to multiple runs of the algorithm.
We validate the significance of the patches by observing hashtag use. We create a matrix whose rows represent locations and columns represent hashtags. In order to observe collective behaviours, we consider only those hashtags that were posted at least 500 times and locations with at least 20 tweets. We apply the term frequency-inverse document frequency (TF-IDF) transformation [58,59] to the matrices in order to normalize the hashtags (columns of the matrix). We then apply principal component analysis (PCA) [60] to the hashtag matrix and retrieve the top 100 components, and then apply t-distributed stochastic neighbour embedding (t-SNE) [61,62] to the resulting PCA matrix.
3. Results
3.1. Social fragmentation
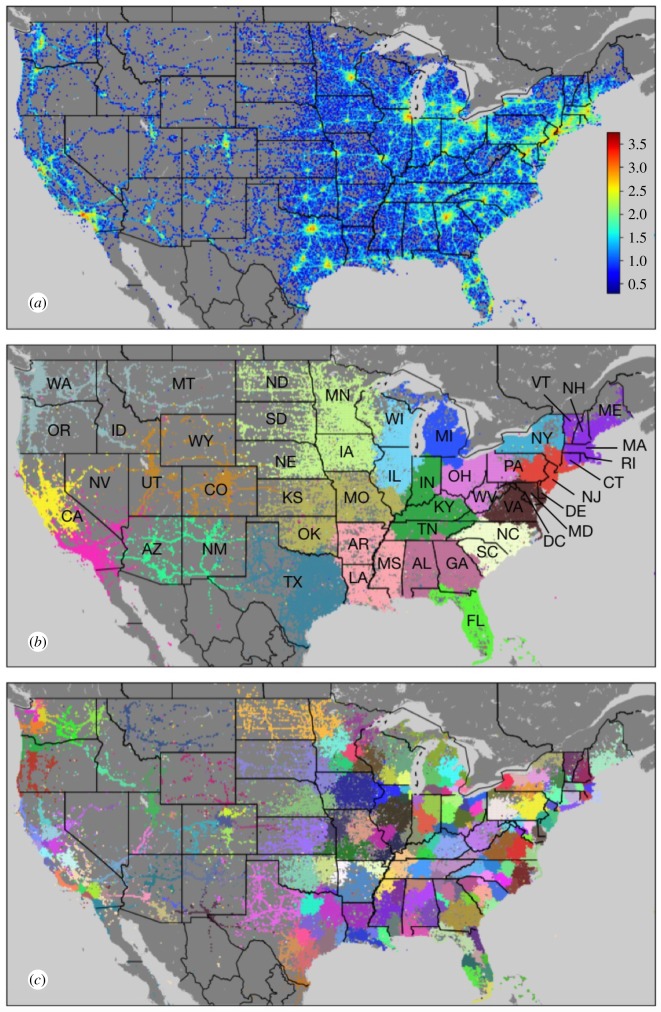
We first generated a mobility network of instances in which a user tweets from different locations, representing travel (see §2.3). Figure 1 depicts the spatial properties of the mobility network on a map of the USA in terms of degree centrality (figure 1a) and two levels of modular structure (figure 1b,c). The degree centrality shows the density of user movements at each geographical point. The activity is concentrated in large cities (red in figure 1a) and decreases towards suburban and rural areas (green, blue and grey). In areas of the country with high population density, cities merge into large regions of high activity (e.g. the East Coast corridor). In other areas, roads are also visible, as people tweet when they travel between cities. Highways in rural areas with higher traffic appear in green, and less travelled roads are blue.
Figure 1.
Structure and fragmentation patterns of the network associated with human mobility. (a) Spatial degree centrality of the mobility network. Colours indicate the amount of people travelling at each location, measured by the logarithm of the degree centrality of each node (scale inset). The mobility network was used to generate communities using modularity optimization, with distinct colours indicating (b) 20 patches that can be visually associated with states or regions and (c) 206 smaller subcommunities within the communities of (b) that can be visually associated with urban centres.
The spatial fragmentation of social systems arises when people travel and choose which boundaries not to cross either directly or incidentally. Our results suggest that the US mobility network is fragmented into 20 large communities (figure 1b) whose boundaries often follow state boundaries but may in particular cases be parts of one state or the combination of multiple states. At a finer scale of subdivision, these large communities of the mobility network are subdivided into patches that typically include individual cities and their surrounding areas. There are 206 such communities that we obtain by applying the same modularity optimization algorithm to each larger community (figure 1c).
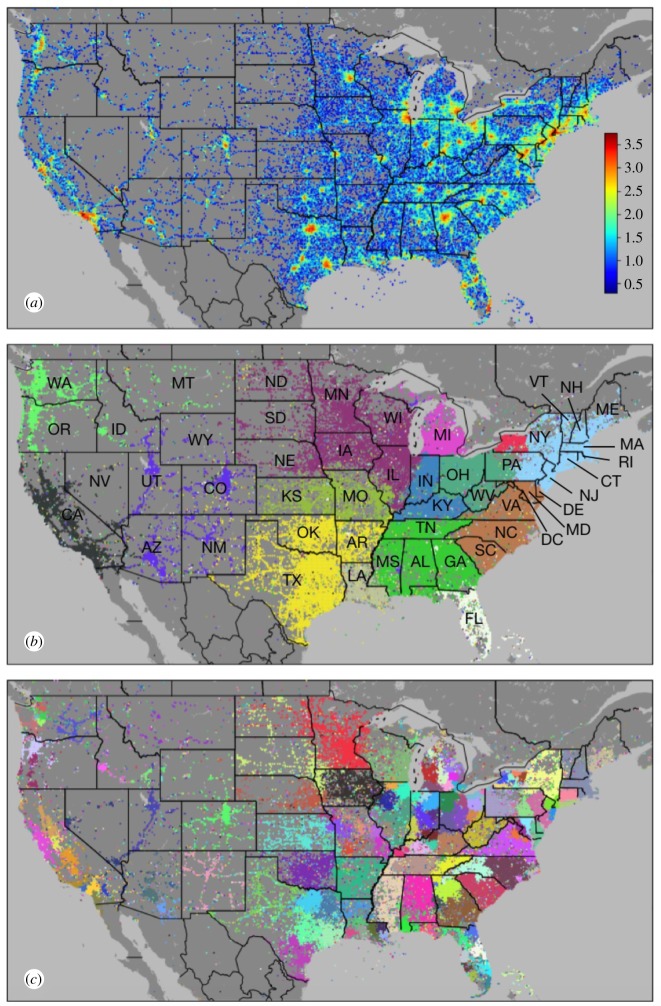
Following the mobility network, we generated a communication network from Twitter mentions, shown in figure 2. Our modularity analysis on this network shows that it also has structure of social fragmentation that is consistent with the mobility network. Thus, while the Internet and social media have drastically affected the dynamics of communications, the geographical structure of online communication remains fragmented and presents a similar structure to the one obtained from offline interactions. There are some differences as well. In contrast to the 20 modules in the mobility network, there are 15 modules that arise in the communication network.
Figure 2.
Structure and fragmentation patterns of the network associated with human communication. (a) Spatial degree centrality of the communication network. Colours indicate the amount of communication at each location, measured by the logarithm of the degree centrality of each node (scale inset). The communication network was used to generate communities using modularity optimization, with distinct colours indicating (b) 15 patches that can be visually associated with states or regions and (c) 168 smaller subcommunities within the communities of (b) that can be visually associated with urban centres.
The borders of some communities in figure 2 are almost the same as those in the mobility network (figure 1b), such as the community encompassing states of the Northwest (WA, OR, ID and MT), the community corresponding to Michigan (MI) and the community corresponding to Florida (FL). Ohio (OH), western Pennsylvania (PA) and West Virginia (WV) are also still in the same patch. Meanwhile, other communities in the mobility network merge into a larger community in the communication network. For example, the six-state region of New England (Maine (ME), Massachusetts (MA), New Hampshire (NH), Vermont (VT), Rhode Island (RI) and Connecticut (CT)) is a separate community in the mobility network but is combined with New York (NY), New Jersey (NJ) and Pennsylvania (PA) in the communications network. The two patches of North and South Carolina (NC and SC) and Virginia (VA) and Maryland (MD) are also combined into one. This demonstrates that certain areas have a broader radius of online communication than physical travel. Finally, figure 2c represents the smaller communities within each community in figure 2b. These patches show areas connected to urban centres and are very similar to those of the mobility network in figure 1c. Some less populous states are now single communities, such as Montana (MT), Nebraska (NE), Kansas (KS), Oklahoma (OK), Arkansas (AR) and New Mexico (NM), while more densely populated areas are subdivided around urban centres.
To further investigate the role of state boundaries in community formation, we quantified to what extent each state contributes to communities for both networks (see electronic supplementary material, S1.1 and figure S1). States mostly belong to specific communities. This shows that the structure we observe is not simply due to the effects of distance [13]. To show this, we generated artificial networks with links weighted by only the inverse of distance or distance squared (see electronic supplementary material, S1.2). While spatial patches are also present in these artificial networks, the patches do not follow state boundaries and are not consistent across both types of networks (see electronic supplementary material, figures S2 and S3). We also performed validation of community stability and find that the number of communities and boundaries we show are consistent and stable across multiple realizations of the algorithm (see electronic supplementary material, S1.3 and figure S4). Overlapping regions across realizations can happen either because small locations flip between large communities or because large communities are split into smaller ones.
We quantitatively compared the modular structure of the mobility and communication networks (figure 3) by creating a matrix where we count the number of overlapping nodes of communities arising from the networks of communication (rows) and mobility (columns). Rows have been normalized by the size of each community in the communication network. Some communities from the communication network are almost identical in the mobility network and therefore show a high overlap (red). Others are similar but not identical. A few communities from the mobility network are merged into communities in the communication network (green and light blue). Despite the observed differences in the networks representing two fundamentally different types of interactions, the modular structure is remarkably consistent, revealing that there is a strong coupling between the way people travel in physical space and communicate with each other online.
Figure 3.
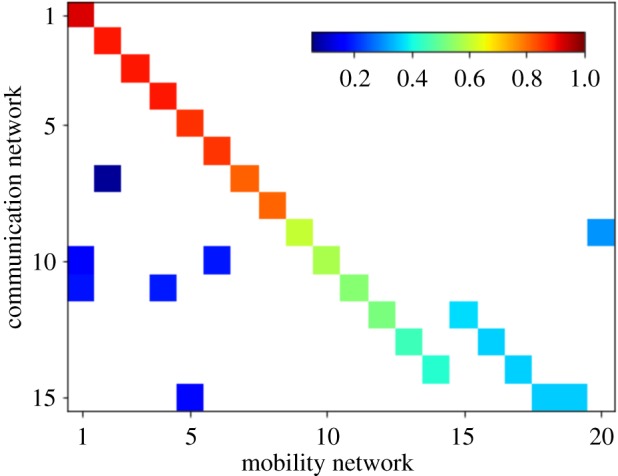
Similarity of communities in the communication and mobility networks. Matrix of the regional communities for the communication network (y-axis, n = 15) and mobility network (x-axis, n = 20), ordered by decreasing overlap between communities. Cell colours represent the number of nodes overlapping between the two networks in each community, normalized by the size of the communities per row (scale inset), with no overlap indicated in white.
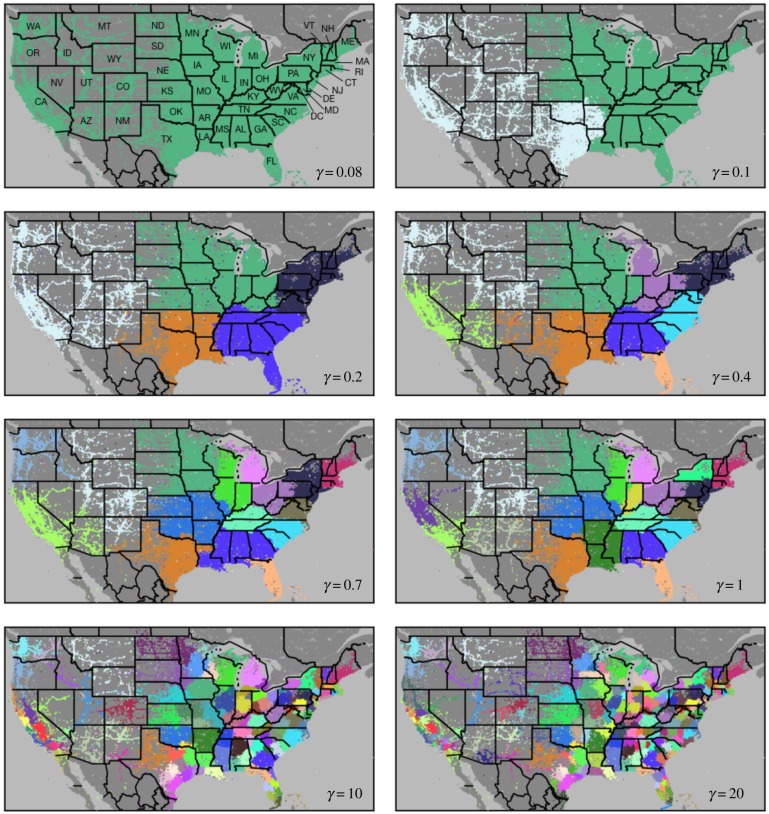
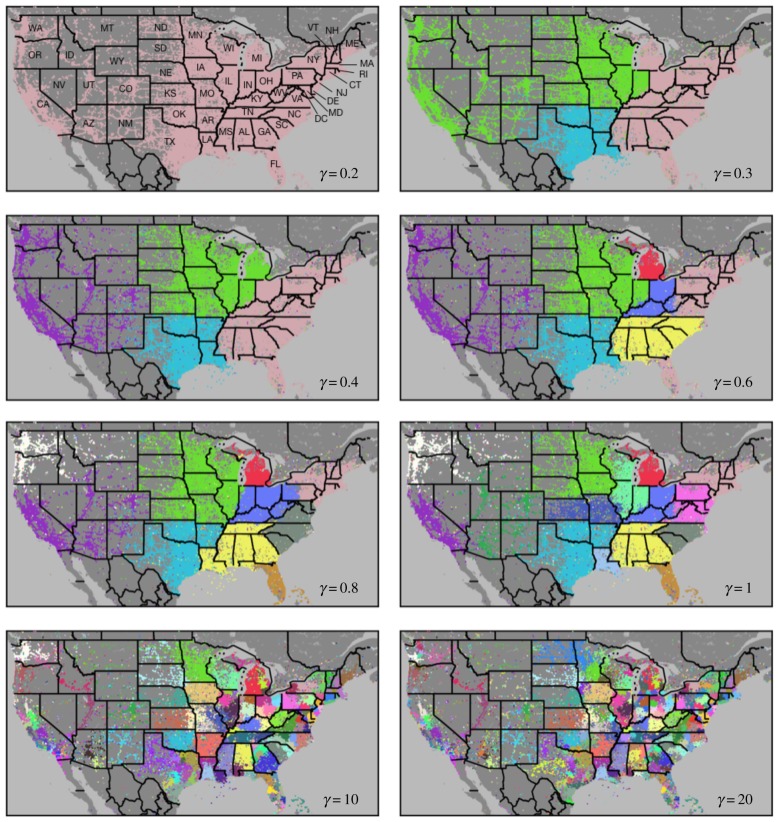
In order to further understand similarities between the mobility and communication networks, we performed a multi-scale analysis of community structure using a generalized modularity optimization algorithm that introduces a resolution parameter, γ [54]. Smaller values of γ identify progressively larger communities, and vice versa. The multi-scale analyses of the mobility and communication networks are shown for some examples of γ values in figures 4 and 5, respectively. Partitions range from a single large module of the entire USA (top panels) down to urban scale partitions (bottom panels). Some states like Pennsylvania (PA) are split into multiple communities early in the process (γ ≈ 0.4 in the mobility network), while other states like Texas (TX) emerge as single communities (γ ≈ 1 in the mobility network) and internally fragment later in the process. These differences are directly associated with the internal structure of social ties and their geographical breakpoints, further explored in the Discussion (§4). In order to validate these partitions, we compared them with the communities detected by Infomap [63]. This method finds the best partition based on the flow of information in a network. The comparison shows that the patterns obtained using Infomap are very similar to the ones obtained from the multi-scale modularity method at specific values of γ (see electronic supplementary material, S1.4 and figure S5).
Figure 4.
Multi-scale decomposition of the mobility network. Colours indicate geographical patches detected in the mobility network for values of the resolution parameter γ varied from 0.08 to 20 (upper left to bottom right). Colours are retained across panels by the following rule: when a community is divided into multiple subcommunities, the subcommunity that is the most connected to the original (parent) community retains the colour of the parent community; the other subcommunities are assigned new colours. The modularity for all of the panels is over 0.8.
Figure 5.
Multi-scale decomposition of the communication network. Colours indicate geographical patches detected in the communication network for values of the resolution parameter γ varied from 0.2 to 20 (upper left to bottom right). Colours are retained across panels by the following rule: when a community is divided into multiple subcommunities, the subcommunity that is the most connected to the original (parent) community retains the colour of the parent community; the other subcommunities are assigned new colours. The modularity for all of the panels is over 0.8.
We compare the partitions in both networks for different values of γ by using three measures of cluster similarity: Purity [64], Adjusted Rand Index [65] and Fowlkes–Mallows Index [66]. These measures evaluate the overlap of partitions, with values ranging between 0 (no intersection) and 1 (perfect match). Figure 6 shows a matrix whose rows and columns represent the partitions of the mobility and communication networks at different values of resolution (γ-mobility and γ-communication) and whose elements show the average of the three measures of similarity. The highest similarity between the two networks occurs at similar values of resolution (red diagonal), showing that the relative structure of these networks is consistent across scales. Additional comparisons between the two networks can be found in electronic supplementary material, S1.5, including measures of degree centrality and edge weight (electronic supplementary material, figure S6) and an alluvial diagram (electronic supplementary material, figure S7).
Figure 6.
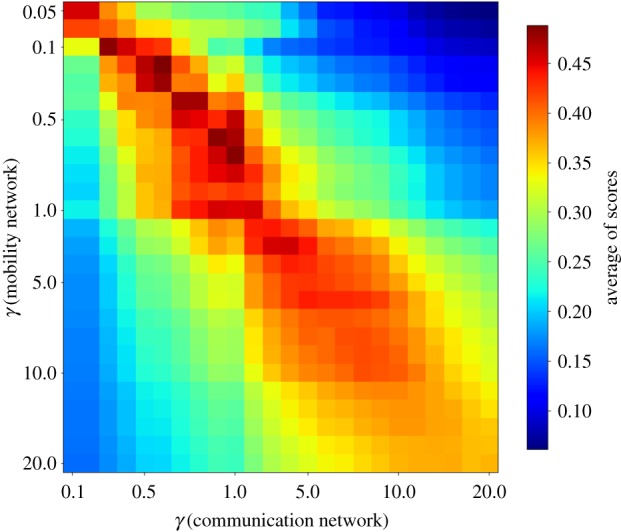
Similarity between the mobility and communication networks across multiple scales. Similarity is measured by the average of the Purity, Adjusted Rank and Fowlkes–Mallows Indexes (colour scale shown). Scale is defined by the different values of the resolution parameter γ (horizontal and vertical axes).
The consistency between the mobility and communication networks reveals that social spaces are not limited to the physical space. Instead, offline interactions seem to condition the structure of online communications. Moreover, the hierarchical multi-scale structure of these networks reveals that smaller communities with cohesive social ties, interactions, and associations belong to progressively larger ones. It may be expected that locations from the same community will have more similarity than locations from different communities.
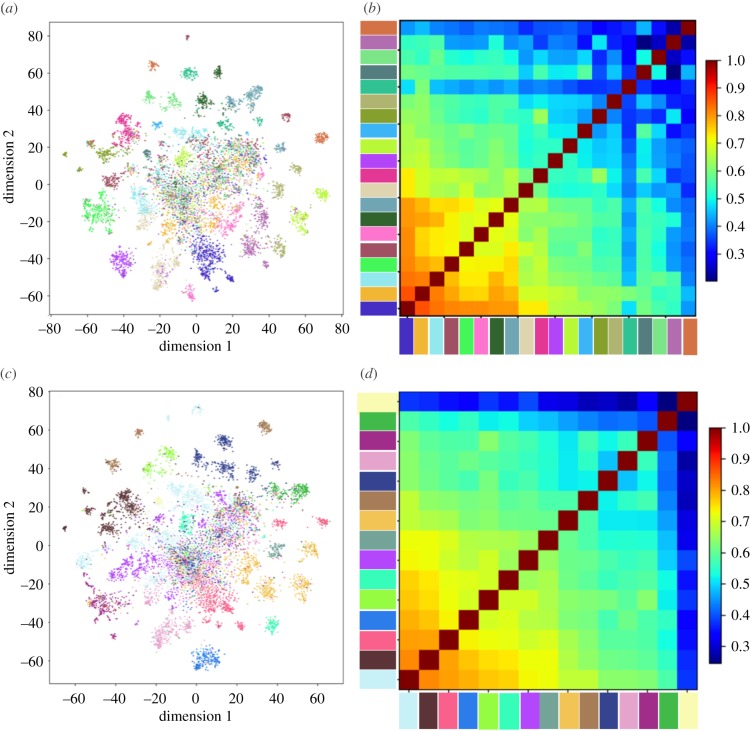
Locations from the same community show similarity in hashtag use and divergence with locations from different communities for either the mobility or communication networks (figures 1b and 2b). Hashtags highlight specific, shared experiences and serve as markers of social interaction [67]. We compared hashtags for locations in the mobility and communication networks at γ = 1 using PCA followed by t-distributed stochastic neighbour embedding (t-SNE) analysis (figure 7a,c for mobility and communication, respectively). See §2.3 for more information on the method. We coloured each dot by location, matching the colours of the communities in figures 1 and 2, panel (b). A number of distinct coloured clusters emerge, suggesting that hashtag use by location corresponds to communities of the mobility or communication networks. Some clusters appear to separate into smaller clusters near to each other, representing subcommunities inside the communities. These patterns are statistically significant after randomizing locations (p < 0.001), detailed in electronic supplementary material, S1.6 and figure S8. To compare communities to each other based on hashtag use, we performed analysis of cosine similarity (figure 7b,d for mobility and communication, respectively). Squares are coloured from blue to red for increasing similarity (colour bar, right). About half of community pairs have less than 50% similarity, while the rest have 50–90% similarity. Communities are distinct at some scales and form larger communities at higher scales.
Figure 7.
Dimensional reduction analysis of hashtag use by location and cosine similarity of communities based on hashtags. (a) The results of t-SNE analysis on the first 100 components of PCA analysis of hashtags in locations of the mobility network. (b) Cosine similarity of hashtag use in the communities of the mobility network at γ = 1. (c,d) The corresponding t-SNE result and cosine similarity for the communication network. Colours match those of the communities in figures 1 and 2, panel (b).
3.2. Model
We constructed a network growth model that combines aspects of network dynamics and human mobility in order to show the emergence of social fragmentation. Our model combines geographical distance gravity [14], preferential attachment to allow creation of hubs (cities) and spatial growth to allow the growth of cities [68]. We begin with a lattice representing geographical locations, and grow connections among them simulating the way people travel. The probability of creating an edge between locations i and j in each time step is:
| 3.1 |
where i represents the origin of the interaction, j indicates the destination, 〈knn〉i indicates i’s nearest neighbours’ average degree, kj represents j’s degree and dij represents the distance between i and j. The exponents α, β and ν control the effects of the preferential attachment mechanism, geographical distance gravity and spatial growth, respectively. The model reproduces the growth of geographical clusters similar to cities (ν), their degree of attractiveness (α) and the linkage between urban centres and surrounding areas, including neighbouring cities (β). We introduce the preferential attachment mechanism to break the symmetry of spatial connections over time and the spatial growth mechanism to allow the city-like structures to grow.
Each location in the lattice has four nearest neighbours, except for locations in corners and on edges, which have two and three neighbours, respectively. Simulations start with a random seed of three connected locations. Links are undirected and weighted to represent the iteration of links over time. Origins are picked randomly (independent from destinations) if their normalized value of 〈knn〉ν exceeds a random threshold. To allow all the locations in the lattice to participate in the dynamics, for the first N time steps, we turn off the origin priority selection and let the system choose origins from a random order of locations, where N represents the number of locations. The probability of selecting destinations is a combination of the preferential attachment mechanism and geographical distance gravity as shown in equation (3.1). Thus, locations that are nearer to the origin location and have a higher degree have a higher probability to be chosen. Simulations continue until reaching a stable state in which communities form and do not change in number.
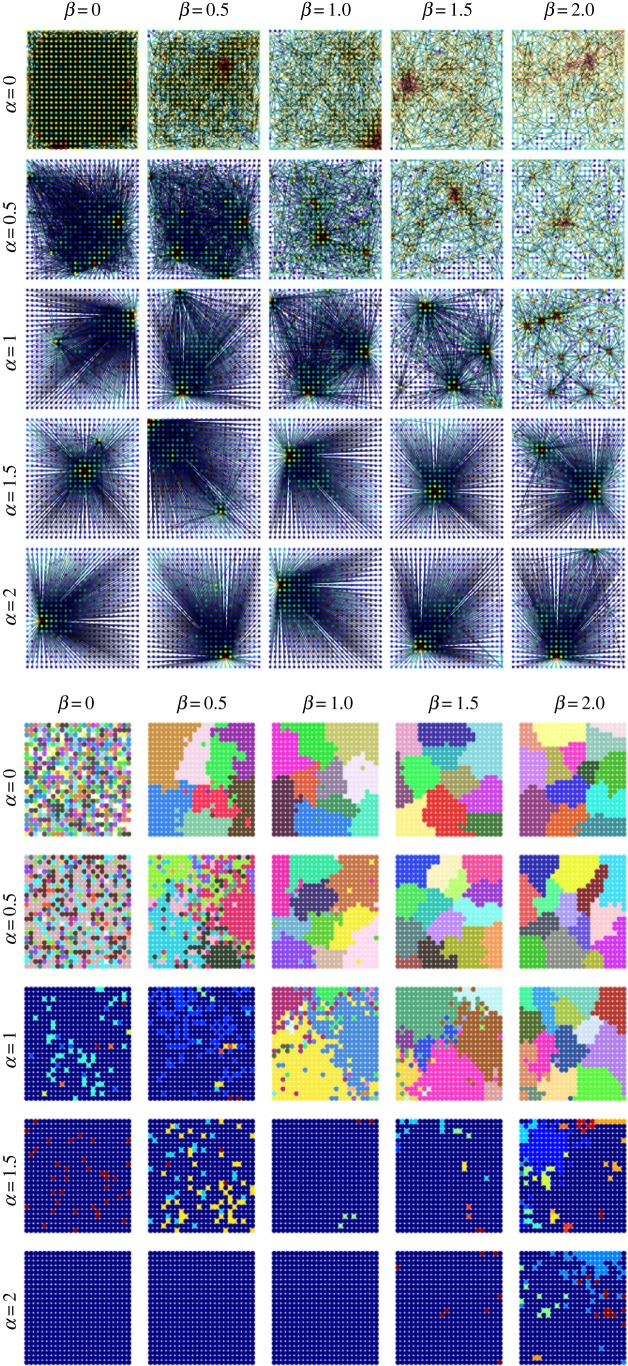
Figure 8 shows the results of model simulations in terms of the spatial degree distribution (top panels) as well as modular structure (bottom panels) for different values of α (rows) and β (columns) and a fixed value of ν = 0.1. If we do not include the effects of either preferential attachment (α = 0) or gravity (β = 0), the destinations of edges are independently distributed among all nodes and the resulting communities have no spatial pattern. If α > β, then a few hubs and one or two communities arise without significant geographical effects. Spatial fragmentation arises when the gravity mechanism is stronger than the preferential attachment (β > α), either without hubs (α = 0) or with hubs (α > 0). Increasing ν leads to more localized high-activity areas (cities), but this also destroys localized patches, leading to lower values of modularity. For additional results exploring variation of the spatial growth mechanism while keeping α and β constant, see electronic supplementary material, S1.7 and figure S9.
Figure 8.
Spatial degree distribution and modular structure for model simulations with different values for parameters α (preferential attachment) and β (geographical distance gravity) and a fixed value of 0.1 for ν (spatial growth). Top panels show the spatial degree distribution (from weakly connected in blue to highly connected in red). Bottom panels show the modules of each graph, with each colour identifying a single community.
We validated the model results against Twitter data by first testing whether the degree distributions from both sources are drawn from the same distribution and second comparing the modularity values. For each set of parameters, we created 20 model realizations and analysed their statistical behaviour. We applied the Kolmogorov–Smirnov statistical test (K-S) to compare the average degree distribution from the model realizations to that of the mobility network, and similarly for the communication network. Figure 9a shows the values of the test results for different values of α and β (rows and columns of the matrix) and ν = 0.1. Lower K-S values (red) indicate more similarity, and higher K-S values (blue) indicate less similarity. The average modularity values for the simulations in figure 9a are shown in figure 9b, ranging from 0 (no modular structure) to 1 (high modular structure). We find that α = 0.9, β = 1.5 and ν = 0.1 give a good fit between simulations and observed data. Results for the K-S statistic with variation of all three parameters are shown in electronic supplementary material, S1.7 and figures S10 and S11.
Figure 9.
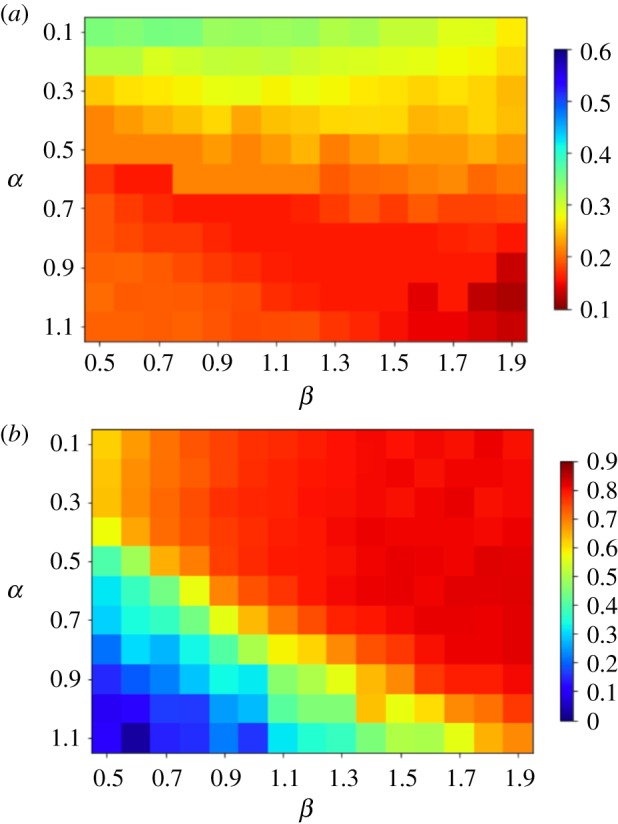
Kolmogorov–Smirnov score and modularity for simulations with varying model parameters, α and β, and fixed resolution parameter ν = 0.1. (a) Colours indicate the Kolmogorov–Smirnov score, with lower scores (red) indicating similarity between the degree distributions of the model and the mobility network. (b) Colours indicate network modularity. Modularity is highest at around 0.8 (dark red), similar to the actual modularity for the mobility network (0.83).
4. Discussion
Understanding the structure and dynamics of groups is an essential aspect of understanding social interactions generally. The functioning of human societies arises not only from the activities of individuals but also from their interaction and integration by means of social ties. We analysed the structure of social ties in the USA using Twitter data and found multi-scale, self-organized fragments that span from urban up to national scales for mobility, communication and hashtag use. Our results show that the structures emerging from these different types of interaction are highly consistent, revealing that social ties couple the integration and separation of groups in both physical and virtual spaces. Despite potential biases in Twitter samples [35,36], the similarity of the detected communities between mobility and communication networks shows that the networks reveal the underlying social structure.
We also constructed a model of network growth that is consistent with the statistical property of the emergence of the observed patterns from the Twitter data. Our model shows that social fragmentation may result from short-distance interactions, in support of hierarchical models of social network formation [69]. However, this mechanism alone does not explain the emergence of highly connected places such as cities. We model the emergence of cities using preferential attachment and spatial growth mechanisms, which increase heterogeneity in degree distribution but may destroy spatial fragmentation if cities grow large enough. Other generative models can also create fat-tails and power-law behaviours. For example, the emergence of city centres can also be modelled as processes of optimization of social interactions and information flows or as outcomes of multiplicative growth mechanisms [70].
The gravity model [71,72] describes how the strength of mobility between two locations is directly related to the population density of those locations and inversely related to the distance between the locations, each of which is a power-law relation. Reported values for the scaling exponents vary in the range 0.5–2.0 depending on the system [2,10,13,34,42,73]. Thus, the gravity model predicts that cities with higher population densities attract higher mobility. However, an important limitation is that the gravity model may overestimate mobility from a low-density population to a high-density population, limiting its applicability over wide geographical areas [14]. Furthermore, the gravity model does not allow for cluster growth or changes in the population of locations. We overcome these limitations by creating a model incorporating geographical distance gravity with preferential attachment and spatial growth.
The formation of groups and their interactions are intimately related to the formation of individual identity through self-identification and adoption of group norms and narratives. Thus, while individual identities are highly complex and unique, there are shared patterns among members of self-associating groups. These common patterns define the group identity, which may involve linguistic, cultural, economic, opinion or interest differences from other groups. To investigate divergence of shared social experience, we analysed hashtag use by location. Hashtags are a means of discussing shared experiences and ideas, aspects of group formation. Our analysis demonstrated that many of the communities from the mobility or communication networks have also distinct hashtag use. This suggests that the communities shared experiences also diverge from other communities.
When we further examine the mobility and communication networks at different scales (figures 4 and 5), we observe that many communities follow state lines, but a few do not, suggesting other forces driving community formation. The large metro area around St Louis, MO creates a community that spills across the Mississippi River and thus the Missouri (MO)-Illinois (IL) state line (mobility network: γ ≈ 0.7–20, communication network: γ ≈ 1). Eastern and western Pennsylvania (PA) splits into two communities, roughly along the Appalachian mountain boundary (mobility network: γ ≈ 0.4–1, communication network: γ ≈ 0.6–1). California (CA) splits into northern and southern communities (mobility network: γ ≈ 0.7–1, communication network: γ ≈ 2), following a known cultural and economic divide [74,75]. The area of eastern Idaho (ID) combines with Utah (UT) (mobility network: γ ≈ 0.3–0.7, communication network: γ ≈ 0.7–2), corresponding to the area of historical Mormon settlement [76]. Geographers have proposed that many cultural, political and religious divisions trace back to the original settlers in each area [77], such that America can be divided into corresponding cultural regions or ‘nations’ [78], which has largely been supported by recent genetic studies of the US population [79]. Our observations also support that the communities we observe reflect geographical, cultural and economic forces that can supersede administrative boundaries in some locations, although state boundaries remain an important factor in social interactions.
Recent trends seem to be accelerating the forces of community formation and divergence we observe. These forces include economic shifts, political polarization, and the rise of social media. Analyses of work commutes have supported the rise of ‘megaregions’, interconnected labour markets with large cities as hubs, reminiscent of the communities we observe [80]. Migrations from one megaregion to another may be motivated by economics, such as the migration over the last decade from the Northeast towards the mountain West and Southwest, which have offered better job prospects and lower housing prices [81]. In addition to economic movements, an increase in political self-sorting behaviour has been observed, with people physically moving nearer to like-minded individuals [82]. The percentage of people who identify as ‘consistently’ liberal or conservative has doubled to over 20% in the past two decades, and these individuals express preferences to live near to, be close friends with, and marry those of the same political persuasion [83]. Social media may be exacerbating this polarization, creating spaces in which users interact with like-minded individuals and ignore opposing opinions [4]. Future work will need to examine how patterns of group formation change and whether cultural, political, or economic factors drive this polarization.
Moving forward, there are at least two strategies for policymakers seeking to address social fragmentation in the USA. One is to fight social fragmentation by promoting intergroup connection and uniformity in society. The other is to recognize that social fragmentation is present and to incorporate it into policy decisions. This means adopting a policy of localism, which involves tailoring policy approaches to each specific area and fostering participation from local political groups [84]. Our analysis suggests that division into two political groups (e.g. Republican and Democrat) is not sufficient in the US today and that subgroups may require partial local autonomy to address the multi-scale divisions present in society.
5. Conclusion
In summary, we have used geo-located Twitter data to generate networks of US mobility, communication and hashtag use and to explore how networks fragment at multiple scales. We also developed a model of network growth that incorporates the properties of geographical distance gravity, preferential attachment, and spatial growth and successfully replicates statistical properties of the social fragmentation patterns observed in the data. Overall, our analysis demonstrates there are many boundaries along which fragmentation of US society may be taking place. Moreover, this fragmentation represents a multi-factorial and dynamic process that is ongoing. It is an important question how social fragmentation at multiple levels will affect the stability and dynamism of US society in the future.
Supplementary Material
Acknowledgements
We thank Irwin Epstein and William Glenney for feedback and Matthew Hardcastle for proofreading the manuscript.
Data accessibility
Data are available at: https://necsi.edu/fragmentation-data.
Authors' contributions
Conceptualization: L.H., A.J.M. and Y.B.-Y. Data curation: A.J.M. Formal analysis: L.H. and A.J.M. Supervision: L.H., A.J.M. and Y.B.-Y. Writing, original draft: L.H., R.A.R. and A.J.M. Writing, review and editing: L.H., R.A.R., A.J.M. and Y.B.-Y. Funding acquisition: Y.B.-Y.
Competing interests
The authors declare no competing interests.
Funding
New England Complex Systems Institute.
References
- 1.Morales AJ, Vavilala V, Benito RM, Bar-Yam Y. 2017. Global patterns of synchronization in human communications. J. R. Soc. Interface 14, 20161048 ( 10.1098/rsif.2016.1048) [DOI] [PMC free article] [PubMed] [Google Scholar]
- 2.Krings G, Calabrese F, Ratti C, Blondel V. 2009. Urban gravity: a model for inter-city telecommunication flows. J. Stat. Mech. 2009, L07003 ( 10.1088/1742-5468/2009/07/L07003) [DOI] [Google Scholar]
- 3.Nelson GD, Rae A. 2016. An economic geography of the United States: from commutes to megaregions. PLoS ONE 11, 1–23. ( 10.1371/journal.pone.0166083) [DOI] [PMC free article] [PubMed] [Google Scholar]
- 4.Herdağdelen A, Zuo W, Gard-Murray A, Bar-Yam Y. 2013. An exploration of social identity: the geography and politics of news-sharing communities in Twitter. Complexity 19, 10–20. ( 10.1002/cplx.v19.2) [DOI] [Google Scholar]
- 5.Bakshy E, Messing S, Adamic LA. 2015. Exposure to ideologically diverse news and opinion on Facebook. Science 348, 1130–1132. ( 10.1126/science.aaa1160) [DOI] [PubMed] [Google Scholar]
- 6.Mucha PJ, Richardson T, Macon K, Porter MA, Onnela J-P. 2010. Community structure in time-dependent, multiscale, and multiplex networks. Science 328, 876–878. ( 10.1126/science.1184819) [DOI] [PubMed] [Google Scholar]
- 7.Mao H, Shuai X, Ahn Y-Y, Bollen J. 2013. Mobile communications reveal the regional economy in Côte d’Ivoire. In NetMob 2013: Data for Development Challenge, 1–3 May, MIT, Cambridge, MA. See https://perso.uclouvain.be/vincent.blondel/netmob/2013/D4D-book.pdf. [Google Scholar]
- 8.Fujita M, Krugman P, Venables AJ. 2001. The spatial economy: cities, regions, and international trade. Cambridge, MA: The MIT Press [Google Scholar]
- 9.Schelling TC. 1971. Dynamic models of segregation. J. Math. Sociol. 1, 143–186. ( 10.1080/0022250X.1971.9989794) [DOI] [Google Scholar]
- 10.Lambiotte R, Blondel VD, de Kerchove C, Huens E, Prieur C, Smoreda Z, Dooren P. 2008. Geographical dispersal of mobile communication networks. Physica A 387, 5317–5325. ( 10.1016/j.physa.2008.05.014) [DOI] [Google Scholar]
- 11.Herrera-Yagüe C, Schneider CM, Couronné T, Smoreda Z, Benito RM, Zufiria PJ, Gonzalez MC. 2015. The anatomy of urban social networks and its implications in the searchability problem. Sci. Rep. 5, 10265 ( 10.1038/srep10265) [DOI] [PMC free article] [PubMed] [Google Scholar]
- 12.Liben-Nowell D, Novak J, Kumar R, Raghavan P, Tomkins A. 2005. Geographic routing in social networks. Proc. Natl Acad. Sci. USA 102, 11 623–11 628. ( 10.1073/pnas.0503018102) [DOI] [PMC free article] [PubMed] [Google Scholar]
- 13.Backstrom L, Sun E, Marlow C. 2010. Find me if you can: improving geographical prediction with social and spatial proximity. In WWW ′10 Proc. 19th Int. Conf. on World Wide Web, Raleigh, North Carolina, 26–30 April, pp. 61–70. New York, NY: ACM; ( 10.1145/1772690.1772698). [DOI] [Google Scholar]
- 14.Simini F, Gonzalez MC, Maritan A, Barabasi A-L. 2012. A universal model for mobility and migration patterns. Nature 484, 96–100. ( 10.1038/nature10856) [DOI] [PubMed] [Google Scholar]
- 15.Granovetter M. 1973. The strength of weak ties. AJS 78, 1360–1380. [Google Scholar]
- 16.Coser RL. 1975. complexity of roles as a seedbed of individual autonomy. In The idea of social structure: essays in honor of Robert Merton. New York, NY: Harcourt, Brace and Jovanovich. [Google Scholar]
- 17.da Cunha BR, González-Avella JC, Gonçalves S. 2015. Fast fragmentation of networks using module-based attacks. PLoS ONE 10, e0142824 ( 10.1371/journal.pone.0142824) [DOI] [PMC free article] [PubMed] [Google Scholar]
- 18.Wandelt S, Sun X, Feng D, Zanin M, Havlin S. 2018. A comparative analysis of approaches to network-dismantling. Sci. Rep. 8, 13513 ( 10.1038/s41598-018-31902-8) [DOI] [PMC free article] [PubMed] [Google Scholar]
- 19.Shekhtman LM, Danziger MM, Havlin S. 2016. Recent advances on failure and recovery in networks of networks. Chaos Solitons Fractals 90, 28–36. ( 10.1016/j.chaos.2016.02.002) [DOI] [Google Scholar]
- 20.Kleinberg JM. 2000. Navigation in a small world. Nature 406, 845 ( 10.1038/35022643) [DOI] [PubMed] [Google Scholar]
- 21.Noah F. 1980. A test of the structural features of Granovetter’s ’strength of weak ties’ theory. Soc. Netw. 2, 411–422. ( 10.1016/0378-8733(80)90006-4) [DOI] [Google Scholar]
- 22.Breigern R, Pattison P. 1978. The joint role structure of two communities’ elites. Sociol. Methods Res. 7, 213–226. ( 10.1177/004912417800700206) [DOI] [Google Scholar]
- 23.da Cunha BR, Gonçalves S. 2018. Topology, robustness, and structural controllability of the Brazilian federal police criminal intelligence network. Appl. Netw. Sci. 3, 36 ( 10.1007/s41109-018-0092-1) [DOI] [PMC free article] [PubMed] [Google Scholar]
- 24.Pool I. 1980. Comment on Mark Granovetter’s ‘The strength of weak ties: a network theory’. Read at the 1980 Meeting of the Int. Communications Association, Acapulco, Mexico.
- 25.Granovetter M. 1983. The strength of weak ties: a network theory revisited. Sociol. Theory 1, 201–233. ( 10.2307/202051) [DOI] [Google Scholar]
- 26.Morales AJ, Borondo J, Losada JC, Benito RM. 2015. Measuring political polarization: Twitter shows the two sides of Venezuela. Chaos 25, 033114 ( 10.1063/1.4913758) [DOI] [PubMed] [Google Scholar]
- 27.Lim M, Metzler R, Bar-Yam Y. 2007. Global pattern formation and ethnic/cultural violence. Science 317, 1540–1544. ( 10.1126/science.1142734) [DOI] [PubMed] [Google Scholar]
- 28.Varshney A. 2008. Ethnic conflict and civic life: hindus and muslims in India. New Haven, CT: Yale University Press. [Google Scholar]
- 29.Horowitz DL. 2011. Ethnic groups in conflict. Berkeley, CA: University of California Press. [Google Scholar]
- 30.Esman MJ. 1979. Ethnic conflict in the western world. London, UK: Cornell University Press. [Google Scholar]
- 31.Thiemann C, Theis F, Grady D, Brune R, Brockmann D. 2010. The structure of borders in a small world. PLoS ONE 5, e15422 ( 10.1371/journal.pone.0015422) [DOI] [PMC free article] [PubMed] [Google Scholar]
- 32.Lazer D. et al. 2018. Computational social science. Science 323, 721–723. ( 10.1126/science.1167742) [DOI] [PMC free article] [PubMed] [Google Scholar]
- 33.González MC, Hidalgo CA, Barabási A-L. 2008. Understanding individual human mobility patterns. Nature 453, 779–782. ( 10.1038/nature06958) [DOI] [PubMed] [Google Scholar]
- 34.Calabrese F, Dahlem D, Gerber A, Paul DD, Chen X, Rowland J, Rath C, Ratti C. 2011. The connected States of America: quantifying social radii of influence. In Proc. IEEE Int. Conf. on Social Computing (SocialCom) Piscataway, NJ: IEEE. [Google Scholar]
- 35.Pew Research Center. 2018. Social media use in 2018, March. See http://www.pewinternet.org/2018/03/01/social-media-use-in-2018/.
- 36.Pew Research Center. 2015. Mobile messaging and social media, 2015 August. See http://www.pewinternet.org/2015/08/19/the-demographics-of-social-media-users/.
- 37.Kallus A, Barankai N, Szüle J, Vattay G. 2015. Spatial fingerprints of community structure in human interaction network for an extensive set of large-scale regions. PLoS ONE 10, e0126713 ( 10.1371/journal.pone.0126713) [DOI] [PMC free article] [PubMed] [Google Scholar]
- 38.Hawelka B, Sitko I, Beinat E, Sobolevsky S, Kazakopoulos P, Ratti C. 2014. Geo-located Twitter as proxy for global mobility patterns. Cartogr. Geogr. Inf. Sci. 41, 260–271. ( 10.1080/15230406.2014.890072) [DOI] [PMC free article] [PubMed] [Google Scholar]
- 39.Frank MR, Mitchell L, Dodds PS, Danforth CM. 2013. Happiness and the patterns of life: a study of geolocated tweets. Sci. Rep. 3, 2625 ( 10.1038/srep02625) [DOI] [PMC free article] [PubMed] [Google Scholar]
- 40.Blanford JI, Huang Z, Savelyev A, MacEachren AM. 2015. Geo-located tweets. enhancing mobility maps and capturing cross-border movement. PLoS ONE 10, e0129202 ( 10.1371/journal.pone.0129202) [DOI] [PMC free article] [PubMed] [Google Scholar]
- 41.Bakillah M, Li R-Y, Liang SHL. 2015. Geo-located community detection in Twitter with enhanced fast-greedy optimization of modularity: the case study of typhoon Haiyan. Int. J. Geogr. Inf. Sci. 29, 258–279. ( 10.1080/13658816.2014.964247) [DOI] [Google Scholar]
- 42.Yin J, Soliman A, Yin D, Wang S. 2017. Depicting urban boundaries from a mobility network of spatial interactions: a case study of Great Britain with geo-located twitter data. Int. J. Geogr. Inf. Sci. 31, 1293–1313. ( 10.1080/13658816.2017.1282615) [DOI] [Google Scholar]
- 43.Menezes T, Roth C. 2017. Natural scales in geographical patterns. Sci. Rep. 7, 45823 ( 10.1038/srep45823) [DOI] [PMC free article] [PubMed] [Google Scholar]
- 44.Amini A, Kung K, Kang C, Sobolevsky S, Ratti C. 2014. The impact of social segregation on human mobility in developing and urbanized regions. EPJ Data Sci. 3, 1–20. ( 10.1140/epjds31) [DOI] [Google Scholar]
- 45.Xiang F, Tu L, Huang B, Yin X. 2014. Region partition using user mobility patterns based on topic model. In 16th Int. Conf. on Computational Science and Engineering Piscataway, NJ: IEEE. [Google Scholar]
- 46.Ratti C, Sobolevsky S, Calabrese F, Andris C, Reades J, Martino M, Claxton R, Strogatz SH. 2010. Redrawing the map of Great Britain from a network of human interactions. PLoS ONE 5, e14248 ( 10.1371/journal.pone.0014248) [DOI] [PMC free article] [PubMed] [Google Scholar]
- 47.Sobolevsky S, Szell M, Campari R, Couronné T, Smoreda Z, Ratti C. 2013. Delineating geographical regions with networks of human interactions in an extensive set of countries. PLoS ONE 8, e81707 ( 10.1371/journal.pone.0081707) [DOI] [PMC free article] [PubMed] [Google Scholar]
- 48.Blondel V, Krings G, Thomas I. 2010. Regions and borders of mobile telephony in Belgium and in the brussels metropolitan zone. Brussels Studies 42 See https://journals.openedition.org/brussels/806#quotation. [Google Scholar]
- 49.Šćepanović S, Mishkovski I, Hui P, Nurminen JK, Ylä-Jääski A. 2015. Mobile phone call data as a regional socio-economic proxy indicator. PLoS ONE 10, e0124160 ( 10.1371/journal.pone.0124160) [DOI] [PMC free article] [PubMed] [Google Scholar]
- 50.Bar-Yam Y. 2016. From big data to important information. Complexity 21, 73–98. ( 10.1002/cplx.v21.S2) [DOI] [Google Scholar]
- 51.Braunstein A, Dall’Asta L, Semerjian G, Zdeborová L. 2016. Network dismantling. Proc. Natl Acad. Sci. USA 113, 12 368–12 373. ( 10.1073/pnas.1605083113) [DOI] [PMC free article] [PubMed] [Google Scholar]
- 52.Ren X-L, Gleinig N, Helbing D, Antulov-Fantulin N. 2018. Generalized network dismantling. CoRR. (http://arxiv.org/abs/1801.01357). [DOI] [PMC free article] [PubMed]
- 53.Girvan M, Newman MEJ. 2002. Community structure in social and biological networks. Proc. Natl Acad. Sci. USA 99, 7821–7826. ( 10.1073/pnas.122653799) [DOI] [PMC free article] [PubMed] [Google Scholar]
- 54.Reichardt J, Bornholdt S. 2006. Statistical mechanics of community detection. Phys. Rev. E 74, 016110 ( 10.1103/PhysRevE.74.016110) [DOI] [PubMed] [Google Scholar]
- 55.Blondel VD, Guillaume J-L, Lambiotte R, Lefebvre E. 2008. Fast unfolding of communities in large networks. J. Stat. Mech. 2008, 10008 ( 10.1088/1742-5468/2008/10/P10008) [DOI] [Google Scholar]
- 56.Newman MEJ. 2006. Modularity and community structure in networks. Proc. Natl Acad. Sci. USA 103, 8577–8582. ( 10.1073/pnas.0601602103) [DOI] [PMC free article] [PubMed] [Google Scholar]
- 57.Barabási A-L. 2016. Network science. Cambridge, UK: Cambridge University Press. [Google Scholar]
- 58.Baeza-Yates R, de Ribeiro BAN. 2011. Modern information retrieval. New York, NY: ACM Press. [Google Scholar]
- 59.Manning C, Raghavan P, Schütze H. 2010. Introduction to information retrieval. Nat. Lang. Eng. 16, 100–103. ( 10.1017/S1351324909005129) [DOI] [Google Scholar]
- 60.Tipping ME, Bishop CM. 1999. Probabilistic principal component analysis. J. R. Stat. Soc. B (Stat. Methodol.) 61, 611–622. ( 10.1111/rssb.1999.61.issue-3) [DOI] [Google Scholar]
- 61.van der Maaten L, Hinton G. 2008. Visualizing data using t-SNE. J. Mach. Learn. Res. 9, 2579–2605. [Google Scholar]
- 62.Van Der Maaten L. 2014. Accelerating t-SNE using tree-based algorithms. J. Mach. Learn. Res. 15, 3221–3245. [Google Scholar]
- 63.Bohlin L, Edler D, Lancichinetti A, Rosvall M. 2014. Community detection and visualization of networks with the map equation framework. In Measuring scholarly impact (eds Y Ding, R Rousseau, D Wolfram). Cham, Switzerland: Springer.
- 64.Artiles J, Gonzalo J, Sekine S. 2007 The Semeval-2007 Weps evaluation: establishing a benchmark for the web people search task. In SemEval ′07 Proc. of the 4th Int. Workshop on Semantic Evaluations, Prague, Czech Republic, 23–24 June, pp. 64–69. Stroudsburg, PA: Association for Computational Linguistics.
- 65.Hubert L, Arabie P. 1985. Comparing partitions. J. Classif. 2, 193–218. ( 10.1007/BF01908075) [DOI] [Google Scholar]
- 66.Fowlkes EB, Mallows CL. 1983. A method for comparing two hierarchical clusterings. J. Am. Stat. Assoc. 78, 553–569. ( 10.1080/01621459.1983.10478008) [DOI] [Google Scholar]
- 67.Zappavigna M. 2015. Searchable talk: the linguistic functions of hashtags. Social Semiotics 25, 274–291. ( 10.1080/10350330.2014.996948) [DOI] [Google Scholar]
- 68.Barabási A-L, Albert R. 1999. Emergence of scaling in random networks. Science 286, 509–512. ( 10.1126/science.286.5439.509) [DOI] [PubMed] [Google Scholar]
- 69.Watts DJ, Dodds PS, Newman MEJ. 2002. Identity and search in social networks. Science 296, 1302–1305. ( 10.1126/science.1070120) [DOI] [PubMed] [Google Scholar]
- 70.Mitzenmacher M. 2004. A brief history of generative models for power law and lognormal distributions. Internet Math. 1, 226–251. ( 10.1080/15427951.2004.10129088) [DOI] [Google Scholar]
- 71.Zipf GK. 1946. The P1 P2/D hypothesis: on the intercity movement of persons. Am. Sociol. Rev. 11, 677–686. ( 10.2307/2087063) [DOI] [Google Scholar]
- 72.Krueckeberg DA, Silvers AL. 1974. Urban planning analysis: methods and models. New York, NY: Wiley. [Google Scholar]
- 73.Scellato S, Noulas A, Lambiotte R, Mascolo C. 2011. Socio-spatial properties of online location-based social networks. In Fifth Int. AAAI Conf. on Weblogs and Social Media Barcelona, Spain, 17–21 July Palo Alto, CA: AAAI Press. [Google Scholar]
- 74.Di Leo M, Smith E. 1980. Two Californias: the myths and realities of a state divided against itself. Covelo, CA: Island Press. [Google Scholar]
- 75.Bucholtz M, Bermudez N, Fung V, Edwards L, Vargas R. 2007. Hella nor cal or totally so cal?: the perceptual dialectology of California. J. Engl. Linguist. 35, 325–352. ( 10.1177/0075424207307780) [DOI] [Google Scholar]
- 76.Meinig DW. 1965. The Mormon culture region: strategies and patterns in the geography of the American west, 1847–1964. Ann. Assoc. Am. Geogr. 55, 191–219. ( 10.1111/j.1467-8306.1965.tb00515.x) [DOI] [Google Scholar]
- 77.Zelinsky W. 1973. The cultural geography of the United States. Englewood Cliffs, NJ: Prentice-Hall. [Google Scholar]
- 78.Woodard C. 2011. American nations: a history of the eleven rival regional cultures of North America. New York, NY: Penguin Books. [Google Scholar]
- 79.Han E, et al. 2017. Clustering of 770,000 genomes reveals post-colonial population structure of North America. Nat. Commun. 8, 14238 ( 10.1038/ncomms14238) [DOI] [PMC free article] [PubMed] [Google Scholar]
- 80.Nelson GD, Alasdair R. 2016. An economic geography of the united states: from commutes to megaregions. PLoS ONE 11, e0166083 ( 10.1371/journal.pone.0166083) [DOI] [PMC free article] [PubMed] [Google Scholar]
- 81.Gray V, Hanson RL, Kousser T (eds). 2018. Politics in the American States: a comparative analysis, 11th edn Beverley Hills, CA: SAGE. [Google Scholar]
- 82.Johnston R, Manley D, Jones K. 2016. Spatial polarization of presidential voting in the United States, 1992–2012: the ‘big sort’ revisited. Ann. Am. Assoc. Geogr. 106, 1047–1062. ( 10.1080/24694452.2016.1191991) [DOI] [Google Scholar]
- 83.Pew Research Center. 2014. Political polarization in the American public, June See http://www.people-press.org/2014/06/12/political-polarization-in-the-american-public/.
- 84.Ercan SA, Hendriks CM. 2013. The democratic challenges and potential of localism: insights from deliberative democracy. Policy Stud. 34, 422–440. ( 10.1080/01442872.2013.822701) [DOI] [Google Scholar]
Associated Data
This section collects any data citations, data availability statements, or supplementary materials included in this article.
Supplementary Materials
Data Availability Statement
Data are available at: https://necsi.edu/fragmentation-data.


