

Summary
We developed a universal method termed OnCELISA to detect cytokine secretion from individual cells by applying a capture technology on the cell membrane. OnCELISA uses fluorescent magnetic nanoparticles as assay reporters that enable detection on a single-cell level in microscopy and flow cytometry and fluorimetry in cell ensembles. This system is flexible and can be modified to detect different cytokines from a broad range of cytokine-secreting cells. Using OnCELISA we have been able to select and sort highly cytokine-secreting cells and identify cytokine-secreting expression profiles of different cell populations in vitro and ex vivo. We show that this system can be used for ultrasensitive monitoring of cytokines in the complex biological environment of atherosclerosis that contains multiple cell types. The ability to identify and select cell populations based on their cytokine expression characteristics is valuable in a host of applications that require the monitoring of disease progression.
Subject Areas: Sensor, Biotechnology, Cell, Nanomaterials
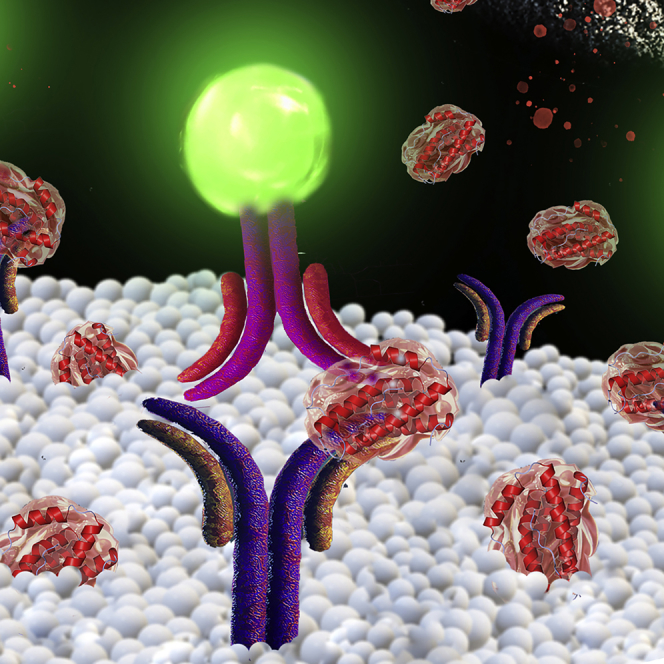
Graphical Abstract
Highlights
-
•
We developed an assay for detecting cytokine secretion from individual cells
-
•
This system is universal to detect different cytokines from a broad range of cell types
-
•
The assay can select highly cytokine-secreting cells and purify their populations
-
•
This study opens a host of applications for monitoring disease progression
Sensor; Biotechnology; Cell; Nanomaterials
Introduction
Probing how cells secrete cytokines as they respond to the surrounding signals is a major challenge (Liu et al., 2016, Zhao et al., 2011). Given the important roles of cytokines across the biological spectrum, including the control of cell replication and apoptosis, cancer, atherosclerosis, and tissue regeneration and in the modulation of immune reactions (Müller et al., 2002, Nicola, 1994), it is critical to advance the understanding of the heterogeneity of cellular cytokine release at the level of single cells (Bienvenu et al., 2000). This inspired us to create a simple and sensitive single-cell cytokine analysis platform that enables a nuanced characterization of individual cytokine-secreting cells as well as quantitative analysis of cytokines secreted from each cell. Our new approach is sensitive; it does not appreciably affect cell secretion, and labeled cells are able to proliferate.
The current leading approach for cytokine detection is enzyme-linked immunosorbent assays (ELISA), which detects average cytokine concentration in solutions of culture media, blood, plasma, synovial fluid, or homogenized cell lysates or tissues, typically in the picomolar range (Schenk et al., 2001). An example commercial assay (Achard et al., 2003) detects mouse interleukin (IL)-6 cytokine with a sensitivity of 18.2 pg mL−1 in a 5-μL sample, whereas a high-throughput multiplex Illumina technology detects a panel of 96 cytokines at concentrations from 0.5 pg mL−1 to 14 pg mL−1 in 50-μL samples (Quinn et al., 2008). These assays cannot detect specific cytokine secretions from single cells and only provide information about the average cytokine concentration, which reflects the total expression over time (dependent on the stability of the measured protein). Cellular cytokine assays typically use intracellular transport inhibitors such as brefeldin A (Biosciences), which prevent cytokine release, and consequently kill the cells, considerably limiting the scope of their application. Inhibitor-free technologies (Brosterhus et al., 1999, Wilson et al., 2007) have only been demonstrated in T cells.
Here, we present a universal approach to highly sensitive detection of trace cytokine secretions from individual, single live cells, which we call “OnCELISA.” Our OnCELISA assay extends the ELISA approach by utilizing the cell surface to capture the secreted molecules where they can be detected by fluorescent labeling. Such cell-surface affinity sensors have been previously used to detect antigen binding (Rider et al., 2003), ATP release (Beigi et al., 1999), the presence of growth factors (Zhao et al., 2011), abundant cytokines (Holmes and Al-Rubeai, 1999, Manz et al., 1995), and other targets (Ali et al., 2012, Jiang et al., 2015). We have been able to create capture surfaces on cell membranes that do not affect cell secretion and enable proliferation. Transcending the previously published work, we have been able to introduce fluorescent magnetic nanoparticles as assay reporters. This enhances the sensitivity of OnCELISA to 0.1 pg mL−1, which is 10-fold more sensitive than with standard fluorophore labels. Our assay uniquely combines the advantages of both cell-surface affinity capture (Kenney et al., 1995) and magnetic cell sorting/separation (Tibbe et al., 2002). Using mathematical modeling and single-cell experiments, we confirmed that OnCELISA predominantly detects cytokine secretions from the same cell where they were captured.
With these new capabilities of OnCELISA we were able (1) to assess the ability of individual cells to secrete cytokines, (2) to distinguish highly secreting cells from poorly secreting ones, and (3) aided by fluorescence in situ hybridization labeling of the relevant messenger RNA, to provide insights into the cytokine secretion dynamics, in particular on the existence of early and late responders to cytokine stimulation. Furthermore, brightly fluorescent OnCELISA magnetic bead labeling made it possible to detect the ex vivo secretion of IL-6 from multi-cellular atherosclerotic plaque-containing mouse aortae. OnCELISA ex vivo was responsive to an inflammatory stimulus and to an increase in the stage of atherosclerotic disease development. The capability to select cells with a range of cytokine secretion levels and the ability to purify cell populations through identification of cellular expression levels on a single-cell basis may have significant implications for future cell therapy applications and for tracking disease progression in preclinical models.
Results
Engineering and Testing the Cell-Surface Cytokine OnCELISA Assay
We designed our cytokine capture surface as shown in Figure 1A. In our approach, cells first undergo surface biotinylation followed by the attachment of neutravidin and a biotinylated IL-6 capture antibody to form the capture surface (Holmes and Al-Rubeai, 1999). The capture surface enables the cytokine molecules secreted by cells to be immobilized on the cell surface immediately upon their release, before they become diluted in the medium. These captured cytokines are then visualized by fluorescent magnetic particles functionalized with detection antibodies. Their fluorescence signal indicates the amount of cytokine secretion (Figures 1B and 1C) (see Transparent Methods). The two antibodies required for OnCELISA (capture and detection) are raised to different epitopes of the target cytokine. Importantly, as we show later, the cells are not affected and can be cultured after the application of OnCELISA.
Figure 1.

OnCELISA Assay
(A) Assay schematics where magnetic fluorescent nanoparticles are captured by antibodies on the biotinylated surface of cells. (B and C) Assay implementation in RAW cells shown by confocal laser scanning microscopic images at two magnifications. Green indicates successful OnCELISA labeling with fluorescent magnetic nanoparticles; blue, Hoechst; red, cell mask deep red membrane staining.
The design of the OnCELISA affinity surface was verified by using BV2 microglial cells. Figures S1A–S1C show that the capture antibody is uniformly distributed on the cell surface. The IL-6 detection antibody conjugated to fluorescent magnetic nanoparticles (Dragon Green superparamagnetic iron oxide, DG SPIO) via amide bonds displays similar fluorescence as the unconjugated DG SPIO (Figure S1D). The attachment of antibodies to the fluorescent magnetic nanoparticles was further confirmed by their increased hydrodynamic size (951 ± 15 nm before and 989 ± 10 nm after conjugation) and by zeta-potential measurements (Figure S2). The DG SPIO-conjugated IL-6 antibodies (DG SPIO IL-6 Ab) retain their affinity to IL-6 upon conjugation as seen in Figure S3A. The calibration curve in Figure S3B indicates that the OnCELISA assay with fluorimetry readout is able to detect IL-6 down to 0.1 pg mL−1, with a linear range between 0.1 and 1,000 pg mL−1.For comparison, the low detection limit of mouse IL-6 in a BD OptEIA ELISA kit is 3.8 pg mL−1, whereas the Cisbio Bioassays product can detect 18.2 pg mL−1(Achard et al., 2003). The assay design was additionally confirmed using lipopolysaccharide (LPS) stimulation, as shown in Figure S4 where we also verified negligible (5%) non-specific adsorption and/or uptake of the DG SPIO IL-6 Ab particles (see Table S1 for a summary of control experiments). Figures S5 and S6 show the location of OnCELISA labeling, mostly on cell surface, with some cell-type-dependent nanoparticle uptake occurring after labeling, which does not affect the assay reading (Betzer et al., 2015). The OnCELISA labeling of cells was stable after 12 h at 4°C. All these characterizations indicate that the level of OnCELISA labeling reflects the level of cytokine secretion from each cell.
Cytokine Secretion from BV2 Cells following Cell Stimulation with Lipopolysaccharide
We characterized IL-6 cytokine secretion from the BV2 cell line by OnCELISA following LPS stimulation (Figures 2A–2C). Figure 2B shows that only some cells were labeled by OnCELISA, which may indicate that only this portion of cells were expressing high enough amounts of IL-6. The results of fluorescent in situ hybridization of the IL-6 mRNA expression (Figures 2E–2G) also indicate variable expression of IL-6 mRNA in different cells. We verified that the affinity surface on a cell preferentially captures IL-6 from this cell and not from the solution. To show this, OnCELISA was applied to cells with the capture surface antibody as in Figure 1A, but without LPS stimulation. A high concentration of IL-6 of 200 pg mL−1 (100 times higher than the concentration of IL-6 in body fluids) was then spiked into the medium, following by the DG SPIO_IL-6_Ab. No labeling on the cell surface was observed in microscopic imaging (Figure 2D). This is consistent with the IL-6 capture antibody on the surface of a cell preferentially capturing the IL-6 molecules from this particular cell immediately after secretion. The capture occurs when the IL-6 molecules are still present in high concentration near the cell membrane, before they diffuse away. This was confirmed using mathematical modeling of OnCELISA (see Transparent Methods for vesicular model of cytokine release). These features of the OnCELISA assay make it possible to differentiate cells secreting high amounts of IL-6 from poorly secreting cells. Furthermore, we used OnCELISA to monitor the time course of cytokine secretion in functionalized cells stimulated by LPS. The presence of IL-6 released by the cells into the cell culture medium was consistent with the results of our IL-6 mRNA assay (Figures 2E and 2F) and confirmed by a standard ELISA assay (Figure 2H). Both ELISA and OnCELISA indicate that IL-6 secretion by BV2 cells (for cell density of 2.0 × 10⁶ +/− 0.16 cells per mL) increased with the LPS stimulation time, and a maximum level of IL-6 (∼493 pg/mL) was obtained with LPS stimulation for 8 h, thereby further validating OnCELISA. The secretion rate was constant in the first 4 h, estimated to be 0.6 ± 0.2 molecule/s per cell (Figure 2H).
Figure 2.

Characterization of LPS-Stimulated BV2 Cells
(A–D) Combined differential interference contrast (DIC) and confocal laser scanning microscopy images of BV2 cells incubated with OnCELISA labeling (with nucleus Hoechst staining in blue) after 8-h LPS stimulation, before (A) and after treatment (B and C) with DG SPIO_IL-6_Ab (green) at different magnifications; (D) functionalized cells without LPS stimulation after spiking 200 pg mL−1 IL-6 to the medium solution followed by adding the DG SPIO_IL-6_Ab.
(E and F) IL-6 mRNA expression in BV2 cells detected by fluorescence in situ hybridization staining (orange, AlexFluor 555; blue, DAPI nuclear stain). Cells were incubated with biotin-incorporated IL-6 cRNA probes at 0 h (E) and 2 h (F) following LPS stimulation and labeled by streptavidin-AlexaFluor 555 IL-6. At both time points, the cells were expressing varying levels of mRNA (very low expression, blue arrow; low expression, green arrow; high expression, orange arrow; very high expression, red arrow).
(G) Fluorescence intensity histograms (from over 1,000 cells) of mRNA expression in these four classes of cells for 0 h LPS (top) and 2 h LPS (bottom), with relative brightness limits indicated in the figure.
(H and I) (H) ELISA of IL-6 for cells after LPS stimulation for different periods of time, and fluorescence intensity for DG SPIO_IL-6_Ab-labeled cells (OnCELISA) with LPS stimulation for different periods of time (data between 9 and 20 h was not collected because of no laboratory access at midnight); (I) combined DIC and confocal laser scanning images of a single-cell chip with wells holding individual cells stained for nuclei (blue, Hoechst), IL-6 mRNA (red), and OnCELISA (green).
Next, we carried out the OnCELISA assay in a microfluidic chip in which each cell is located in an individual well, separated from its neighbor by a distance of 25 μm. The percentage of the OnCELISA-labeled cells was 38% ± 8%, similar to the labeled fraction in suspended cells discussed below (example results are shown in Figure 2I). Using this chip we also verified that OnCELISA labeling was observed in the cells that are simultaneously labeled for IL-6 mRNA (Figures 2E–2G). We found that, generally, more cells were positive for IL-6 mRNA expression than for IL-6 OnCELISA with 2-h LPS stimulation. This is consistent with the expression of IL-6 mRNA being only one of many rate-limiting steps in the process of cellular expression of the IL-6 protein.
Mathematical Modeling Predicts That OnCELISA on a Single Cell Preferentially Detects Own Secreted Cytokine Molecules
We explored whether the OnCELISA assay on a specific cell captures the cytokines that originate from that particular cell or cytokines secreted by adjacent cells. To this aim, we developed a mathematical model of cytokine secretion from cells (Lacy and Stow, 2011) (see Transparent Methods for details). The model assumes that the cytokines are released from small (<1 μm) secretory vesicles composed of a high (millimolar range) concentration of cytokines (Stow et al., 2009). Once released, the cytokines form a hemispherical cloud of molecules diffusing away from the cell, with a radius of . Here D is the diffusion constant and t is time since the moment of vesicle rupture. The model makes it possible to estimate the local cytokine concentration at the cell surface, which is transiently much higher than the average in the medium. The interaction of cytokines released from the vesicles is further described using conventional chemical kinetics to evaluate the time constant for the cytokine-binding reaction. The results suggest that the cytokine reaction kinetics is very fast, because the OnCELISA capture surface is on the cell membrane, where the cytokine release produces a transiently high cytokine concentration. In our experimental conditions, we estimate that the binding time constant of 0.4–1.6 s and 63% achievable binding to the affinity surface will take place in the region of radius of 1.3–2.0 μm from the ruptured vesicle. This means that OnCELISA on a cell that is isolated from other cells by more than 2 μm detects only its own cytokines.
OnCELISA-Labeled Highly Cytokine-Secreting Cells Form a Clear Subpopulation that Can Be Purified
We further demonstrated that the OnCELISA assay is compatible with flow cytometry, so it may be used for rapidly screening large numbers of cells, distinguishing cell subpopulations, and selecting target cells (Foster et al., 2007). The OnCELISA assay was applied to BV2 cells, and a subsequent flow cytometry measurement showed that the OnCELISA clearly labels the cells into a distinguishable population, as shown in Figure 3B, with 38% of the cells in the DG SPIO_IL-6_Ab population. However, the control cells which were treated with OnCELISA but without the attachment of biotinylated anti IL-6 Ab, did not show the cell population with the fluorescence labelling (Figure 3A). No OnCELISA labelling was observed in the confocal imaging of the control cells either (Figure 3C). We have also shown that OnCELISA is compatible with an alternative cell selection methodology, magnetic sorting. Starting from the same LPS-stimulated BV2 cells we were able to select the OnCELISA-labeled subpopulation with a magnetic pen (see Transparent Methods). As shown in Figures 3D and 3F the OnCELISA labeling efficiency (percentage labeled cells) and hence detectable cytokine-secreting cells is about 32% ± 8%, consistent with the values obtained by flow cytometry and with single-cell chip data 38% ± 8% (Figure 2I). The OnCELISA labeling efficiency increased to about 72% ± 8% after magnetic sorting (Figures 3E and 3F). Thus, the majority of the labeled cells can be sorted by flow cytometry or by magnetic sorting.
Figure 3.

OnCELISA Labeling of LPS-Stimulated BV2 Cells
(A–F) Flow cytometry results for (A) control and (B) cells labeled with DG SPIO_IL-6_Ab (OnCELISA). Confocal laser scanning microscopy images for (C) control, (D) cells labeled with OnCELISA after treatment with LPS, (E) cells selected out after application of magnetic sorting, and (F) the fluorescent count of control and cells labeled with OnCELISA before and after magnetic sorting.
The Progeny of Sorted, Highly Secreting Cells Inherits High Secretion
The OnCELISA-labeled magnetically sorted BV-2 cells were cultured further to establish cell viability and proliferation potential. Figures 4A and 4B confirm that cells labeled with DG SPIO_IL-6_Ab can proliferate, as apparent from the formation of a cell cluster. The sorted cells were then cultured, and the OnCELISA labeling was applied again, as described in Transparent Methods. Using a fluorescein isothiocyanate (FITC)-avidin assay we verified that the progeny of the sorted cells remained (partly) biotinylated (Figure S7). Figure 4C shows the confocal images of the OnCELISA-labeled progeny of the previously sorted cells. The labeling efficiency was 59% ± 8%, which is much higher than the 32% ± 8% observed in the unsorted cells. This result indicates that the capacity of the cells to secrete high levels of IL-6 is inheritable. The retention of high IL-6 secretion was also confirmed by ELISA. Figure 4D shows that the IL-6 concentration secreted by the selected BV2 cells is about twice that of the BV2 cells before selection, in close agreement with the OnCELISA labeling ratio. Interestingly, the selected BV2 cells can secrete IL-6 (∼0.04 pg mL−1 per cell) without LPS stimulation. The OnCELISA-positive cell subpopulation before and after selection was additionally characterized to document whether biological differences exist with unsorted cells. Figures 4F and 4H show that the size histogram of the selected cells shows a higher proportion of small cells compared with the histogram before the selection (Figure 4E, 4G). This means that OnCELISA does not select senescent cells that are typically larger (Childs et al., 2015, Starr et al., 2009), but may select the smaller and younger cells.
Figure 4.

Differential Interference Contrast (DIC) Microscopy Images of Sorted BV2 Cells after Incubation with OnCELISA
(A) 3 days and (B) 7 days; (C) combined DIC and confocal laser scanning microscopy images of Dragon Green SPIO_IL-6_Ab-labeled progeny of highly cytokine-secreting BV2 cells previously magnetically selected using OnCELISA. The progeny cells have grown for 7 days after magnetic selection, and they were biotinylated again before labeling.
(D) Changes in IL-6 concentration with LPS stimulation time for all BV2 cells and OnCELISA-selected BV2 cells.
(E–H) Histograms of cell area for all BV2 cells and OnCELISA-labeled BV2 cells before and after magnetic selection. The x and y axes of (E–H) are the same.
Universal OnCELISA that Is Applicable to Other Cell Types and to Other Secreted Products and Can Simultaneously Detect More than One Cytokine
To present a proof of concept of wide applicability of OnCELISA we applied the assay to other cell types and other secreted proteins. To this aim, we prepared the IL-6 capture surface shown in Figure 1 on RAW cells and on adipose-derived mesenchymal stem cells (MSCs). The results of the OnCELISA assay for these cells are shown in Figures 1B, 1C, and S8. Owing to lower IL-6 secretion, the level of OnCELISA labeling for these two types of cell lines was lower than that for the BV2 cells (Figure S9). We have also tested that OnCELISA can detect the secretion of another important cytokine, IL-1β (Figure S10). In addition, we verified that OnCELISA can be simultaneously used with two different color particles and two cytokines (Figure S11). The ability of OnCELISA to detect more than a single cytokine is important as cytokines often work synergistically (Kulbe et al., 2012).
OnCELISA Detecting Cytokine IL-6 from Aortic Cells in a Murine Model of Atherosclerosis
We next demonstrated that OnCELISA could be used for the detection of cytokine IL-6 secreted ex vivo from multi-cellular aortae containing atherosclerotic plaque. Atherosclerosis is an inflammatory-driven disease characterized by the deposits of inflammatory cells within the artery wall. The apolipoprotein E−/− mouse spontaneously develop atherosclerotic plaques in their aortae. OnCELISA provided robust detection of IL-6 using flow cytometry (FITC-positive cells) in single-cell suspensions of digested plaque-containing aortic tissue. In accordance with an increase in inflammation, more aortic cells were found to be FITC positive following stimulation with LPS in aortae from mice (Figures 5A–5C), when compared with phosphate-buffered saline non-stimulated control aortae.
Figure 5.

Detection of IL-6 Using OnCELISA in Atherosclerotic Plaque-Containing Mouse Aortae
Apolipoprotein E−/− mice were fed a standard chow diet for 16 weeks to promote atherosclerotic plaque development in their aortae. Excised aortae were digested into single-cell suspensions, and flow cytometry was used to detect the number of viable IL-6-expressing (FITC-positive) cells. (A and B) Dot blots gated on viable cell number demonstrating the presence FITC-positive aortic cells following incubation with (A) phosphate-buffered saline (PBS) or (B) LPS and (C) the change in FITC signal with LPS treatment. * denotes statistical significance, p < 0.06.
Discussion
Cytokines secreted from cells play a critical role in controlling cell survival, growth, migration, development, differentiation, and function by binding with specific cytokine receptors and initiating their complex signaling events (Hafler, 2007, Whicher and Evans, 1990, Young, 2009). They are heterogeneously released, creating a unique signaling microenvironment around the reactive and responding cells (Schenk et al., 2001). At the cellular level, a few secreted cytokine molecules may be sufficient to induce a significant cellular response (Gurevich et al., 2003). This strength of the cytokine effect causes the study of cytokine secretion to be experimentally challenging (Stenken and Poschenrieder, 2015), even more so that they are soluble proteins that once released from the cell diffuse away and become diluted in culture media, blood, or other tissue fluids, depending on the site of secretion.
Current single-cell analysis methods capable of analyzing secreted products include enzyme-linked immune absorbent spot (ELISPOT) (Streeck et al., 2009), droplet cytometry (Joensson and Svahn, 2012), encapsulation in microbeads (Turcanu and Williams, 2001), microengraving (Love et al., 2006), and single-cell barcode microchip (Fan et al., 2008). Their disadvantages were discussed in Han et al. (2010). In particular, in ELISPOT the cells are sparsely spread over a surface with immobilized capture antibodies and immobilized secretion products detected by a colorimetric reaction. In this approach accuracy is limited as individual spots may overlap or single cells may cluster. Furthermore, the cells are lost during the process (Han et al., 2010). Droplet cytometry (Joensson and Svahn, 2012), wherein cells are individually contained and analyzed in droplets, is not capable for absolute quantification of secreted proteins owing to the lack of calibration approaches and challenges in loading single cells (Han et al., 2010). Encapsulation in microbeads (Turcanu and Williams, 2001) may introduce cross-contamination among cells, may perturb secretion (as cells may need to be cooled to 4° to achieve agarose gelling), and requires additional processing to recover cells (Han et al., 2010). Microengraving introduced in Love et al. (2006) isolates individual cells in a dense, elastomeric array of custom-made microwells (∼100 pL). The microwells are then sealed by glass slides coated with capture reagents. The slides undergo postprocessing with detection reagents and are read out by a fluorescent scanner. Microengraving requires careful manipulation of glass slides so that there is no cross-contamination of detection spots with fluid from adjacent wells, or without stimulating or dislodging single cells. Its low throughput and difficulties of automation have limited its widespread adoption. Single-cell barcode microchips (Fan et al., 2008) use custom-made microfluidic microchambers pre-printed with antibodies. Cell delivery and deposition in wells is challenging, and the system has low throughput. Intracellular staining (Jung et al., 1993) blocks cytokine secretion, and cells cannot be analyzed when live as membrane permeabilization is required. The cell is tested when prohibited from secretion, which may not accurately reflect secretion of a live cell. In contrast to these methods, OnCELISA does not require custom-made microfluidics and only uses commercially available reagents. Cells are tested live, and they do not require postprocessing to be able to proliferate. The method is fully compatible with flow cytometry, enabling cell selection. Quantification of secreted products and calibration is also possible.
The cellular secretion assay presented here, uses fluorescence detection so that the cells can be interrogated individually by fluorescence microscopy, flow cytometry, or as an ensemble by fluorimetry. The accuracy of OnCELISA analysis on a single-cell level is affected by any variation in biotinylation of live cells, anchoring of capture probes, cytokine binding, and secondary reporter binding. The extent of these variations is reflected in the size of error bars in Figure S3B, where OnCELISA was applied to exact replicates of cell ensembles at a number of IL-6 concentrations introduced by spiking. It shows that the assay reproducibility is high, with average variation of 11%.
Low number of copies of individual target molecules combined with the unavoidable presence of cellular autofluorescence background pose a challenge for fluorescence detection, which can be addressed by using bright labeling or amplification (Lei and Ju, 2012). In this work, we chose to use bright and relatively large (few hundred nanometers) nanoparticle labels (Deng and Goldys, 2014). Owing to the brightness of our labels, the OnCELISA assay is sensitive enough (0.1 pg/mL) to detect cytokines secreted by single cells. This is an advance over standard single-cell analysis method such as microengraving where conventional sandwich immunofluorescence detection offers sensitivity of ∼1 ng/mL, or 10 pM, for most soluble proteins (Herrera et al., 2019) (for example, Love et al., 2006, reports the lowest detected cytokine concentration to be 4 ng/mL). Recently, microengraving with quantum dot (QD) nanomaterials as assay reporters, chemical amplification (more than one QD per antibody), and single-particle counting achieved the limit of detection of 60 aM for tumor necrosis factor-α (Herrera et al., 2019). This is about two orders of magnitude lower than reported in this work, pointing to possible improvements in the OnCELISA assay where chemical amplification and single-particle counting can also be applied.
Being able to probe how the individual cells secrete cytokines makes it possible to detect how they respond to the surrounding signals such as LPS stimulation, on the relevant timescale of several hours. Our results shown in Figure 2H make it possible to calculate the secretion frequency from single BV2 cells in the first 4 h when the secretion rates were approximately constant. We obtained secretion rates of 0.6 ± 0.2 molecules/s per cell. This corresponds closely to the cellular IL-6 secretion rate of 0.5 molecules/s per cell reported in Han et al. (2010) for peripheral blood mononuclear cells. Close similarity of these values lends support to the argument that cytokine secretion rates are not affected by the OnCELISA processing of cells. The flexibility of simultaneous monitoring of multiple secreted cytokines (IL-6 and IL-1β) provides an exciting opportunity to explore the “immune synapse” in far greater detail than previously possible.
Importantly, our design only uses commercially available reagents, so it can be easily reproduced in other laboratories. Its universal capture surface is applicable to various cytokines (here, IL-6 and IL1-β) and is potentially suitable for a broad range of cell types (including BV2, RAW, and MSC cell lines presented here) that secrete cytokines or other protein. OnCELISA also demonstrated robust ex vivo detection of IL-6 secretion from the aortae of mice that contained atherosclerotic plaque. Atherosclerotic plaque is a complex biological environment that contains multiple cell types. OnCELISA was able to be used on plaque-containing aortae digested into a single-cell suspension to capture and detect the expression of IL-6 from a multi-cellular environment, without the need prepare a cell homogenate as current commercial ELISAs do. This enables the unique capability to characterize the different cells further, whether it be in functional assays or using confocal microscopy, for example.
The immunosensing scheme in this work uses a sandwich immunoassay, similar to a range of commercial ELISA systems. Our approach may make it possible to make these standard ELISA assays more sensitive and convert them into the OnCELISA format. Selection of high cytokine-producing cell populations is an important first step in the characterization of the mechanisms underpinning critical heterogeneity in cytokine signaling. The capability to select highly cytokine-expressing cells in complex biological diseases is also valuable for future cellular therapies using cells selected to optimize their specific properties. Such populations may also be therapeutically useful, for example, by interfering with the opposite immune response near the diseased site. Such selected cell populations have traditionally been delivered by rounds of limiting dilution cloning, followed by product analysis. However, these methods are labor intensive, costly, time consuming, and have low efficiency. In contrast, our OnCELISA assay, which detects and measures single-cell secretion of specific cytokines using fluorescent magnetic particles, makes it possible to select cells with optimized cytokine secretion rapidly and efficiently.
Limitations of the Study
The OnCELISA method presented here is able to probe how individual cells secrete cytokines as they respond to the environmental cues. In addition, the OnCELISA method has the capacity for simultaneously testing the secretion of multiple cytokines, demonstrated using two cytokines IL-6 and IL-1β. Our system can be used for ultrasensitive monitoring of cytokines in the complex biological environment of atherosclerosis that contains multiple cell types. We believe this study will be of interest to a broad community of researchers from areas of cell biology to oncology. In this study the cells did not perform to the internalization of capture antibodies attached to the cell surface. We cannot rule out the possibility that the attached capture antibodies were internalized by certain cell types. To provide further evidence of non-antibody internalization of capture antibodies, validation of OnCELISA using a spectrum of cell types would be required.
Methods
All methods can be found in the accompanying Transparent Methods supplemental file.
Acknowledgments
This work was financially supported by funding from the ARC Future Fellowship (FT160100039 to G.L.), the ARC Center of Excellence for Nanoscale BioPhotonics (CE140100003 to E.M.G. and M.R.H.), UNSW Biomedical Engineering Seed Fund to G.L., and the National Natural Science Foundation of China (Grant 21575045) to G.L., Macquarie University MQRDG to G.L. and the Heart Research Institute to S.P.C. and M.M.K..
Author Contributions
G.L. and E.M.G. conceived and designed the experiments. G.L. carried out the preparation and characterization of OnCELISA and data analysis. E.M.G. performed the theoretical modeling of OnCELISA and data analysis. S.P.C., M.M.K., and C.B. designed and performed aortic cell extraction and data analysis. G.L. and A.G.A. obtained confocal images of cells. L.M.P. performed IL-6 mRNA expression staining and confocal images. S.F., G.L., and D.W.I. designed and made the single-cell wells. G.L. and K.Z. performed the characterization of capture antibodies on cell surfaces. M.H. and E.M.G. performed imaging analysis. M.R.H. provided guidance on cell type selection. G.L, E.M.G., S.C., and M.R.H wrote the manuscript. All authors reviewed and edited the manuscript.
Declaration of Interests
The authors declare that no competing interests.
Published: October 25, 2019
Footnotes
Supplemental Information can be found online at https://doi.org/10.1016/j.isci.2019.09.019.
Contributor Information
Guozhen Liu, Email: guozhen.liu@unsw.edu.au.
Ewa M. Goldys, Email: e.goldys@unsw.edu.au.
Supplemental Information
References
- Achard S., Jean A., Lorphelin D., Amoravain M., Claret E.J. Homogeneous assays allow direct" in well" cytokine level quantification. Assay Drug Dev. Tech. 2003;1:181–185. doi: 10.1089/154065803321537908. [DOI] [PubMed] [Google Scholar]
- Ali M.M., Kang D.K., Tsang K., Fu M., Karp J.M., Zhao W. Cell-surface sensors: lighting the cellular environment. Wiley Interdiscip. Rev. Nanomed. Nanobiotechnol. 2012;4:547–561. doi: 10.1002/wnan.1179. [DOI] [PMC free article] [PubMed] [Google Scholar]
- Beigi R., Kobatake E., Aizawa M., Dubyak G.R. Detection of local ATP release from activated platelets using cell surface-attached firefly luciferase. Am. J. Physiol. Cell Physiol. 1999;276:C267–C278. doi: 10.1152/ajpcell.1999.276.1.C267. [DOI] [PubMed] [Google Scholar]
- Betzer O., Meir R., Dreifuss T., Shamalov K., Motiei M., Shwartz A., Baranes K., Cohen C.J., Shraga-Heled N., Ofir R. In-vitro optimization of nanoparticle-cell labeling protocols for in-vivo cell tracking applications. Sci. Rep. 2015;5:1–11. doi: 10.1038/srep15400. [DOI] [PMC free article] [PubMed] [Google Scholar]
- Bienvenu J., Monneret G., Fabien N., Revillard J.P. The clinical usefulness of the measurement of cytokines. Clin. Chem. Lab. Med. 2000;38:267–285. doi: 10.1515/CCLM.2000.040. [DOI] [PubMed] [Google Scholar]
- Biosciences, B. Detecting intracellular cytokines in activated lymphocytes. https://www.bdbiosciences.com/documents/Detecting_Cytokines_Lymphocytes.pdf.
- Brosterhus H., Brings S., Leyendeckers H., Manz R.A., Miltenyi S., Radbruch A., Assenmacher M., Schmitz J. Enrichment and detection of live antigen-specific CD 4+ and CD 8+ T cells based on cytokine secretion. Eur. J. Immunol. 1999;29:4053–4059. doi: 10.1002/(SICI)1521-4141(199912)29:12<4053::AID-IMMU4053>3.0.CO;2-C. [DOI] [PubMed] [Google Scholar]
- Childs B.G., Durik M., Baker D.J., Van Deursen J.M. Cellular senescence in aging and age-related disease: from mechanisms to therapy. Nat. Med. 2015;21:1424–1435. doi: 10.1038/nm.4000. [DOI] [PMC free article] [PubMed] [Google Scholar]
- Deng W., Goldys E. Analyst. 2014;139:5321–5334. doi: 10.1039/c4an01272k. [DOI] [PubMed] [Google Scholar]
- Fan R., Vermesh O., Srivastava A., Yen B.K.H., Qin L.D., Ahmad H., Kwong G.A., Liu C.C., Gould J., Hood L. Integrated barcode chips for rapid, multiplexed analysis of proteins in microliter quantities of blood. Nat. Biotechnol. 2008;26:1373–1378. doi: 10.1038/nbt.1507. [DOI] [PMC free article] [PubMed] [Google Scholar]
- Foster B., Prussin C., Liu F., Whitmire J.K., Whitton J.L. Detection of intracellular cytokines by flow cytometry. Curr. Protoc. Immunol. 2007;110:6.24.1–6.24.18. doi: 10.1002/0471142735.im0624s78. [DOI] [PubMed] [Google Scholar]
- Gurevich K.G., Agutter P.S., Wheatley D.N. Stochastic description of the ligand-receptor interaction of biologically active substances at extremely low doses. Cell Signal. 2003;15:447–453. doi: 10.1016/s0898-6568(02)00138-9. [DOI] [PubMed] [Google Scholar]
- Hafler D.A. Cytokines and interventional immunology. Nat. Rev. Immunol. 2007;7:423. [Google Scholar]
- Han Q., Bradshaw E.M., Nilsson B., Hafler D.A., Love J.C. Multidimensional analysis of the frequencies and rates of cytokine secretion from single cells by quantitative microengraving. Lab Chip. 2010;10:1391–1400. doi: 10.1039/b926849a. [DOI] [PMC free article] [PubMed] [Google Scholar]
- Herrera V., Hsu S.C.J., Rahim M.K., Chen C., Nguyen L., Liu W.F., Haun J.B. Pushing the limits of detection for proteins secreted from single cells using quantum dots. Analyst. 2019;144:980–989. doi: 10.1039/c8an01083h. [DOI] [PMC free article] [PubMed] [Google Scholar]
- Holmes P., Al-Rubeai M. Improved cell line development by a high throughput affinity capture surface display technique to select for high secretors. J. Immunol. Methods. 1999;230:141–147. doi: 10.1016/s0022-1759(99)00181-7. [DOI] [PubMed] [Google Scholar]
- Jiang Z., Le N.D., Gupta A., Rotello V.M. Cell surface-based sensing with metallic nanoparticles. Chem. Soc. Rev. 2015;44:4264–4274. doi: 10.1039/c4cs00387j. [DOI] [PMC free article] [PubMed] [Google Scholar]
- Joensson H.N., Svahn H.A. Droplet microfluidics-A tool for single-cell analysis. Angew. Chem. Int. Ed. 2012;51:12176–12192. doi: 10.1002/anie.201200460. [DOI] [PubMed] [Google Scholar]
- Jung T., Schauer U., Heusser C., Neumann C., Rieger C. Detection of intracellular cytokines by flow-cytometry. J. Immunol. Methods. 1993;159:197–207. doi: 10.1016/0022-1759(93)90158-4. [DOI] [PubMed] [Google Scholar]
- Kenney J.S., Gray F., Ancel M.H., Dunne J.F. Production of monoclonal antibodies using a secretion capture report web. Biotechnology. 1995;13:787–790. doi: 10.1038/nbt0895-787. [DOI] [PubMed] [Google Scholar]
- Kulbe H., Chakravarty P., Leinster D.A., Charles K.A., Kwong J., Thompson R.G., Coward J.I., Schioppa T., Robinson S.C., Gallagher W.M. A dynamic inflammatory cytokine network in the human ovarian cancer microenvironment. Cancer Res. 2012;72:66–75. doi: 10.1158/0008-5472.CAN-11-2178. [DOI] [PMC free article] [PubMed] [Google Scholar]
- Lacy P., Stow J.L. Cytokine release from innate immune cells: association with diverse membrane trafficking pathways. Blood. 2011;118:9–18. doi: 10.1182/blood-2010-08-265892. [DOI] [PubMed] [Google Scholar]
- Lei J., Ju H. Signal amplification using functional nanomaterials for biosensing. Chem. Soc. Rev. 2012;41:2122–2134. doi: 10.1039/c1cs15274b. [DOI] [PubMed] [Google Scholar]
- Liu G.Z., Qi M., Huchtinson M., Yang G.F., Goldys E.M. Recent advances in cytokine detection by immunosensing. Biosens. Bioelectron. 2016;79:810–821. doi: 10.1016/j.bios.2016.01.020. [DOI] [PubMed] [Google Scholar]
- Love J.C., Ronan J.L., Grotenbreg G.M., van der Veen A.G., Ploegh H.L. A microengraving method for rapid selection of single cells producing antigen-specific antibodies. Nat. Biotechnol. 2006;24:703–707. doi: 10.1038/nbt1210. [DOI] [PubMed] [Google Scholar]
- Manz R., Assenmacher M., Pfluger E., Miltenyi S., Radbruch A. Analysis and sorting of live cells according to secreted molecules, relocated to a cell surface affinity matrix. Proc. Natl. Acad. Sci. U S A. 1995;92:1921–1925. doi: 10.1073/pnas.92.6.1921. [DOI] [PMC free article] [PubMed] [Google Scholar]
- Müller G., Müller A., Tüting T., Steinbrink K., Saloga J., Szalma C., Knop J., Enk A.H. Interleukin-10-treated dendritic cells modulate immune responses of naive and sensitized T cells in vivo. J. Invest. Dermatol. 2002;119:836–841. doi: 10.1046/j.1523-1747.2002.00496.x. [DOI] [PubMed] [Google Scholar]
- Nicola N.A. A Sambrook & Tooze Publication at Oxford University Press; 1994. Guidebook to Cytokines and Their Receptors. [Google Scholar]
- Quinn, J., Gratalo, D., Haden, K., and Moon, J. (2008). Accurate multiplex cytokine assay developed with VeraCode® technology.
- Rider T.H., Petrovick M.S., Nargi F.E., Harper J.D., Schwoebel E.D., Mathews R.H., Blanchard D.J., Bortolin L.T., Young A.M., Chen J.Z. A B cell-based sensor for rapid identification of pathogens. Science. 2003;301:213–215. doi: 10.1126/science.1084920. [DOI] [PubMed] [Google Scholar]
- Schenk T., Irth H., Marko-Varga G., Edholm L., Tjaden U., van der Greef J. Potential of on-line micro-LC immunochemical detection in the bioanalysis of cytokines. J. Pharm. Biomed. Anal. 2001;26:975–985. doi: 10.1016/s0731-7085(01)00464-2. [DOI] [PubMed] [Google Scholar]
- Starr M.E., Evers B.M., Saito H. Age-associated increase in cytokine production during systemic inflammation: adipose tissue as a major source of IL-6. J. Gerontol. A Biol. Sci. Med. Sci. 2009;64:723–730. doi: 10.1093/gerona/glp046. [DOI] [PMC free article] [PubMed] [Google Scholar]
- Stenken J.A., Poschenrieder A.J. Bioanalytical chemistry of cytokines–A review. Anal. Chim. Acta. 2015;853:95–115. doi: 10.1016/j.aca.2014.10.009. [DOI] [PMC free article] [PubMed] [Google Scholar]
- Stow J.L., Low P.C., Offenhäuser C., Sangermani D. Cytokine secretion in macrophages and other cells: pathways and mediators. Immunobiology. 2009;214:601–612. doi: 10.1016/j.imbio.2008.11.005. [DOI] [PubMed] [Google Scholar]
- Streeck H., Frahm N., Walker B.D. The role of IFN-gamma Elispot assay in HIV vaccine research. Nat. Protoc. 2009;4:461–469. doi: 10.1038/nprot.2009.7. [DOI] [PubMed] [Google Scholar]
- Tibbe A.G., de Grooth B.G., Greve J., Dolan G.J., Rao C., Terstappen L.W. Magnetic field design for selecting and aligning immunomagnetic labeled cells. Cytometry. 2002;47:163–172. doi: 10.1002/cyto.10060. [DOI] [PubMed] [Google Scholar]
- Turcanu V., Williams N.A. Cell identification and isolation on the basis of cytokine secretion: a novel tool for investigating immune responses. Nat. Med. 2001;7:373–376. doi: 10.1038/85533. [DOI] [PubMed] [Google Scholar]
- Whicher J., Evans S. Cytokines in disease. Clin. Chem. 1990;36:1269–1281. [PubMed] [Google Scholar]
- Wilson N.J., Boniface K., Chan J.R., McKenzie B.S., Blumenschein W.M., Mattson J.D., Basham B., Smith K., Chen T., Morel F. Development, cytokine profile and function of human interleukin 17–producing helper T cells. Nat. Immunol. 2007;8:950–957. doi: 10.1038/ni1497. [DOI] [PubMed] [Google Scholar]
- Young H.A. Cytokine multiplex analysis. In: Kozlov S.V., editor. Vol. 511. Humana Press; 2009. pp. 85–105. (Methods in Molecular Biology: Inflammation and Cancer). [DOI] [PMC free article] [PubMed] [Google Scholar]
- Zhao W., Schafer S., Choi J., Yamanaka Y.J., Lombardi M.L., Bose S., Carlson A.L., Phillips J.A., Teo W., Droujinine I.A. Cell-surface sensors for real-time probing of cellular environments. Nat. Nanotechnol. 2011;6:524–531. doi: 10.1038/nnano.2011.101. [DOI] [PMC free article] [PubMed] [Google Scholar]
Associated Data
This section collects any data citations, data availability statements, or supplementary materials included in this article.