Abstract
Spatially explicit agent-based models (ABMs) have been widely utilized to simulate the dynamics of spatial processes that involve the interactions of individual agents. The assumptions embedded in the ABMs may be responsible for uncertainty in the model outcomes. To ensure the reliability of the outcomes in terms of their space-time patterns, model validation should be performed. In this paper, we propose the use of multiple scale spatio-temporal patterns for validating spatially explicit ABMs. We evaluated several specifications of vector-borne disease transmission models by comparing space-time patterns of model outcomes to observations at multiple scales via the sum of root mean square error (RMSE) measurement. The results indicate that specifications of the spatial configurations of residential area and immunity status of individual humans are of importance to reproduce observed patterns of dengue outbreaks at multiple space-time scales. Our approach to using multiple scale spatio-temporal patterns can help not only to understand the dynamic associations between model specifications and model outcomes, but also to validate spatially explicit ABMs.
Keywords: spatially explicit agent-based model, pattern-oriented validation, pattern-oriented modelling, space-time pattern, dengue virus
Introduction
A spatially explicit agent-based model (ABM) can provide a better understanding of real-world phenomena by exploring the linkages between changes in model parameters and spatial patterns (An, Linderman, Qi, Shortridge, & Liu, 2005; Parker & Meretsky, 2004). In these models, the phenomena under study are driven by interactions between heterogeneous individual agents and between agents and their environments. Only some key assumptions are considered and simplified in the ABM to develop a parsimonious model. For example, in ABMs of infectious disease transmission among humans, human agents are often assumed to commute to the nearest school or workplace (Chao, Halstead, Halloran, & Longini Jr, 2012; Mao & Bian, 2010). Given the critical role of routine movements of individuals in infectious disease transmission at the local scale (Balcan et al., 2009; Stoddard et al., 2009), the specification of human movements may be responsible for the uncertainty in simulation results (i.e., the spatio-temporal patterns of epidemics). Therefore, model validation should be performed to understand the uncertainty arising from these assumptions and to improve the reliability of model outcomes.
Pattern-oriented modeling (POM) (Grimm & Railsback, 2012; Grimm et al., 2005) provides a conceptual framework to assess the applicability of models by comparing the patterns generated by model outcomes to observed patterns. Following POM, the assumptions embedded in the ABMs are suitable when various spatio-temporal patterns of the model outcomes are well reproduced (O’Sullivan & Perry, 2013). To assess the models, previous studies have used patterns of various model outcomes at a single space-time scale (Heppenstall, Evans, & Birkin, 2007; Narzisi, Mysore, & Mishra, 2006; Railsback & Johnson, 2011; Wang et al., 2018), but multiple scale spatio-temporal patterns of the simulated outcome of interest (i.e., space-time disease outbreaks patterns at macro and micro scales) have rarely been employed.
Model validation performed at multiple spatiotemporal scales should be explored for boosting model reliability and applicability. The multiple scale space-time pattern comparisons should be especially useful for understanding spatially and temporally clustered phenomena that often rely on targeted interventions, such as crime and disease outbreaks. The models would not be as useful when they reproduce either only macro scale patterns (i.e., the total number of events in the study area) or micro scale patterns (i.e., local clustering of risk). Therefore, it is important to understand how ABMs should be assessed by comparing multiple scale patterns of simulated outcomes and observations.
To address these issues, we examine the use of multiple scale spatio-temporal patterns for validation of spatially explicit ABMs. ABMs of dengue virus (DENV) transmission are used as the case study. Dengue is a considerable public health burden in tropical and subtropical developing countries (Halstead, 2008; WHO, 2012). The primary vector of DENV is the Aedes aegypti mosquito. The specific objectives of our study are twofold: 1) to explore the joint associations between the assumptions embedded in the model and model outcomes, and 2) to assess the model specifications by comparisons of multiple space-time scale patterns of observations to those of simulation outcomes. This study focuses on the evaluating the model assumptions, leaving calibration (or parametrization) aside. To achieve these goals, we design several models under different specifications and comprehensively examine the differences in spatio-temporal patterns of DENV outbreaks between models.
Multiple space-time scales for model validation
The purpose of validation of ABMs is to assess how well the model replicates a real-world phenomenon. Validation is performed by comparing simulated data to observations from real systems. The validation process can be executed with a variety of both spatial and aspatial (non-spatial) model outcomes (Parker, Manson, Janssen, Hoffmann, & Deadman, 2003). Importantly, spatially explicit ABMs enable the representation of dynamic spatio-temporal processes between individuals interacting within spatial environments. Since the patterns characterize a real-world phenomenon, the use of the patterns observed in the real system need to be properly embedded in the model (Grimm & Railsback, 2012; Grimm et al., 2005; Latombe, Parrott, & Fortin, 2011).
The spatio-temporal patterns of model outcomes and observations are differently described at the different spatio-temporal scales. Therefore, spatio-temporal scales must be properly considered for exploring the patterns as follows (Figure 1): (1) macro spatial and temporal scale – spatially global and temporally long-term scale (e.g., annually aggregated disease outbreak cases), (2) micro spatial and macro temporal scale – spatially local and temporally long-term scale (e.g., long-term disease attack rates in a specific household), (3) macro spatial and micro temporal scale – global spatial scale and short-term temporal scale (e.g., weekly U.S. influenza cases), and (4) micro spatial and temporal scale – local spatial scale and short-term temporal scale (e.g., short-term disease outbreak patterns in a community). For example, for validation of ABMs of DENV transmission, the patterns of simulated outcomes need to be identified at macro and micro spatio-temporal scale, because the annual DENV cases are often aggregated at a district-level (Endy et al., 2002) and the DENV outbreaks are spatially clustered at short temporal intervals (Aldstadt, 2007; Yoon et al., 2012).
Figure 1.
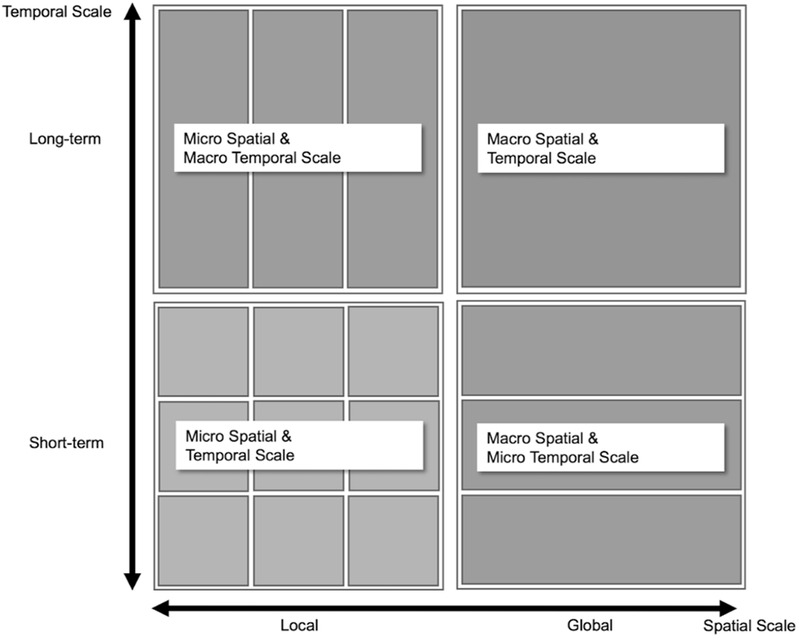
Spatio-temporal scale.
Here, we do not argue that the patterns should be measured at all four spatio-temporal scales. The number of scales in which patterns that can be described depends on the data availability. According to the available data, model validation can also be performed at meso-spatial or temporal scales.
Case study: A spatially explicit ABM of DENV transmission
Study area and data
Our study area is based on a portion of northeastern Kamphaeng Phet (KPP) province in Thailand. As previously described (Kang & Aldstadt, 2017), realistic and synthetic environments were set up; in the realistic scenarios the locations of all buildings were drawn from a Lidar derived building dataset (Figure 2(a)), whereas in the synthetic environment buildings were randomly arranged (Figure 2(b)). In each scenario, the environment consisted of 3683 houses, 185 workplaces, and 8 schools. The locations are projected in Universal Transverse Mercator (UTM) system, zone 47 North.
Figure 2.
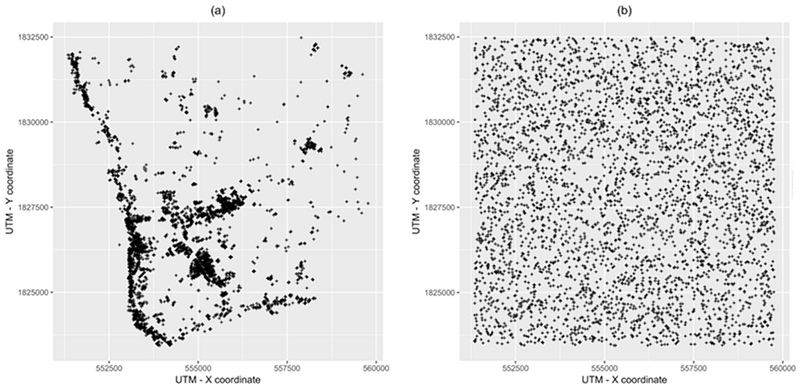
Spatial configuration of buildings in the study area, a portion of Kamphaeng Phet province, Thailand. (a) Realistic spatial configuration; (b) Synthetic spatial configuration.
A KPP household sample dataset collected 2009 (Thomas et al., 2015) was utilized, and the household configurations (age, gender, number of residents) were randomly drawn from these microdata. Approximately 11,700 individual people were placed in the 3683 houses. The population was updated each year with the addition of newborns and the removal of deaths and out-migrants. Birth rates and death/out-migration rates were calculated from population register data obtained from Department of Provincial Administration (DOPA), Ministry of Interior Thailand. Each of these population changes was applied to households selected at random. The population distribution for one simulation is shown in Figure 3. The shape of the population pyramid is atypical because many young adults are away working in urban centers.
Figure 3.
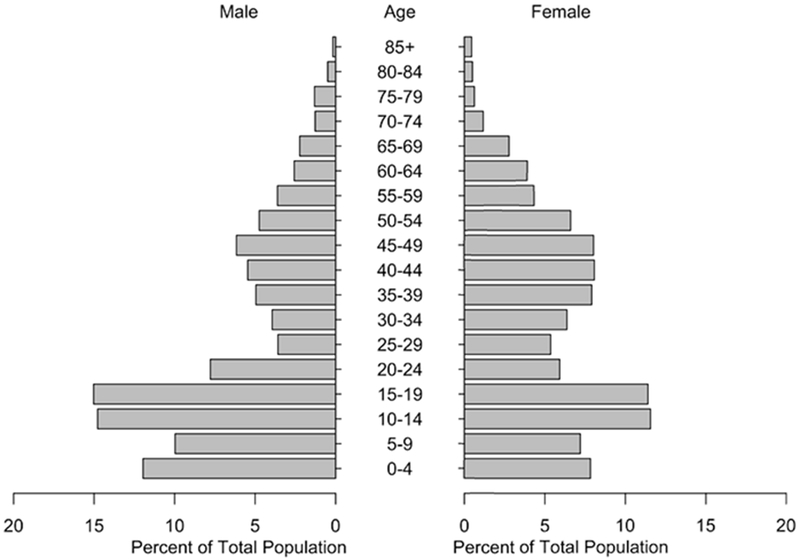
Population pyramid.
ABMs of DENV transmission
DENV outbreaks are spatially and temporally clustered at fine spatiotemporal scale (Aldstadt, 2007; Yoon et al., 2012) because of the short flight distance of Ae. aegypti (Harrington et al., 2001; Harrington et al., 2005). The vectors spread DENV within households and to neighboring houses. Mosquito movement is restricted by the spatial configuration of buildings (Harrington et al., 2005; Tsuda, Takagi, Wang, Wang, & Tang, 2001), and mosquito population structure has an impact on DENV transmission patterns (Favier et al., 2005; Smith, Dushoff, & McKenzie, 2004). DENV consists of four distinct serotypes (DENV-1 to -4). Infection by any single serotype provides long-term immunity with transient cross-protection to other serotypes (Reich et al., 2013; Sabin, 1952; WHO, 2012). These immunological interactions between serotypes can also influence the spatio-temporal patterns of endemic transmission (Gubler, 2002; Salje et al., 2012).
To understand the dynamic natures of DENV transmission, many researchers have contributed to the development of spatially explicit ABMs, but they have not fully considered the characteristics of DENV transmission. The ABMs developed under a lack of knowledge may provide limited policy implications derived from simulations. In spite of the apparent importance of heterogeneous host populations with their serotype-specific immunity status (Salje et al., 2012), previous studies assume homogeneously mixed population (Knerer, Currie, & Brailsford, 2015), no distinction of serotypes (de Lima et al., 2016; Karl, Halder, Kelso, Ritchie, & Milne, 2014; Padmanabha et al., 2015), and fail to preserve the immunity status of individuals year-to-year (Chao et al., 2012; Karl et al., 2014). Thus, the assumption of heterogeneous serotype-specific immunity status of populations should be included in ABMs of DENV transmission.
In addition to heterogeneous immune status of individuals, joint associations of mosquito populations and spatial configurations of residential areas need to be considered (Kang & Aldstadt, 2017). The investigation on these joint associations provides a more comprehensive understanding of the ways that the assumptions embedded in the model influence spatio-temporal patterns of DENV transmission. The influences of the assumptions will be evaluated by comparing spatio-temporal patterns of the model outcomes to those of observations. This validation can help in evaluating and properly choosing the assumptions embedded in the model.
In this study, we developed a spatially explicit agent-based model composed of three components: (1) human agents, (2) mosquito agents, and (3) the environment in which human and mosquito agents interact with each other (for details, please see Overview, Design concepts and Details (ODD) protocol (Grimm et al., 2010) in Appendix Table A1). The simulations were run with eight scenarios that were jointly associated with three assumptions, as follows: mosquito population distribution, (Favier et al., 2005; Smith et al., 2004), spatial configurations of residential area (Kang & Aldstadt, 2017), and individual human’s immunity status (Table 1). The details of each assumption will be provided in the following.
Table 1.
Model Description
| Scenario | Mosquito Population | Spatial configurations | Immunity Status |
|---|---|---|---|
| HeteroRealPre | Heterogeneous | Realistic | Preservation |
| HeteroRealReset | Heterogeneous | Realistic | Reset |
| HeteroSynthPre | Heterogeneous | Synthetic | Preservation |
| HeteroSynthReset | Heterogeneous | Synthetic | Reset |
| HomoRealPre | Homogeneous | Realistic | Preservation |
| HomoRealReset | Homogeneous | Realistic | Reset |
| HomoSynthPre | Homogeneous | Synthetic | Preservation |
| HomoSynthReset | Homogeneous | Synthetic | Reset |
We ran 300 simulations for 20 years for each scenario. To consider time-varying behaviors of humans and mosquitoes, the DENV epidemics were simulated with a one-hour time step. The last four years of outcomes were used to test how well the model replicated the observed patterns of DENV infection. Each individual’s exposure to DENV prior to initiation of the ABM was estimated based on an annual attack rate of 0.14. Since an initial state of the immunity status of individuals was not spatially structured, this burn-in period created a more realistic pattern of community-level immunity. The individual’s immunity status is likely similar to their neighbors, because of seasonal serotype-specific dominance in Thailand (Nisalak et al., 2003) and the focal nature of DENV transmission (Mammen Jr et al., 2008). This spatially patterned immunity was maintained in the preservation scenarios. In reset scenarios, the immunity status of each human agent was newly assigned at the beginning of each year based on each individual’s age. Therefore, immunity statuses were not clustered within the study area in the reset scenarios.
A human agent refers to an individual human. In our ABM, age-specific movement behaviors of individuals were considered, as follows: (1) an individual human spends the daytime (between 9 am to 5 pm) at his/her school (ages 5 to 19) or workplace (ages 20 to 64), and the rest of time (between 5 pm to 9 am) at his/her home, and (2) the rest of people stay at their home all the time, as shown in Figure 4. People aged 5 to 64 commute to their schools/workplaces, and potentially interact with mosquito agents at their school/workplace in daytime and with mosquito agents at their home the rest of time. The movement patterns are identical on weekdays and on the weekend.
Figure 4.
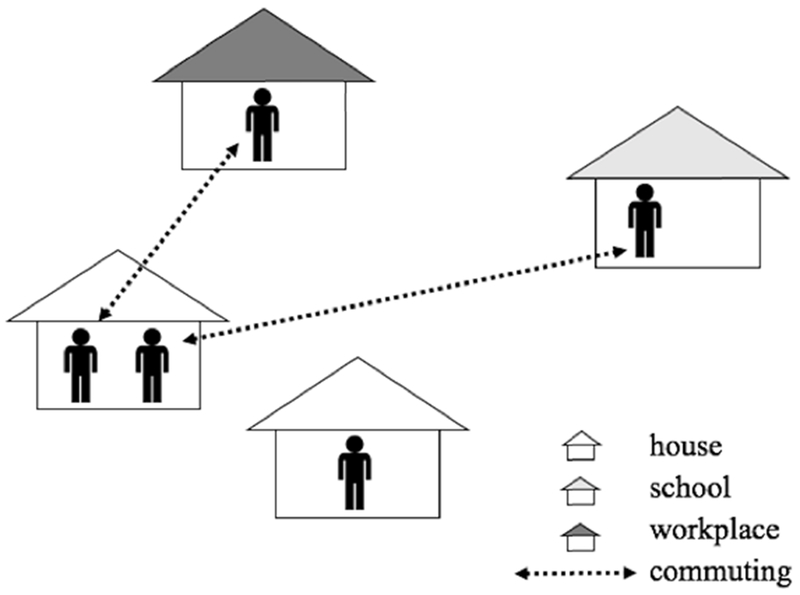
The movement activities of human agents.
The health status of each individual agent is described with a susceptible, exposed, infectious, and recovered (SEIR) model. Since DENV is composed of four distinct serotypes, each individual has a SEIR status for each serotype. These SEIR statuses also determine the human’s movement. The sick individuals stay at their home until they recover. Once they recover, they restart their normal movement pattern. The cross-protection between serotypes lasts for 120 days (Chao et al., 2012). After 120 days, individuals become susceptible again to other serotypes that they have not yet been exposed to (Vaughn et al., 2000). The parameters are provided in Appendix Table A2. These parameters are the same in every scenario.
In our model, only infected female mosquitoes become agents. Susceptible female mosquito populations are tracked at the household level (e.g., 42 per household in June). In other words, the number of mosquito population in the household are intended to describe mosquitoes’ breeding and feeding sites. When infectious human agents enter a building, there is a chance that they will be bitten by one or more of these susceptible vectors. The female mosquito becomes an agent by biting an infectious human agent. The infected female mosquitoes are able to transmit DENV to other collocated susceptible human agents during their life-time. Infected mosquitoes travel to nearby buildings (within 30m) with a 0.15 probability every day (Chao et al., 2012). If there are several nearby buildings, the mosquitoes travel to a randomly selected one among them. The infected mosquitoes also occasionally travel to a distant building that is farther than 30 meters from their current building. This long distance travel occurs with a 0.01 daily probability (Figure 5) (Chao et al., 2012). Although a mosquito agent’s movement is evaluated once each day, its biting behaviors vary for four discrete time intervals (08-13 hours, 13-18 hours, 18-24 hours, and 00-08 hours) with specific biting rates (0.08, 0.76, 0.13, and 0.03), respectively.
Figure 5.
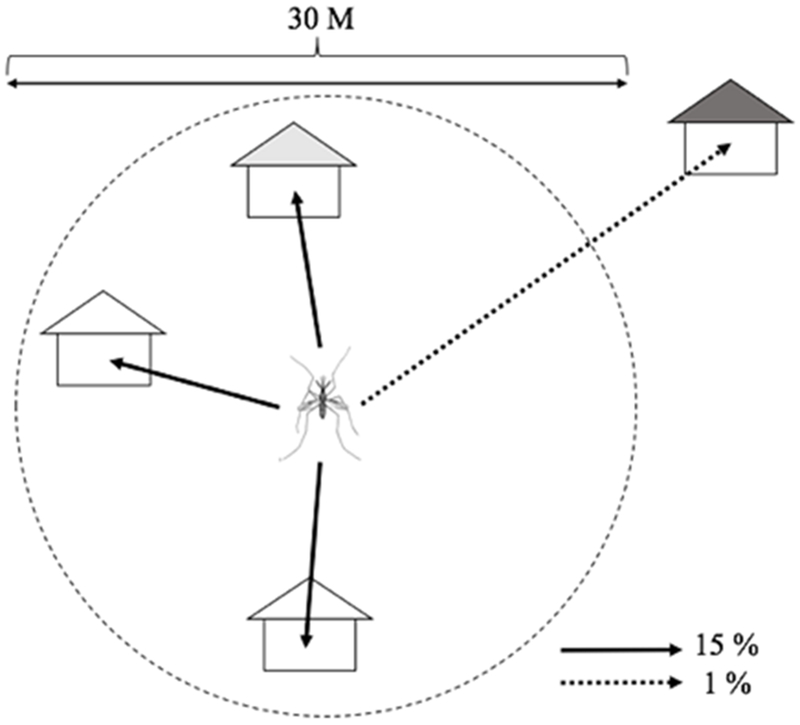
The movement activities of mosquito agents.
We also assume that each mosquito agent’s survival is age dependent (Harrington et al., 2001; Harrington et al., 2008; Harrington et al., 2005). All parameters with respect to mosquito agents are provided in Appendix Table A3.
Homogenous and heterogeneous mosquito populations are distinguished by the distribution of the mosquito population in the buildings. The number of mosquitoes is the same in every building in homogeneous scenarios (Figure 6(a)), whereas the number of susceptible mosquitoes varies in heterogeneous scenarios (Figure 6(b)). Both homogeneous and heterogeneous scenarios include seasonal variation in mosquito population. For the homogeneous scenarios, the number of mosquitoes in each building is set to 42 at the peak in June, and just two in February. In heterogeneous scenarios, the number of mosquitos in each building is drawn from a negative binomial distribution with the same monthly average as used in the homogeneous scenarios. In detail, the number of mosquitoes ranges between approximately 200 and 0 in June in heterogeneous scenarios, but the average number of mosquitos in all buildings in heterogeneous scenarios are similar to that (42) in homogeneous scenarios.
Figure 6.
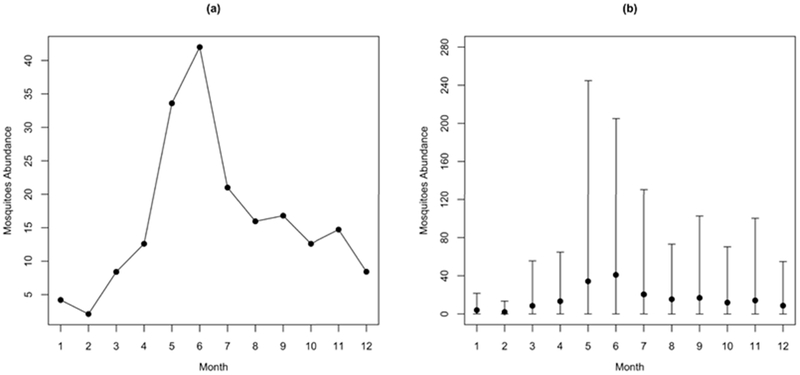
Mosquito seasonality. (a) The building-level mosquito abundance in homogeneous mosquito population scenarios; (b) the average and range of building-level mosquito abundance in heterogeneous mosquito population scenarios (Kang and Aldstadt 2017).
Observed spatiotemporal patterns of DENV transmission
At the macro spatio-temporal scale (i.e., spatially global and temporally long-term scale), spatiotemporal patterns of DENV transmission are described with estimated attack rates. Specifically, Endy et al. (2002) found the overall rate of DENV infections was 5.8 percent per year within the school population (i.e., children aged 4-16 years) in KPP.
At the micro spatiotemporal scale (i.e., spatially local and temporally short-term scale), spatiotemporal patterns of DENV incidence were captured with geographic cluster investigations. Yoon et al. (2012) explored the spatial pattern of dengue virus infections among children living nearby a child with a detected infection. The initiating cases were captured with a school-based surveillance system. The geographic cluster investigations enrolled other children living within a100-meter radius of the initiating case’s household. This methodology was able to capture other dengue infections that occurred approximately three weeks prior to and up to 15 days after detection of the first case reported in a cluster. Figure 7 shows the average of DENV infection rates among the children in 50 clusters by distance from the residential location of a detected DENV infection. Distance decay of the infection rates was found, the infection rates were: 35.3 % in index houses, 29.9 % in houses within 20 meters, 22.2 % in houses within 20-40 meters, 13.2 % in houses within 40-60 meters, 14.4 % in houses within 60-80 meters, and 6.2 % in houses within 80-100 meters.
Figure 7.
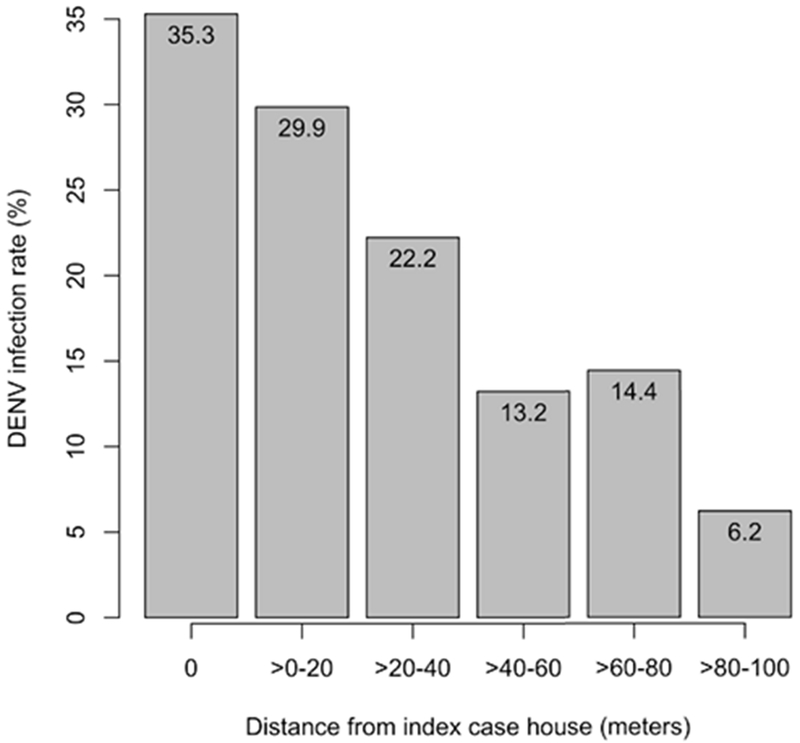
DENV infection rate in each distance range (Yoon et al. 2012).
The DENV infection rates (Rj) denote the average of the DENV infection rates over 50 clusters in each distance range (j), and were calculated by the following equation:
| (1) |
where rji denotes the DENV infection rates in cluster j, and n denotes the number of clusters (50).
Model evaluation measurement
To evaluate eight models across spatial and temporal scales, the sum of root mean square error (RMSE) measurement was used as a measure of fit, which is calculated by the following equation:
| (2) |
where i denote the index of spatio-temporal patterns (i.e., overall DENV infection rates and DENV infection rates in each cluster), Rj is the DENV infection rates each simulation run, Oi denote the DENV infection rates in observed overall DENV infection rates (Endy et al., 2002) and cluster-based DENV infection rates (Yoon et al., 2012).
Results and discussion
Results
In this study, we ran 300 simulations for each scenario. Following POM, ABMs must reproduce patterns in observed data if they are capturing the real-world system’s properties (Grimm & Railsback, 2012; Grimm et al., 2005). Here, validation was performed at multiple scales. Because of a lack of available data, we performed model validations at two multiple scales (i.e., macro spatio-temporal and micro spatio-temporal scales).
At the macro scale, the overall DENV infection rates of children aged 4 to 16 years were measured (Table 2) to compare the patterns to those reported by Endy et al. (2002). The rates refer to the average infection rates over 300 simulation runs. The results from simulations show two distinguishable patterns: 1) greater infection rates in herd immunity preservation scenarios than reset scenarios and 2) greater infection rates in realistic configuration scenarios than synthetic configuration scenarios (for details, please see the following descriptions).
Table 2.
Spatio-temporal patterns of DENV infection rates at the macro scale
| Scenario | DENV Infection Rate (95% CI) |
|---|---|
| HeteroRealPre | 8.65 (8.50 – 8.79) |
| HeteroRealReset | 2.79 (2.74 – 2.85) |
| HomoRealPre | 9.08 (8.95 – 9.22) |
| HomoRealReset | 3.12 (3.07 – 3.18) |
| HeteroSynthPre | 4.06 (4.02 – 4.12) |
| HeteroSynthReset | 0.67 (0.66 – 0.68) |
| HomoSynthPre | 4.11 (4.07 – 4.15) |
| HomoSynthReset | 0.67 (0.66 – 0.69) |
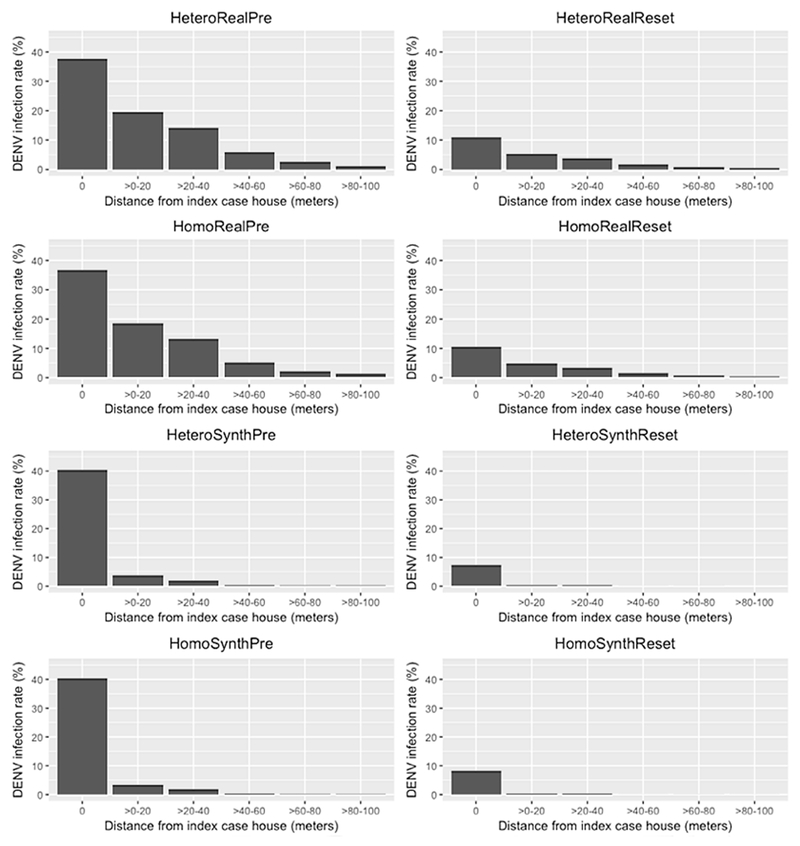
In addition, the averages of the DENV infection rates of clusters were used for comparison at the micro scale. We measured the local DENV infection rates including the infections that occurred up to three weeks before and up to 15 days after randomly selected dengue infections, mimicking the methodology of Yoon et al. (2012). Figure 8 shows the average of the DENV infection rates of clusters in each distance interval. The details are provided in the Appendix Table A4. We found apparent differences in the spatio-temporal patterns among the results from simulations: (1) greater DENV infection rates in immunity preservation scenarios than those in immunity reset scenarios, and (2) lower dengue infection rates in neighboring houses (i.e., >0-20, >20-40, >40-60, >60-80, and >80-100 m) in synthetic configuration scenarios.
Figure 8.
Spatio-temporal patterns of DENV infection rates in each distance range at micro scale.
The greater DENV infection rates in immunity preservation scenarios are due to the spatial patterning of susceptible individuals. DENV is more likely to be transmitted to the household members of infected individuals, and to residents living in neighboring houses. Thus, the immunity statuses of neighboring individuals should be similar to each other with pockets of high herd immunity or low herd immunity. The pockets of low herd immunity enable infections introduced from outside the study area to take hold and potentially affect a larger portion of the community. In the reset scenarios, the immunity status was reset every year and assigned based on each individual’s age. Therefore, the immunity statuses of people living in proximity with one another are often different, preventing outbreaks from taking hold in the community.
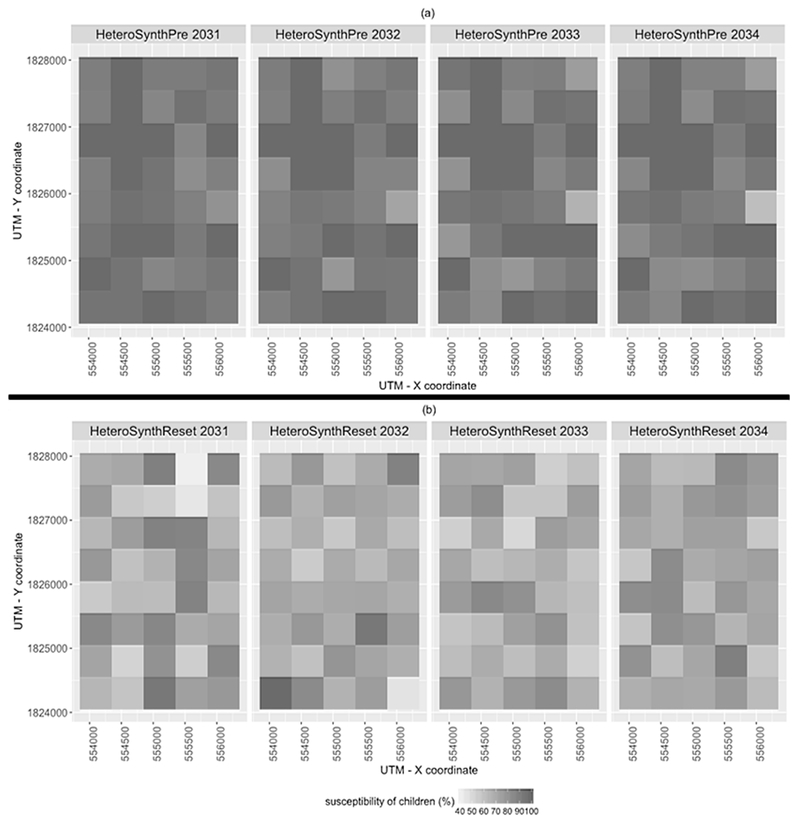
Figure 9 shows temporal changes in the susceptibility of children (i.e., aged 0 to 15), determined by dividing the susceptible child population by the total child population within each quadrat boundary. Each panel in Figure 9 depicts the pattern of susceptibility from one realization of the simulated epidemics in synthetic environments. The susceptibility in preservation scenario (Figure 9(a)) gradually changed over time due to the infections and deaths (the rates are decreased), and births (the rates are increased), whereas the pattern of susceptibility in reset scenarios (Figure 9(b)) dramatically changed each year. The patterns of temporal changes in the susceptibility can be explained through comparing one year to another (i.e., 17th to 18th, 18th to 19th, and 19th to 20th). In detail, temporal variability in relative levels of susceptibility at each grid cell in Figure 9 range from 0 – 9.5 % (from 17th to 18th), 0 – 13 % (18th to 19th), and 0 – 6 % (19th to 20th) in HeteroSynthPre scenarios, whereas they range from 1 – 40 % (17th to 18th), 0 – 25 % (18th – 19th), and 0 – 22 % (19th to 20th) in HeteroSynthReset scenarios. In addition, higher infections in HeteroSynthPre scenarios than HeteroSynthReset scenarios can be explained by the higher susceptibility in HeteroSynthPre scenarios. These results highlight the importance of preserving the immunity history of individuals in ABMs of DENV transmission.
Figure 9.
Temporal changes in susceptibility of children in the synthetic environments. (a): HeteroSynthPre, and (b): HeteroSynthReset.
In synthetic configuration scenarios, there are lower infection rates among neighboring children than in the realistic environment. This difference in patterns is due to fewer movement options of the infected-mosquito agents. Figure 10 shows the nearest neighboring building distances for each building in the realistic scenarios and one realization of a synthetic scenario. Given that mosquito movements in our models were mostly between buildings within 30m of each other, these results indicated the importance of the joint specification of mosquito agent movement and spatial configuration of the built environment.
Figure 10.
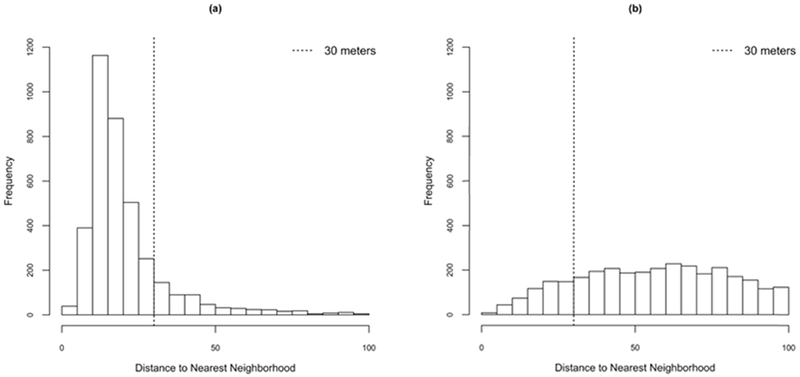
Distributions of distance to nearest building for each building in the study area. (a) Realistic configuration scenarios; (b) one realization of the synthetic configuration scenario.
Based on the sum of RMSE, we can evaluate to what extent the scenarios fit well with the observations and quantitatively validate the models (Table 3). The lowest value indicates the least discrepancy between spatio-temporal patterns of model outcomes and those of observed data. The model outcomes from HeteroRealPre and HomoRealPre scenarios most closely replicate the spatio-temporal patterns of DENV transmission at multiple spatio-temporal scales. Several other models have lower RMSE values for the macros scale metric, but do match the local pattern as well. The scenarios with annual reset of immunity status do not match at the household-level (0m). The simulations performed in the synthetic environment do not match patterns observed among nearby households, specifically those within 60m.
Table 3.
Summary of the sum of RMSE at each spatio-temporal scale
| Scenarios | Macro | 0 m | 0 – 20 m | 20 – 40 m | 40 – 60 m | 60 – 80 m | 80 – 100 m | Sum | Rank |
|---|---|---|---|---|---|---|---|---|---|
| HeteroRealPre | 3.8593 | 9.0636 | 12.4959 | 9.3222 | 7.9791 | 12.1054 | 5.1484 | 59.9739 | 1 |
| HeteroRealReset | 3.165 | 25.1667 | 24.9215 | 18.624 | 11.6026 | 13.6902 | 5.8417 | 103.0117 | 5 |
| HomoRealPre | 4.0354 | 8.6539 | 12.9874 | 9.9115 | 8.3916 | 12.2395 | 5.1758 | 61.3951 | 2 |
| HomoRealReset | 2.8454 | 25.4116 | 25.195 | 18.844 | 11.7777 | 13.7385 | 5.8606 | 103.6728 | 6 |
| HeteroSynthPre | 1.9042 | 10.6633 | 29.0306 | 21.596 | 13.16 | 14.32 | 6.1638 | 96.8379 | 4 |
| HeteroSynthReset | 5.0962 | 28.8703 | 29.6554 | 22.0571 | 13.2184 | 14.433 | 6.2131 | 119.5435 | 8 |
| HomoSynthPre | 1.8331 | 10.1123 | 29.3925 | 21.2937 | 13.1374 | 14.3457 | 6.1585 | 96.2732 | 3 |
| HomoSynthReset | 5.1017 | 28.0647 | 29.7356 | 22.0679 | 13.2184 | 14.4217 | 6.21001 | 118.82 | 7 |
Conclusion
This study proposes the use of multiple scale patterns for validating spatially explicit ABMs. We employed a spatially explicit ABM of DENV transmission in which individual human and infected female mosquito agents interact with each other within the environment. To examine the impact of the model assumptions on the spatio-temporal patterns of model outcomes, we explored eight scenarios with varying residential location patterns, vector population structure, and handling of host population immunity status.
Our study demonstrates the advantages of using patterns observed at multiple scales for validating spatially explicit ABMs. When only comparing a single scale pattern, the best-fit model may well reproduce only that particular pattern. The ABMs that reproduce multiple scale space-time patterns of observations are more likely to be appropriate models of the real world system. The models may, therefore, result in an improved understanding of the spatio-temporal process of interest. In addition, our proposed method assists in choosing proper model or sub-model assumptions. Multiple models representing the same phenomenon are often developed under different assumptions, and thus it is still challenging to choose which model specifications are appropriate to address the particular research questions. By measuring multiple scale space-time patterns of model outcomes from several model specifications, we can eliminate less appropriate models. Furthermore, the ABMs can be useful for policy makers to assess the potential impacts of interventions at the both macro and micro scales. We have chosen to weight the RMSE at each scale equally for ease of comparison and explanation. Future research will examine the relative weighting of measures of fit at different spatial and temporal scales. Uncertainty due to sampling error and potential bias due to coverage error when measuring global and local patterns will be key considerations.
Our multiple scale validation technique has allowed us to quantitatively evaluate the model specification choices in ABMs of DENV transmission. The results from the sum of RMSE measurement comparison indicate the importance of the assumptions used when developing spatially explicit ABMs of vector-borne disease transmission. HeteroRealPre and HomoRealPre scenarios including the assumptions of preserving immunity status of individuals and realistic spatial configurations of buildings more closely replicated the spatio-temporal patterns of DENV transmission. The different specifications of mosquito population structure did not result in large differences in model fit. Therefore, we argue that spatially explicit ABM studies of DENV transmission should incorporate careful specification of residential patterns and individual immunity status.
Depending on the study area and research questions being addressed it may be necessary to adjust model complexity and examine outcomes at additional spatial and temporal scales. Here we only considered commuting activities of individual humans although social activities many also be important determinants of the pattern of DENV transmission in a community (Reiner, Stoddard, & Scott, 2014; Stoddard et al., 2013). Therefore, the inclusion of social activities that may vary between weekdays and weekends in the model may result in outcomes that more closely duplicate the spatio-temporal patterns of observations. The scales of patterns examined in this study were determined by the available data, but patterns can be measured along spatial and temporal continua from micro to macro. The most appropriate patterns for evaluating ABMs may vary widely depending on the application. For example, models that are purposed to particularly simulate a specific pattern, such as spatially clustered events within a few days of each other (e.g., repeat burglaries), micro space-time scale pattern would be important. Time series may play a more important role in validation when seasonality or feedbacks are drivers of the process under study. We have shown that patterns measured at multiple scales may be useful in the evaluation step of the model building process. One apparent next step along this line of inquiry includes examining the use of multiple scale patterns in the calibration phase of the model building procedure. A second associated research direction would be to test the relative value of patterns measured at different scales for discriminating between alternative models and parameterizations.
Acknowledgements
We would like to express our appreciation for the funding provided by the National Institute of Health (R01 GM08244 and P01 AI034533).
Appendix
Our model is available in the following link (https://cloud.anylogic.com/model/64d09b7f-fcd6-4b04-af26-834a26be569d?mode=SETTINGS). Because of the limited computational power of Anylogic cloud platform, only a small portion of our model has been uploaded. The platform supports to run only a particular scenario, HeteroRealPre scenario can be ran through Anylogic cloud platform. To test all eight scenarios, please download the source code from the above link and run the simulations using AnyLogic software. The free version of AnyLogic software will be available at the link (https://www.anylogic.com/downloads/).
Table A1 provides the ODD protocol of ABMs. Not applicable elements in ODD protocol are omitted.
Table A1.
Overview, Design concepts and Details of ABMs
| Overview | |
| Purpose | To simulate a local-level DENV transmission with eight scenarios: (1) HeteroRealPre, (2) HeteroRealReset, (3) HeteroSynthPre, (4) HeteroSynthReset, (5) HomoRealPre, (6) HomoRealReset, (7) HomoSynthPre, and (8) HomoSynthReset |
| Entities, state variables, and scales | ABM consist of three entities: (1) human, (2) infectious female mosquito, and (3) building agents, and each entity has several state variables. (1) Human agent • Age • Gender • Occupation status • House location: x-y coordinates • School/workplace location: x-y coordinates • Current location: x-y coordinates • SEIR states for all DENV serotypes • Cross immunity state (2) Mosquito agent • Age • Serotype (3) Building agent • Type • Location: x-y coordinates |
| Process overview and scheduling | (1) Movement • Human: commuting process: school (aged 5-19) and workplace (aged 20-64) • Mosquito: moving around within 30 meters (15 % of probability) and random locations (1% of probability) (2) The birth, death/out-migration and aging • January 1st every year, the certain amounts of individual humans are newly born and died/out-migrated. The newly born humans are randomly assigned to houses. • January 1st every year, every individual gets older. The property (age) increases by one. (3) scheduling for immunity • In reset scenarios, the immunity status of an individual is reset and assigned based on individual’s age. (4) Biting • Mosquitoes bite humans with a certain probability (5) Seasonal fluctuation of mosquito population • The counts of mosquito population vary to month as shown in Figure 6. |
| Design concepts | |
| Basic principles | The ABMs purpose to explore the impacts of model specifications in regard to (1) spatial configurations of buildings, (2) spatial distribution of mosquito population, and (3) immunity status of individual human. The model was expanded based on Chapter 4. |
| Sensing | Each mosquito senses the neighboring houses to move around and human to bite in all buildings. |
| Interaction | There is an interaction between humans and mosquitoes by biting process of mosquitoes. |
| Details | |
| Initialization | The model synthesizes human population within 3683 households. Individual humans’ immune statuses to each serotype are assigned based on their ages with a certain probability (0.14). For scenarios of heterogeneous mosquito population, the populations are determined by a negative binomial distribution (0.0344, 1.5) where 0.0344 and 1.5 denote number of failure and the probability of success. For scenarios of synthetic environments, all buildings are randomly arranged. |
| Input data | (1) locations of houses and schools identified from GPS data (Thomas et al., 2015) (2) household census data (Thomas et al., 2015) (3) birth and death/out-migration rates obtained from Department of Provincial Administration (DOPA), Ministry of Interior, Thailand. |
| Parameters | The parameters of human and mosquito agents were provided in Table A2 and A3. |
Table A2 and A3 provides a set of parameters employed in this model, which are the same as those of Kang and Aldstadt (2017). These parameters are the same in every scenario.
Table A2.
Parameters for human agents used in the model
| Parameters | Value | Note |
|---|---|---|
| Incubation period | 6 days | Time between exposed and infectious stage in the SEIR model |
| Viremic period | 4 days | Time between infectious and recovered stage in the SEIR model |
| Recovered period | 120 days | Times for completely recovered from a specific serotype. After 120 days, an individual human becomes susceptible to other serotypes. |
| PMP | 0.25 | Probability of infectious mosquito to susceptible person transmission |
| PPM | 0.1 | Probability of infectious person to susceptible mosquito transmission |
| Introduction rate | 0.00001 | Daily probability of DENV infection from outside of study area |
| Annual attack rates | 0.14 | Annual infection rate used to simulate human population immunity at the beginning of simulation |
Table A3.
Parameters for mosquito agents used in the model
| Parameters | Value | Note |
|---|---|---|
| Movement probability | 0.15, 0.01 | Daily movement rates within neighbors (0.15) and random locations (0.01) |
| Extrinsic incubation period | 11 days | Days to become infectious after biting an infectious human |
| Hazard rates | 0.09, 0.08 | Mosquitoes younger than 10 days (0.09) and older than 10 days (0.08) |
| Biting rate | 0.08, 0.76, 0.13, 0.03 | Varies by time of day |
| Mosquito seasonality | 4, 2, 8, 13, 34, 42, 21, 16, 17, 13, 15, 8 | The average number of mosquitoes in each building varies by month (January to December). |
Table A4 provides the details of infection rates at a micro spatio-temporal scale.
Table A4.
Infection Rates at a micro spatio-temporal scale
| Scenarios | Infection Rates (0 m) (95 % CI) | Infection Rates (>0 - 20 m) (95% CI) | Infection Rates (>20 - 40 m) (95% CI) | Infection Rates (>40 - 60 m) (95% CI) | Infection Rates (>60 - 80 m) (95% CI) | Infection Rates (>80 - 100 m) (95% CI) |
|---|---|---|---|---|---|---|
| HeteroRealPre | 37.63 (37.13 – 38.12) | 19.54 (19.14 – 19.94) | 14.12 (13.86 – 14.38) | 5.84 (5.67 – 6.02) | 2.47 (2.36 – 2.57) | 1.22 (1.15 – 1.29) |
| HeteroRealReset | 10.89 (10.54 – 11.24) | 5.21 (5.00 – 5.42) | 3.73 (3.61 – 3.86) | 1.70 (1.62 – 1.79) | 0.77 (0.72 – 0.82) | 0.41 (0.37 – 0.44) |
| HomoRealPre | 36.82 (36.34 – 37.30) | 18.64 (18.26 – 19.01) | 13.27 (13.03 – 13.51) | 5.28 (5.13 – 5.44) | 2.31 (2.22 – 2.41) | 1.18 (1.12 – 1.25) |
| HomoRealReset | 10.59 (10.25 – 10.93) | 4.89 (4.70 – 5.09) | 3.50 (3.38 – 3.62) | 1.51 (1.44 – 1.58) | 0.72 (0.67 – 0.77) | 0.38 (0.35 – 0.42) |
| HeteroSynthPre | 40.51 (39.97 – 41.04) | 3.72 (2.93 – 4.51) | 2.08 (1.63 – 2.53) | 0.39 (0.23 – 0.56) | 0.16 (0.09 – 0.23) | 0.17 (0.10 – 0.24) |
| HeteroSynthReset | 7.49 (7.05 – 7.94) | 0.51 (0.18 – 0.83) | 0.33 (0.15 – 0.51) | 0.02 (0.00 – 0.04) | 0.02 (0.00 – 0.06) | 0.00 (0.00 – 0.01) |
| HomoSynthPre | 40.38 (39.88 – 40.88) | 3.40 (2.59 – 4.20) | 2.01 (1.61 – 2.40) | 0.26 (0.14 – 0.37) | 0.15 (0.07 – 0.22) | 0.13 (0.07 – 0.18) |
| HomoSynthReset | 8.26 (7.81 – 8.71) | 0.24 (0.03 – 0.46) | 0.22 (0.10 – 0.34) | 0.01 (0.00 – 0.03) | 0.03 (0.00 – 0.06) | 0.01 (0.00 – 0.03) |
References
- Aldstadt J (2007). An incremental Knox test for the determination of the serial interval between successive cases of an infectious disease. Stochastic Environmental Research and Risk Assessment, 21(5), 487–500. [Google Scholar]
- An L, Linderman M, Qi J, Shortridge A, & Liu J (2005). Exploring Complexity in a Human–Environment System: An Agent‐Based Spatial Model for Multidisciplinary and Multiscale Integration. Annals of the association of American geographers, 95(1), 54–79. [Google Scholar]
- Balcan D, Colizza V, Gonçalves B, Hu H, Ramasco J, & Vespignani A (2009). Multiscale mobility networks and the spatial spreading of infectious diseases. Proceedings of the National Academy of Sciences, 106(51), 21484–21489. [DOI] [PMC free article] [PubMed] [Google Scholar]
- Chao D, Halstead S, Halloran ME, & Longini I Jr (2012). Controlling dengue with vaccines in Thailand. PLoS neglected tropical diseases, 6(10), e1876. [DOI] [PMC free article] [PubMed] [Google Scholar]
- de Lima TFM, Lana RM, de Senna Carneiro TG, Codeço CT, Machado GS, Ferreira LS, Davis Junior CA (2016). DengueME: A Tool for the Modeling and Simulation of Dengue Spatiotemporal Dynamics. International Journal of Environmental Research and Public Health, 13(9), 920. [DOI] [PMC free article] [PubMed] [Google Scholar]
- Endy TP, Chunsuttiwat S, Nisalak A, Libraty DH, Green S, Rothman AL, Ennis FA (2002). Epidemiology of inapparent and symptomatic acute dengue virus infection: a prospective study of primary school children in Kamphaeng Phet, Thailand. American journal of epidemiology, 156(1), 40–51. [DOI] [PubMed] [Google Scholar]
- Favier C, Schmit D, Müller-Graf CD, Cazelles B, Degallier N, Mondet B, & Dubois MA (2005). Influence of spatial heterogeneity on an emerging infectious disease: the case of dengue epidemics. Proceedings of the Royal Society of London B: Biological Sciences, 272(1568), 1171–1177. [DOI] [PMC free article] [PubMed] [Google Scholar]
- Grimm V, Berger U, DeAngelis DL, Polhill JG, Giske J, & Railsback SF (2010). The ODD protocol: a review and first update. Ecological Modelling, 221(23), 2760–2768. [Google Scholar]
- Grimm V, & Railsback SF (2012). Pattern-oriented modelling: a ‘multi-scope’for predictive systems ecology. Philosophical Transations of The Royal Society B, 367(1586), 298–310. [DOI] [PMC free article] [PubMed] [Google Scholar]
- Grimm V, Revilla E, Berger U, Jeltsch F, Mooij WM, Railsback SF, DeAngelis DL (2005). Pattern-oriented modeling of agent-based complex systems: lessons from ecology. science, 310(5750), 987–991. [DOI] [PubMed] [Google Scholar]
- Gubler DJ (2002). Epidemic dengue/dengue hemorrhagic fever as a public health, social and economic problem in the 21st century. Trends in microbiology, 10(2), 100–103. [DOI] [PubMed] [Google Scholar]
- Halstead SB (2008). Dengue virus-mosquito interactions. Annual Review of Entomology, 53, 273–291. [DOI] [PubMed] [Google Scholar]
- Harrington LC, Buonaccorsi JP, Edman JD, Costero A, Kittayapong P, Clark GG, & Scott TW (2001). Analysis of survival of young and old Aedes aegypti (Diptera: Culicidae) from Puerto Rico and Thailand. Journal of medical entomology, 38(4), 537–547. [DOI] [PubMed] [Google Scholar]
- Harrington LC, Jones JJ, Kitthawee S, Sithiprasasna R, Edman JD, & Scott TW (2008). Age-dependent survival of the dengue vector Aedes aegypti (Diptera: Culicidae) demonstrated by simultaneous release–recapture of different age cohorts. Journal of medical entomology, 45(2), 307–313. [DOI] [PubMed] [Google Scholar]
- Harrington LC, Scott TW, Lerdthusnee K, Coleman RC, Costero A, Clark GG, Sithiprasasna R (2005). Dispersal of the dengue vector Aedes aegypti within and between rural communities. The American journal of tropical medicine and hygiene, 72(2), 209–220. [PubMed] [Google Scholar]
- Heppenstall AJ, Evans AJ, & Birkin MH (2007). Genetic algorithm optimisation of an agent-based model for simulating a retail market. Environment and Planning B: Planning and Design, 34(6), 1051–1070. [Google Scholar]
- Kang J-Y, & Aldstadt J (2017). The Influence of Spatial Configuration of Residential Area and Vector Populations on Dengue Incidence Patterns in an Individual-Level Transmission Model. International Journal of Environmental Research and Public Health, 14(7), 792. [DOI] [PMC free article] [PubMed] [Google Scholar]
- Karl S, Halder N, Kelso JK, Ritchie SA, & Milne GJ (2014). A spatial simulation model for dengue virus infection in urban areas. BMC infectious diseases, 14(1), 447. [DOI] [PMC free article] [PubMed] [Google Scholar]
- Knerer G, Currie CS, & Brailsford SC (2015). Impact of combined vector-control and vaccination strategies on transmission dynamics of dengue fever: a model-based analysis. Health care management science, 18(2), 205–217. [DOI] [PubMed] [Google Scholar]
- Latombe G, Parrott L, & Fortin D (2011). Levels of emergence in individual based models: Coping with scarcity of data and pattern redundancy. Ecological Modelling, 222(9), 1557–1568. [Google Scholar]
- Mammen MP Jr, Pimgate C, Koenraadt CJ, Rothman AL, Aldstadt J, Nisalak A, Ypil-Butac CA (2008). Spatial and temporal clustering of dengue virus transmission in Thai villages. PLoS Medicine, 5(11), e205. [DOI] [PMC free article] [PubMed] [Google Scholar]
- Mao L, & Bian L (2010). Spatial–temporal transmission of influenza and its health risks in an urbanized area. Computers, environment and urban systems, 34(3), 204–215. [DOI] [PMC free article] [PubMed] [Google Scholar]
- Narzisi G, Mysore V, & Mishra B (2006). Multi-objective evolutionary optimization of agent-based models: An application to emergency response planning. Computational Intelligence, 2006, 224–230. [Google Scholar]
- Nisalak A, Endy TP, Nimmannitya S, Kalayanarooj S, Scott RM, Burke DS, Vaughn DW (2003). Serotype-specific dengue virus circulation and dengue disease in Bangkok, Thailand from 1973 to 1999. The American journal of tropical medicine and hygiene, 68(2), 191–202. [PubMed] [Google Scholar]
- O’Sullivan D, & Perry GL (2013). Spatial simulation: exploring pattern and process: Chichester: John Wiley & Sons. [Google Scholar]
- Padmanabha H, Correa F, Rubio C, Baeza A, Osorio S, Mendez J, Diuk-Wasser MA (2015). Human Social Behavior and Demography Drive Patterns of Fine-Scale Dengue Transmission in Endemic Areas of Colombia. PloS one, 10(12), e0144451. [DOI] [PMC free article] [PubMed] [Google Scholar]
- Parker DC, Manson SM, Janssen MA, Hoffmann MJ, & Deadman P (2003). Multi‐agent systems for the simulation of land‐use and land‐cover change: A review. Annals of the association of American geographers, 93(2), 314–337. [Google Scholar]
- Parker DC, & Meretsky V (2004). Measuring pattern outcomes in an agent-based model of edge-effect externalities using spatial metrics. Agriculture, Ecosystems & Environment, 101(2), 233–250. [Google Scholar]
- Railsback SF, & Johnson MD (2011). Pattern-oriented modeling of bird foraging and pest control in coffee farms. Ecological Modelling, 222(18), 3305–3319. [Google Scholar]
- Reich NG, Shrestha S, King AA, Rohani P, Lessler J, Kalayanarooj S, Cummings DA (2013). Interactions between serotypes of dengue highlight epidemiological impact of cross-immunity. Journal of The Royal Society Interface, 10(86), 20130414. [DOI] [PMC free article] [PubMed] [Google Scholar]
- Reiner RC, Stoddard ST, & Scott TW (2014). Socially structured human movement shapes dengue transmission despite the diffusive effect of mosquito dispersal. Epidemics, 6, 30–36. [DOI] [PMC free article] [PubMed] [Google Scholar]
- Sabin AB (1952). Research on Dengue during World War The American journal of tropical medicine and hygiene, 1(1), 30–50. [DOI] [PubMed] [Google Scholar]
- Salje H, Lessler J, Endy TP, Curriero FC, Gibbons RV, Nisalak A, Thomas SJ (2012). Revealing the microscale spatial signature of dengue transmission and immunity in an urban population. Proceedings of the National Academy of Sciences, 109(24), 9535–9538. [DOI] [PMC free article] [PubMed] [Google Scholar]
- Smith DL, Dushoff J, & McKenzie FE (2004). The risk of a mosquito-borne infectionin a heterogeneous environment. PLoS biology, 2(11), e368. [DOI] [PMC free article] [PubMed] [Google Scholar]
- Stoddard ST, Forshey BM, Morrison AC, Paz-Soldan VA, Vazquez-Prokopec GM, Astete H, Halsey ES (2013). House-to-house human movement drives dengue virus transmission. Proceedings of the National Academy of Sciences, 110(3), 994–999. [DOI] [PMC free article] [PubMed] [Google Scholar]
- Stoddard ST, Morrison AC, Vazquez-Prokopec GM, Soldan VP, Kochel TJ, Kitron U, Scott TW (2009). The role of human movement in the transmission of vector-borne pathogens. PLoS neglected tropical diseases, 3(7), e481. [DOI] [PMC free article] [PubMed] [Google Scholar]
- Thomas SJ, Aldstadt J, Jarman RG, Buddhari D, Yoon I-K, Richardson JH, Rothman AL (2015). Improving dengue virus capture rates in humans and vectors in Kamphaeng Phet Province, Thailand, using an enhanced spatiotemporal surveillance strategy. The American journal of tropical medicine and hygiene, 93(1), 24–32. [DOI] [PMC free article] [PubMed] [Google Scholar]
- Tsuda Y, Takagi M, Wang S, Wang Z, & Tang L (2001). Movement of Aedes aegypti (Diptera: Culicidae) released in a small isolated village on Hainan Island, China. Journal of medical entomology, 38(1), 93–98. [DOI] [PubMed] [Google Scholar]
- Vaughn DW, Green S, Kalayanarooj S, Innis BL, Nimmannitya S, Suntayakorn S, Ennis FA (2000). Dengue viremia titer, antibody response pattern, and virus serotype correlate with disease severity. The Journal of infectious diseases, 181(1), 2–9. [DOI] [PubMed] [Google Scholar]
- Wang M, White N, Grimm V, Hofman H, Doley D, Thorp G, Wilkie J (2018). Pattern-oriented modelling as a novel way to verify and validate functional–structural plant models: a demonstration with the annual growth module of avocado. Annals of botany, 121(5), 941–959. [DOI] [PMC free article] [PubMed] [Google Scholar]
- WHO. (2012). Global strategy for dengue prevention and control 2012–2020.
- Yoon I-K, Getis A, Aldstadt J, Rothman AL, Tannitisupawong D, Koenraadt CJ, Jarman RG (2012). Fine scale spatiotemporal clustering of dengue virus transmission in children and Aedes aegypti in rural Thai villages. PLoS neglected tropical diseases, 6(7), e1730. [DOI] [PMC free article] [PubMed] [Google Scholar]


