

Summary
Diverse ribonucleoprotein complexes control messenger RNA processing, translation, and decay. Transcripts in these complexes localize to specific regions of the cell and can condense into non-membrane-bound structures such as stress granules. It has proven challenging to map the RNA composition of these large and dynamic structures, however. We therefore developed an RNA proximity labeling technique, APEX-Seq, which uses the ascorbate peroxidase APEX2 to probe the spatial organization of the transcriptome. We show that APEX-Seq can resolve the localization of RNAs within the cell and determine their enrichment or depletion near key RNA-binding proteins. Matching the spatial transcriptome, as revealed by APEX-Seq, with the spatial proteome determined by APEX-mass spectrometry (APEX-MS), obtained precisely in parallel, provides new insights into the organization of translation initiation complexes on active mRNAs, and unanticipated complexity in stress granule composition. Our novel technique allows a powerful and general approach to explore the spatial environment of macromolecules.
eTOC Blurb
In this issue of Molecular Cell, Padrón et al. (2019) develop an RNA proximity labeling technique that maps subcellular RNA organization comprehensively. A powerful aspect of APEX-Seq is the ability to match RNA proximity labeling with spatial proteomics for a comprehensive picture of the landscape of the cell.
Graphical Abstract
Introduction
Proximity labeling has emerged as a valuable approach for understanding patterns of protein interaction and localization within cells. Proximity labeling techniques rely on enzyme-catalyzed in vivo reactions that mark targets near the labeling enzyme — which is typically fused to a query protein — and enable later, ex vivo analysis. The labeling reaction occurs within living cells and often acts over tens of nanometers. Proximity labeling is thus particularly well suited to capture transient, dynamic, and heterogeneous structures, complementing biochemical purifications that rely on direct and stable interaction.
The most dramatic advances in proximity labeling involve protein biotinylation, through the use of enzymes that produce diffusible reactive intermediates — either short-lived radicals (Hung et al., 2016; Lam et al., 2015; Lee et al., 2016) or longer lived adenylate esters (Branon et al., 2017; Choi-Rhee et al., 2004; Kim et al., 2016; Rees et al., 2015; Roux et al., 2012). These protein labeling tools can only indirectly address the organization of DNA in chromatin and RNA in various nuclear and cytosolic granules (Kaewsapsak et al., 2017; Myers et al., 2018). Currently, DNA can be labeled enzymatically through the action of an adenosine methyltransferase, in the DamID technique(van Steensel and Henikoff, 2000). TRIBE is a similar approach for labeling RNAs with an adenosine deaminase (McMahon et al., 2016). While these base-modifying enzymes have proven valuable, for example in mapping binding sites of the heterochromatin protein CBX1 (HP1β) (Vogel et al., 2006; Hung et al., 2016; Lam et al., 2015; Lee et al., 2016), direct enzymatic modification operates only within a short, defined distance from the query protein and suffers from steric restrictions and other technical limitations.
Direct RNA proximity labeling promises new insights into the dynamic behavior of RNA. Translating RNAs move dynamically through the cytosol and often localize to specific regions of the cell (Morisaki et al., 2016; Wang et al., 2016; Wu et al., 2016; Yan et al., 2016). Inactive RNAs can be sequestered into protein-RNA granules through a process of liquid-liquid phase separation (LLPS) (Brangwynne et al., 2009; Hyman and Simons, 2012; Molliex et al., 2015). Stress granule formation dynamically alters macromolecular localization, and mutations that increase stress granule formation or limit stress granule clearance are implicated in neurodegenerative diseases (Li et al., 2013; Protter and Parker, 2016; Ramaswami et al., 2013). Recent work has argued that stress granules comprise two distinct components: a stable “core” surrounded by a concentration dependent “shell” (Jain et al., 2016), which contain distinct macromolecules. Therefore, labeling and isolation of RNAs from these sub-cellular compartments unveils the detailed mechanism and physiological relevance of this RNA localization.
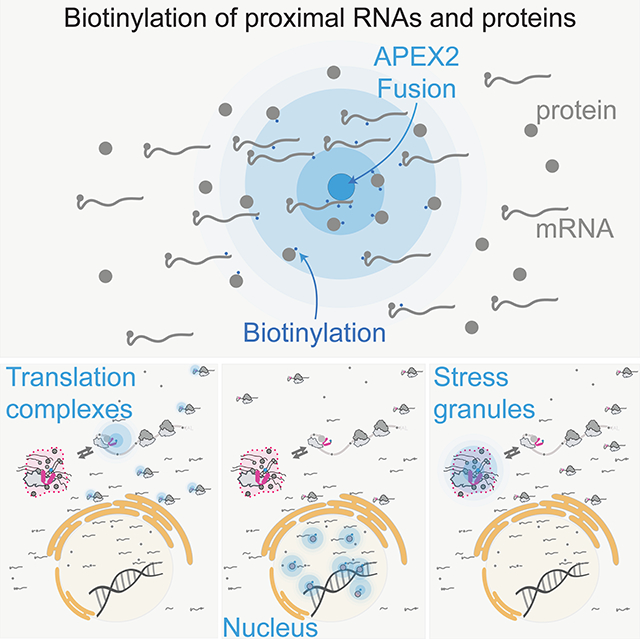
One powerful and distinctive approach for proximity labeling employs an engineered ascorbate peroxidase enzyme (APEX2) to convert a cell-permeable biotin-tyramide substrate into a highly reactive free radical that labels aromatic amino acids in proteins within ~25 nanometers (Hayat, 2007; Rhee et al., 2013). APEX2 labeling has already provided insight into the protein composition of stress granules (Markmiller et al., 2018). Motivated by the realization that nucleotides are also amenable to free radical-based chemistry (Chen et al., 2018), we developed an RNA proximity labeling technique, using APEX2 (APEX-Seq) as a way to probe the spatial organization of the transcriptome. We show that APEX-Seq can resolve the localization of RNAs within the cell and determine their enrichment or depletion near key RNA-binding proteins and in the stress granule. Because the same experimental setup is compatible with proximity protein labeling, we are able to probe the localization of our APEX2 fusion query relative to the ribosome and reveal unanticipated complexity within the stress granule. We then apply APEX-Seq to identify the transcripts that localize to stress granules and find that their composition varies depending on the stress applied. Our technique, which can capture RNA and protein, provides a powerful tool to explore the dynamics of RNAs and proteins in macromolecular assemblies and in LLPS.
Results
RNA biotinylation by the APEX proximity labeling enzyme
We reasoned that the radical mechanism underlying APEX proximity labeling of proteins(Lad et al., 2002) would lead to similar, proximity-dependent biotinylation of RNA as well (Figure 1A). Indeed, we found that purified recombinant APEX2 enzyme (Figures S1A and S1B) biotinylated RNA in vitro, in a reaction that depended on both biotin-tyramide and hydrogen peroxide, reminiscent of tyramide labeling of DNA by horseradish peroxidase (HRP) (Chen et al., 2018) (Figure 1B). Importantly, the biotinylation signal that we detected was RNase sensitive (Figure 1C), and thus reflects labeling of the RNA in the reaction.
Figure 1. APEX proximity biotinylation of RNA.

(A) Diagram of APEX proximity biotinylation of both protein and RNA.
(B) in vitro labeling of RNA as a function of both biotin-tyramide and hydrogen peroxide. A ssDNA 3’-biotin oligo was used as a positive control for streptavidin staining.
(C) in vitro biotinylated RNA subjected to RNase A treatment for 30 min at 37 °C.
(D) in vivo biotinylated RNA from an APEX2-eIF4A1 or Naive HEK293T cell line treated with DNase I for 30 min at 37 °C, or treated with RNase A for 5 hours at 37 °C.
We next verified that the APEX2 labeling reaction biotinylates RNA in vivo. In order to test RNA biotinylation, we expressed APEX2 fused to the DEAD-box RNA helicase eIF4A1 in HEK293T cells (Figure S1C). This fusion retained its ability to bind RNA, including RocA-dependent stabilization on polypurine tracts (Iwasaki et al., 2016), which depends on the protein’s normal RNA-binding interface (Iwasaki et al., 2016) (Figure S1D). Total RNA extracted from cells expressing this functional APEX2-eIF4A1 fusion was biotinylated after biotin-tyramide pre-incubation and peroxide treatment, in contrast to RNA from naïve cells treated in the same way, which showed no detectable biotin conjugate on RNAs (Figure 1D).
APEX-Seq captures sub-cellular RNA localization patterns
Having shown that the APEX reaction biotinylates RNA in vivo, we asked whether subcellular differences in RNA localization can be detected by purifying and sequencing these biotinylated RNAs. We targeted APEX2 to three distinct locations within the cell: 1) the cytoplasm, through the use of APEX2-GFP (Figure S1E); 2) the cytosolic face of the ER membrane, using a previously established C1(1–29)-APEX2 fusion (Lee et al., 2016) containing the 29 N-terminal residues of cytochrome P450 2C1 (rabbit CYP2C1) (Figure S1F); and 3) the nucleus, using a CBX1-APEX2 fusion that links APEX2 to heterochromatin protein 1 beta (HP1β) (Figure 1SG and Figure 2A). We carried out APEX2 labeling reactions in cells expressing each of these fusion proteins, purified the biotinylated RNA by streptavidin affinity, and analyzed both total and biotinylated RNA by deep sequencing. RNA-Seq read counts replicated extremely well in both total and streptavidin-purified samples (R2 ~ 0.99), confirming the reproducibility of our assay (Figures 2B, 2C, and S2A–S2D). Moreover, we saw distinctive patterns of enrichment and depletion after purifying biotinylated RNA by streptavidin affinity, confirming that APEX fusions were biotinylating RNA in a proximity-dependent manner (Figure S2E).
Figure 2. APEX proximity biotinylation reveals RNA sub-cellular localization.

(A) Diagram of localization using APEX-Seq.
(B and C) Correlation plot showing agreement between replicate samples for streptavidin affinity purification of biotinylated RNA from (B) an APEX2-GFP cell line and (C) streptavidin-pulldown C1-APEX2 cell line.
(D) GO term enrichment for transcripts preferentially labeled in C1-APEX2 and CBX1-APEX2 cell lines. Anchored component of the membrane n=15; extracellular matrix component n=10; interstitial matrix n=3; U1 snRNP n=9.
(E and F) volcano plot for (E) C1-APEX2 and (F) CBX1-APEX2 compared to APEX2-GFP showing enrichment and depletion for specific RNAs.
We next wanted to test whether these patterns of biotinylation reflected the sub-cellular localization of RNAs relative to the APEX fusion protein. We compared biotinylated RNA from C1-APEX2 fusions against the RNA labeled by our diffuse APEX-GFP control. Overall, we find 601 significantly enriched and depleted genes in this analysis. We found that C1-APEX2 labeling enriched strongly for mRNAs encoding membrane-associated proteins, reflecting their localization to the surface of the ER during co-translational secretion (Figures 2D–2E and S2F–S2G). The highest enrichment scores we saw included 139x enrichment of Golgi-Associated Plant Pathogenesis-Related Protein 1 (GLIPR2) mRNA and 86x enrichment of the SLC16A7 transcript, which encodes a bidirectional transporter of short-chain monocarboxylates (Lin et al., 1998). In contrast, transcripts encoding soluble cytosolic proteins such as PFDN4, a subunit of the heterohexameric chaperone prefoldin, and nuclear proteins such as the bZIP transcription factor CEBPE, were depleted in C1-APEX2 relative to APEX2-GFP (Lin et al., 1998; Vainberg et al., 1998) (Figure 2E). While most mRNAs preferentially labeled by C1-APEX at the ER membrane encoded secreted proteins, we did observe enrichment for some transcripts encoding proteins with no known transmembrane or secretion signal. We tested the localization of one such RNA, Rotatin (RTTN) (Faisst et al., 2002), by single-molecule fluorescence in situ hybridization (smFISH) (Femino et al., 1998; Raj et al., 2006). Consistent with our proximity labeling results, we find that RTTN mRNA colocalizes with C1-APEX protein at the ER membrane, whereas the GAPDH control mRNA is distributed uniformly throughout the cytosol (Table S1, Figure S2H–S2K).
Likewise, we found that the nuclear CBX1-APEX2 fusion preferentially labeled non-coding nuclear RNAs (Figure 2F and S2E). Overall, we saw 196 significantly enriched and depleted genes in the CBX1-APEX analysis. We saw a strong enrichment of the 7SK small nuclear pseudogene (RN7SKP9), as well as an enrichment of TSIX, the antisense transcript derived from the XIST locus. By contrast, we saw depletion of the mRNA encoding for Elongation Factor 1 Alpha 2, a highly abundant coding transcript (Figure 2F). Taken together, the data from our C1-APEX2 and CBX1-APEX2 labeling show that APEX-Seq captures patterns of RNA localization across cellular compartments even when these are not separated by membranes.
APEX-Seq captures protein-RNA interaction patterns
We next asked whether patterns of protein-RNA interaction, occurring on an even finer length scale, could be detected by APEX-Seq enrichment. In addition to the APEX2-eIF4A1 fusion described above, we fused APEX2 to the 7-methylguanosine (m7G)-cap binding protein eIF4E1 (Figure 3A). We compared biotin-labeled RNAs from cells expressing APEX2-eIF4E1 against total RNA and observed the depletion of non-coding RNAs, like SNORA73B, which possess 2,2,7-trimethylguanosine caps that bind eIF4E1 with far lower affinity (Niedzwiecka et al., 2002) (Figure S3A). In our APEX-eIF4E analysis, we find 550 significantly enriched and depleted genes. Intriguingly, we observed the strongest enrichment for immediate early genes FOSB and EGR3 (Figure 3B). Immediate-early genes are preferentially translated when the eIF4E1-interacting scaffold eIF4G is limiting (Johannes et al., 1999), and enrichment of these transcripts may reflect their preferential association with eIF4E1. Several proto-oncogenes, including c-Myc, were also preferentially translated in conditions of limiting eIF4G (Johannes et al., 1999). Indeed, eIF4E1 is an oncogene whose overexpression promotes cellular transformation (Pelletier et al., 2015); (Graff et al., 2007). In line with these observations, we found that APEX2-eIF4E1 preferentially labels the oncogenic C-MYC, VEGF-A, and FGF13 mRNAs (Figure 3C). More broadly, protein synthesis of long, structured 5′ UTR-containing mRNAs appear to be sensitive to eIF4E1 levels (Pelletier et al., 2015; De Benedetti and Graff, 2004; Kozak, 1991), and indeed we found greater enrichment of long 5′ UTR containing mRNAs in the top 2.5% of enriched genes (102 genes) upon labeling by APEX2-eIF4E1, as opposed to the bottom 2.5% of depleted genes (101 genes) (Figure 3D). The eIF4E1 transcript was also enriched, perhaps reflecting nascent APEX2-eIF4E1 biotinylating its own mRNA (Figure 3B).
Figure 3. APEX proximity biotinylation reveals ribonucleoprotein complex composition.

(A) Diagram of the 43S preinitiation complex. Blue sticks signify biotin adducts formed from the proximity labeling reaction catalyzed by APEX2.
(B) Volcano plot for APEX2-eIF4E1 showing enrichment and depletion of specific RNAs compared to APEX2-GFP.
(C) Barplot showing enrichment for mRNAs encoding cell transforming proteins in APEX2-eIF4E1.
(D) 5’ UTR length distribution for APEX2-eIF4E1 enriched or depleted RNAs. P-values calculated using the Mann-Whitney test. Enrichment and depletion is calculated as statistically significant (FDR ≤0.05) and either top or bottom 2.5% of the fold change.
(E) Correlation plot between APEX2-eIF4E1 and APEX2-eIF4A1 datasets in comparison to APEX2-GFP, highlighting uniquely enriched mRNAs with respect to APEX2-eIF4E1.
(F) APEX-MS and (G) APEX-Seq of APEX2-eIF4E1 cells upon PP242 treatment as compared to DMSO treated controls. 5’ TOP RNAs were defined previously (Yamashita et al., 2008). P value calculated using the Mann-Whitney test. P value calculated using the Mann-Whitney test.
Next, we asked whether APEX2-eIF4E1 and APEX2-eIF4A1 showed similar labeling patterns, since, along with the scaffold protein eIF4G, they form the eIF4F translation initiation complex. Indeed, we found good correspondence between their respective labeling patterns (Figure 3E). Both proteins enriched mRNAs that encode translation machinery proteins, which are known to show a particular sensitivity to inhibition of eIF4E1 (Hsieh et al., 2012; Thoreen et al., 2012) and eIF4A1 (Iwasaki et al., 2016). While eIF4E1 and eIF4A1 labeling patterns overlapped substantially, they were not identical. The similarity between eIF4E1 and eIF4A1 labeling patterns reflected the co-localization of these proteins, as we found a substantially weaker correlation in RNA labeling between CBX1-APEX2 and APEX2-eIF4A1 fusions (Figure S3B).
APEX-Seq identifies APEX2-eIF4E1 in proximity to LARP1 and 5’-TOP RNAs during mTORC1 inhibition
Cells regulate both global and gene-specific translation in response to nutrient signals transduced by the mechanistic target of rapamycin complex 1 (mTORC1). Active mTORC1 phosphorylates and inactivates 4E-binding protein 1 (4E-BP1), an inhibitor of eIF4E1, thereby allowing eIF4F complex formation and stimulating bulk protein synthesis (Saxton and Sabatini, 2017). Translation of mRNAs that contain 5’ terminal oligopyrimidine tracts (5’TOPs) — which encode many ribosomal proteins and translation elongation factors — are particularly sensitive to mTORC1 activity (Amaldi and Pierandrei-Amaldi, 1997; Hershey et al., 1996). Translation of these 5’TOP mRNAs is regulated by LA-related protein 1 (LARP1), a direct mTORC1 target that binds directly to 5’TOP motifs and interferes with eIF4E1 binding (Fonseca et al., 2015; Lahr et al., 2017; Philippe et al., 2018; Tcherkezian et al., 2014). While some studies suggest that LARP1 is recruited to 5’TOP mRNAs when mTORC1 is inactive (Fonseca et al., 2015), others argue that LARP1 remains constitutively bound to 5’TOP mRNAs and controls access to their 5’ cap (Hong et al., 2017). While it is clear that mTORC1 inhibition permits 4EBP1-eIF4E1 interactions that disrupt the eIF4E1-eIF4G1 interaction (Saxton and Sabatini, 2017), the overall impact of mTORC1 activity on these initiation complexes remains unclear.
Since APEX2 has been used for proximity-specific protein labeling(Hung et al., 2016; Lam et al., 2015), our observation that APEX2 can label RNA now offers the dual use of APEX2 to match spatially resolved transcriptomic and proteomic data. We therefore performed quantitative tandem mass tag (TMT) mass spectrometry (Rauniyar and Yates, 2014) in cells expressing APEX2-eIF4A1 (Figures S1C and S4A). Ratiometric analysis using TMT labeling showed reproducible quantitation between biological replicates (Spearman’s ρ ~ 0.98) (Figures S4B and S4C). We assessed the impact of mTORC1 inhibition on the eIF4E1-proximal proteome and transcriptome. We treated cells with PP242, an active-site mTORC1 inhibitor that relieves repression of 4E-BP1 by mTORC1 (Feldman et al., 2009; Thoreen et al., 2009). APEX-MS analysis of PP242-treated cells confirmed a reduction of eIF4G1 and PABPC1 proximity labeling along with enhanced labeling of 4EBP1 (Figure 3F). Surprisingly, PP242 treatment enhanced APEX2-eIF4E1 labeling of LARP1, suggesting greater proximity between these proteins despite their mutually exclusive binding to the 5’ cap (Figure 3F). Even more strikingly, APEX-Seq revealed that PP242 treatment enhanced APEX2-eIF4E1 proximity labeling of 5’ TOP RNAs relative to the transcriptome overall (Figure 3G). Taken together, these results suggest that, although LARP1 may bind directly to the 5’ cap of mRNAs upon mTORC1 inhibition (Lahr et al., 2017; Philippe et al., 2018), the eIF4E1•4EBP1 complex remains in close proximity to 5’ TOP RNAs.
Proximity proteomics places eIF4A1 on the 3′ side of the 43S preinitiation complex
We found that eIF4A1 labeling enriches other components of the eIF4F complex — the cap-binding protein eIF4E1 and the scaffolding protein eIF4G1 — as well as the poly(A) binding protein, PABPC1, which binds eIF4G1 (eight enriched translation initiation factors), and several small subunit ribosomal proteins (11 enriched and depleted RPS proteins) (Figures 4A and 4B). More broadly, APEX2-eIF4A1 spatial proteomics showed enrichment for translation initiation, RNP organization, and post-transcriptional regulators in gene ontology enrichment analysis (Figure 4C). This pattern of enrichment was similar to BioID analysis of eIF4A1, which relied on long duration (24 hour) labeling by an eIF4A1-birA* fusion protein(Youn et al., 2018). We saw a substantial (~25%) overlap between the proteins enriched in our rapid (<1 minute) APEX labeling experiment and those seen in long-term BioID labeling (hypergeometric P < 0.01) (Figure S4D).
Figure 4. Proximity proteomics places eIF4A1 on the 3’ side of the 43S preinitiation complex.

(A) Enrichment of translation initiation factors (orange) in APEX2-eIF4A1 proximity labeling relative to APEX2-GFP. Points in orange signify translation initiation factors. Dashed vertical line signifies proximity to APEX-eIF4A (to the right of the line are proteins in close proximity, and to the left of the line are less proximal proteins). Horizontal dashed line signifies FDR corrected significance cutoff.
(B) Enrichment and depletion of small subunit ribosomal proteins in APEX2-eIF4A1 proximity labeling. Significantly enriched proteins in pink, depleted in blue, and others in black. Dashed vertical line signifies proximity to APEX-eIF4A (to the right of the line are proteins in close proximity, and to the left of the line are proteins in farther proximity). Horizontal dashed line signifies FDR corrected significance cutoff. (C) GO term enrichment for APEX2-eIF4A1 as compared to APEX2-GFP. Regulation of translational initiation n=9; Regulation of Translation n=19; Regulation of cellular amide metabolic process n=19; RNP complex subunit organization n=12; posttranscriptional regulation of gene expression n=20. (D) Mapping enriched (pink) or depleted (blue) eIF3 and RPS subunits onto the eukaryotic pre-initiation complex. Different perspectives of the 43S complex are shown. Differently colored proteins signify FDR corrected P values.
We noticed a striking pattern of enrichment for some small subunit ribosomal proteins and depletion of others, despite their uniform presence in 43S pre-initiation complexes (Figures 4B and S4E). To better understand why different 40S proteins show enrichment or depletion in APEX2-eIF4A1 proteomics, we mapped these proteins onto the structure of the eukaryotic 43S preinitiation complex (Llácer et al., 2015). We found that the proteins enriched by APEX2-eIF4A1 were situated near the mRNA entry site of the 43S preinitiation complex, on the side towards the 3′ end of the mRNA, while the depleted proteins lie closer to the mRNA exit site (Figure 4D). The 43S preinitiation complex also binds to eIF3, a large, multi-protein complex that plays diverse roles in translation initiation (Figure 4D). Enriched eIF3 subunits were also localized toward the mRNA entry site (des Georges et al., 2015). These data clearly place the RNA helicase eIF4A1 on the leading edge of the 43S complex, addressing an open question about the organization of this complex (Hinnebusch, 2014).
eIF4A1 proximity labeling captures the stress granule proteome
In addition to translation initiation factors, we noticed that APEX2-eIF4A1 labeling enriched a number of stress granule proteins (Figure S5A), although we saw no evidence of stress granule formation in these unstressed cells (Figure 5A). Our observation was consistent with previous studies reporting the presence of eIF4A1 in stress granule cores (Jain et al., 2016), which are pre-existing structures present prior to SG formation (Wheeler et al., 2016), as well as the BioID proximity labeling of stress granule components after long term (24 hour) expression of eIF4A1-birA* in unstressed cells (Youn et al., 2018). Indeed, APEX2-eIF4A1 labeling after stress resulted in an ~10x enrichment of biotin signal inside granules relative to the overall cytoplasm (Figures 5B and 5C), demonstrating a strong and specific enrichment of APEX2-eIF4A1 within stress granules after heat shock. These results suggested that we could use our APEX2-eIF4A1 fusion to study the stress granule transcriptome and proteome together. Furthermore, the short (<1 minute) proximity labeling offered the possibility of tracking the dynamics of SG assembly.
Figure 5.

(A) Immunofluorescence for flag tagged APEX2-eIF4A1 in unstressed cells.
(B) Diagram of APEX2-eIF4A1 immunofluorescence assay showing the biotinylation intensity of APEX2-eIF4A1 inside and outside stress granules.
(C) As in (A), after a 20 minute heat shock treatment at 42 °C. Biotinylated macromolecules are labeled with Strep-ALEXA633, and the streptavidin staining intensity is quantified in granules and overall cytosol. Error bars signify standard error of the mean.
(D) As in (A), after a 20 min heat shock at 44 °C.
(E and F) Correlation plots for peptide abundance from quantitative TMT labeling proteomics at (E) T0 and (F) T20 for a APEX2-eIF4A1 heat shock time course. Axes are log transformed.
(G) Comparison between T20 post heat shock with respect to pre heat shock (T0) vs APEX2-eIF4A1 with respect to APEX2-GFP. SG core, heat shock (HS) responsive proteins (light pink, FDR corrected P value ≤ 0.05), SG core proteins that are heat shock insensitive (lavender, FDR corrected P value ≤ 0.05), SG core proteins that are heat shock insensitive (purple, FDR corrected P value ≤ 0.05).
(H) Coefficients showing features that contribute positively (blue) or negatively (red) in predicting RNA granule residency in T20 with respect to T0. continuous features: mean charge, <charge>, Michelitsh-Weissman (MW) score, Prion Propensity score, mean hydropathy, <hydropathy>. Categorical features: RRM n=52; PDZ n=17; UBA domain n=6; SH3 domain n=14; LIM domain n=12; PTB domain n=3; C2 domain n=16; Helicase_C domain n=3; pKinase domain n=32; PH domain n=5; WD40 domain n=28; DEAD domain n=16.
We monitored the protein dynamics through a 20-minute time course of stress granule assembly following 44 °C heat shock (Figures 5A–5D). Replicates from our quantitative TMT-labeled proteomics correlated well (Spearman’s ρ ~ 0.98) (Figures 5E and 5F). The granule proteome at our final timepoint appeared broadly consistent with the proteins identified in previous proximity labeling studies, carried out after long stress induction regimes when granules were fully assembled. The quantitative changes in APEX2-eIF4A1 labeling that we saw after 20 minutes of heat shock correlated with the changes in BioID labeling (Youn et al., 2018) induced by 3 hours of arsenite treatment (ρ = 0.24) (Figure S5B). This modest correlation was enhanced by restricting our analysis to proteins with an established eIF4A1 interaction or stress granule localization (n = 22, ρ = 0.54) (Figure S5B), suggesting that these two very different labeling strategies captured the same underlying stress granule proteome. We also saw a strong correlation between proteins showing stress-induced APEX2-eIF4A1 labeling in our study and previous proximity labeling studies using the granule marker G3BP1 (Markmiller et al., 2018).
While stress granules are dynamic structures in vivo, previous work has identified a stable “core” that can be purified biochemically(Jain et al., 2016; Wheeler et al., 2017). In order to better understand how proximity labeling patterns mapped onto stress granule assembly, we investigated these core stress granule proteins in our data. We defined a set of “stress responsive” proteins that were statistically enriched in APEX2-eIF4A1 labeling, in comparison with APEX2-GFP, and were further enriched in a comparison between APEX2-eIF4A1 labeling of the post-shock (T20) time point with respect to the pre-shock (T0) time point. In contrast, proteins labeled “stress insensitive” were defined as those that were not significantly enriched or depleted in a comparison between APEX2-eI4FA1 labeling of the pre-shock (T0) and latest post-shock (T20) timepoints, but were enriched in a comparison between APEX2-eIF4A1 as compared to APEX2-GFP. Interestingly, we found a subset of the stress granule core components to show stress-insensitive eIF4A1 enrichment (Elden et al., 2010) (Figure 5G), including ATXN2, a protein implicated in amyotrophic lateral sclerosis (ALS) (Elden et al., 2010).
Previous work has implicated low complexity protein domains in stress granule formation (Molliex et al., 2015). We asked if there were other protein features predictive of stress granule residency. To do this, we compared our final post-shock time point (T20) with respect to our pre-shock time point (T0). Prion propensity (Lancaster et al., 2014; Toombs et al., 2012) did not predict SG residency in our analysis (Figure 5H). On the other hand, we found the presence of RNA recognition motifs (RRMs) to be most predictive of RNA granule residency, whereas DEAD-box RNA helicases are depleted (Figures 5H and S5C–S5D). These data suggest a central role for RNA interactions in recruiting proteins to stress granules and a role for some RNA helicases in opposing granule assembly.
Proximity labeling reveals the dynamic proteome of assembling stress granules
We took advantage of the high time resolution offered by rapid (<1 minute) APEX labeling in order to capture the detailed dynamics of stress granule assembly (Figures 6A and 6B). We observed substantial changes in eIF4A1 labeling across the time course, and principal component analysis of these changes revealed that the first principal component captured ~50% of variation and described an increasing trend across the time course of SG assembly (Figure 6C). The inflection point in this increase occurred after 5 minutes, which corresponds to the time when microscopically observable stress granules appear (Figure 6B). The component loadings from PC1 were dominated by increases in SG-related proteins like G3BP1 along with decreases in translation initiation and elongation factors (Figure 6D).
Figure 6. Timecourse of stress granule assembly.

(A) Diagram of APEX2-eIF4A1 heat shock time course.
(B) Number of granules per cell in a immunofluorescence time course (n=35 per time point).
(C) First principle component as a function of heat shock stress time points.
(D) Component loadings for the first principle component of an APEX2-eIF4A1 heat shock time course.
(E) Heatmap result from ImpulseDE2 highlighting significantly changing (FDR ≤0.01) proteins that: decrease transiently with respect to heat shock (Cluster 1), increase transiently over time (Cluster 2), decrease gradually over time (Cluster 3), or increase gradually over time (Cluster 4) with respect to heat shock.
Hierarchical clustering segregated proteomics data from unstressed controls and early (2 – 4 minute) timepoints away from later (6 – 20 minute) samples (Figure S6A). This distinction between early and late timepoints also agreed with the time course of microscopically observable SG assembly (Figure 6B). We therefore partitioned our data into overlapping “early” (0 – 4 min), “middle” (2 – 10 min), and “late” (6 – 20 min) categories and identified proteins enriched in each of these groups. This analysis highlighted a number of important SG forming proteins in the “middle” timepoints, such as CAPRIN1 (Katoh et al., 2013; Kedersha et al., 2016) (Figures S6B–S6D). The stress granule forming protein, G3BP1, which interacts with CAPRIN1 (Kedersha et al., 2016), appeared in the “late” timepoints, suggesting an order of events in interactions with respect to eIF4A1. More broadly, GO terms for RNA localization are enriched during the late time point (Figure S6E). Upon independent confirmation through immunofluorescence, we find eIF4A1 heat shock granules to contain more G3BP1 at later heat shock time points than at earlier time points (Figure S6F and S6G). This result is corroborated by our APEX-MS results wherein G3BP1 appears differentially enriched at later heat shock time points. Additionally, previous work has posited that translation initiation complexes are responsible for nucleating stress induced RNA granules (Panas et al., 2016). Of course, the complexity of macromolecular condensate formation may not be fully captured by a single proximity labeling query protein, and additional labeling experiments could reveal other early interactions that precede visible SG formation.
While the BioID data suggests that stress granule formation is driven by pre-existing interactions that remain largely unchanged after stress (Youn et al., 2018), we found a substantial and coherent change in the pattern of eIF4A1 proximity labeling across stress granule assembly. The rapid (< 1 minute) labeling enabled by APEX2, in conjunction with our high-resolution timecourse, allowed us to resolve these dynamics more clearly. These dynamics also manifested in the correlation between proteins showing stress-induced APEX2-eIF4A1 labeling in our study and previous proximity labeling studies using the granule marker G3BP1 (Markmiller et al., 2018). This correspondence was strongest for our “middle” class of proteins (P < 1e-10, hypergeometric test), and was also significant for our “late” class (P < 0.02). These G3BP1-proximal proteins overall showed significantly higher labeling in our analysis of “middle” timepoints, relative to other proteins, as well (P < 1e-15, Wilcoxon test). Notably, we found G3BP1 in our “late”-enriched group and it shows heat shock responsive labeling by APEX2-eIF4A1. These results were consistent with G3BP1 and eIF4A1 co-localizing to stress granules, thus showing stronger mutual labeling and more similar overall labeling patterns after stress.
We took advantage of our high time resolution and further refined this analysis by fitting the dynamics of eIF4A1 proximity labeling with impulse models using ImpulseDE2 (Fischer et al., 2018) (Figure 6E). This approach could identify proteins showing unidirectional trajectories of increased or decreased labeling, in addition to finding those showing transient changes. This analysis agreed with our hierarchical clustering results, as we found that “middle” timepoint proteins such as CAPRIN were induced early in the impulse model (cluster 2), whereas “late” proteins like G3BP1 more gradually accumulated over time (cluster 4). Overall, these data highlight the dynamic nature of the stress granule proteomic landscape with respect to APEX2-eIF4A1 as it is assembled upon heat shock.
APEX-Seq reveals that different stresses yield distinct granule RNAs
The critical role for sequence-specific RNA binding proteins in SG assembly led us to analyze their RNA composition. We performed APEX-Seq on cells subjected to heat shock as well as cells treated with hippuristanol, a drug that directly targets eIF4A1 and induces RNA granule formation through a phospho-eIF2α-independent mechanism (Panas et al., 2016). While hippuristanol itself disrupts the eIF4A1 / RNA interaction, eIF4A1 is readily recruited into hippuristanol-induced stress granules (Mazroui et al., 2006). Both heat shock and hippuristanol cause substantial changes in the pattern of APEX2-eIF4A1 labeling (Figures S7A and S7B). Interestingly, we observed that distinct RNAs are enriched in eIF2α-dependent SGs formed after heat shock and in eIF2α-independent SGs induced by hippuristanol treatment. Heat shock enriches for longer RNAs with lower translational efficiency (Figures 7A–7B and S7C–S7E), similar to the pattern of mRNAs that co-purify with arsenite-induced stress granule cores (Khong et al., 2017). Indeed, we saw a statistically significant overlap (P < 1e-6) between these stress granule core RNAs and those we identified after heat shock, although the experiments were carried out in different cell lines and under different stresses. In contrast, these factors show little or no correlation with enrichment after hippuristanol treatment (Figures 7C–7D and S7F–S7H), suggesting that different transcripts may enter granules depending on the nature of the stress, especially when it modulates eIF4A1 directly.
Figure 7. RNA composition of stress granules differs according to the stressor.

(A) Cumulative distribution plot for enriched and depleted RNA length for heat shock stress granule (T20 vs T0). P values were calculated using the Mann-Whitney test.
(B) Translation efficiency distributions for enriched and depleted RNAs during heat shock granule formation.
(C) As in (A) for hippuristanol stress granules.
(D) As in (B), for hippuristanol stress granule formation.
(E) TIA1 eCLIP binding site counts for either total, or enriched RNAs during hippuristanol or heat shock stress granule formation. P-values calculated using the Mann-Whitney test. Enrichment and depletion is calculated as statistically significant (FDR ≤0.05) and either top or bottom 2.5% of the fold change. Outliers were removed for clarity.
Interestingly, while RNAs with longer ORFs were enriched in heat-induced stress granules, they took longer to enter these granules after heat shock. The length bias we saw 20 minutes after heat shock (T20) was absent 4 minutes (T4) post heat shock (Figure S7I). This change was driven by the accumulation of long transcripts in stress granules at later timepoints: ~45% of the RNAs enriched at T4 were also enriched at T20; in contrast, only ~12% of T20-enriched transcripts were also enriched at T4. We confirmed that ITPR2, a long RNA transcript, colocalized less with incipient eIF3A foci at early time points and accumulated in these eIF43A-containing SGs at later heat shock timepoints as assessed by smFISH (Figure S7L–P). The slower entry of long RNAs into stress granules may reflect the fact that elongating ribosomes take longer to finish translation on longer CDSes (Khong and Parker, 2018). Stress granule formation requires elongating ribosome to disengage from mRNAs (Buchan and Parker, 2009), and run-off elongation from longer ORFs should take more time than run-off from shorter ORFs after stress-induced initiation shutoff.
Key stress granule markers such as TIA1, HNRNPA1, and G3BP1 are RNA-binding proteins, and indeed, we saw strong enrichment for RBPs in our proteomics data (Figure 5H). We thus took advantage of available enhanced RNA crosslinking and immunoprecipitation (eCLIP) data to search for correlations between SG enrichment and protein interactions across the transcriptome. In agreement with previous work, we found that RNAs enriched in either the heat shock or the hippuristanol SG transcriptome contain more TIA1 and HNRNPA1 binding sites than expected by chance (Khong et al., 2017) (Figures 7E and S7J). In contrast, G3BP1 showed enrichment only in hippuristanol SG transcripts (Figure S7K).
Discussion
We have developed an approach to study sub-cellular RNA localization by proximity labeling and deep sequencing (Figure 1). The APEX-Seq approach captures patterns of localization both across (Figure 2) and within different compartments (Figure 3). Notably, the 10 – 100 nm range of APEX2 proximity labeling and the very general reactivity of radical-based APEX labeling promise powerful new capabilities for characterizing protein-RNA and protein-DNA structures in cells. It will complement chromatin immunoprecipitation (ChIP) and RNA crosslinking and immunoprecipitation (CLIP) by detecting weak or long-range interactions that are not well captured by crosslinking and circumventing the need for protein immunoprecipitation. Furthermore, the same APEX fusion protein can be used to characterize protein and RNA localization, promising new insights into dynamic and heterogeneous protein-RNA complexes within cells.
We have taken advantage of APEX-Seq in conjunction with proteomics to provide new insights into the organization of translation initiation complexes on active mRNAs and the composition of repressive RNA granules. Our data indicate that eIF4A1 assembles onto the 3′ end of the 43S preinitiation scanning complex, near the mRNA entry site (Figure 4). To date, the identification of eIF4F with respect to the preinitiation scanning complex remains unknown (Hinnebusch, 2014; Pisareva et al., 2008). The similar position of other DEAD-box proteins at ribosome entry site (Hashem et al., 2013; Oh et al., 2016) suggested a similar role(s) in DEAD-box proteins in translation. We also found that eIF4A1 and eIF4E1, another component of eIF4F, show similar patterns of enrichment across the transcriptome consistent with their involvement in nearly all cap-dependent translation as part of the eIF4F complex. Our results agree broadly with the transcript-specific effects of modulating eIF4F activity.
We also reported the RNA as well as the protein composition of stress granules in vivo with respect to APEX2-eIF4A1. During heat shock, we find dynamic changes in the organization of the proteome that reflect the assembly of eIF4A1, along with many other proteins, into stress granules. Previous studies have argued that stable stress granule cores (Jain et al., 2016) form first, and a more dynamic outer shell then assembles onto them by liquid-liquid phase separation (LLPS) (Wheeler et al., 2016). In agreement with previous work, we found increased labeling of many stress granule core proteins early during granule formation(Wheeler et al., 2016). Interestingly, however, certain core granule interactions appear to occur independent of stress (Figure 5), suggesting a model in which stress granule cores reflect at least in part the stabilization or enhancement of pre-existing interactions. We also found that the RNA content of stress granules, with respect to APEX2-eIF4A1, can vary depending on the nature of the stress, with potential impacts on the transcriptome as well as on protein synthesis (Figure 7).
Matching both the spatial transcriptome using APEX-Seq and the spatial proteome using APEX-MS is a particularly powerful approach to better understand the organization of the cell. Critically, with the use of ratiometric comparisons, its use extends to non-membrane bound organelles that remain challenging to work with through more classic techniques, such as RNA granules. This approach addresses a need that cannot easily be met using existing techniques. Protein-RNA crosslinking has revolutionized our understanding of RNA-binding proteins and their targets, but it typically requires direct contact on the ~0.3 nm length scale of a covalent bond. Single-molecule fluorescence in situ hybridization is capable of measuring sub-cellular RNA localization, but it is limited by the ~100 nm resolution of optical microscopy and can target only a few, pre-chosen transcripts. The intermediate length scale of APEX-Seq complements these techniques and is well suited to address important questions about the organization of transcripts during synthesis, processing, transport, translation, and decay at sub-cellular resolution.
STAR Methods
Lead Contact and Materials Availability
Plasmids generated in this study have been deposited to Addgene, Cat. Nos. 129640 through 129646. Further information and requests for resources and reagents should be directed to and will be fulfilled by the Lead Contact, Nicholas Ingolia (ingolia@berkeley.edu).
Experimental Model and Subject Details
Cell Culture
HEK 293 Flp-In T-Rex cells (Invitrogen) were cultured in DMEM + GlutaMAX (ThermoFisher Scientific, 10566–016) with 10% FBS. APEX fusion plasmids were transfected along with pOG44 by X-tremeGENE 9 (Roche) and selected using 150 μg ml−1 of Hygromycin B and 15 μg ml−1 of Blasticidin to obtain stable integrants. TMT mass spec reagents (Thermo Fisher Scientific) were used for every quantitative mass spec experiment. Biotin-tyramide was purchased from Iris Biotech (catalog #: LS-3500.1000).
Method Details
DNA construction
Plasmids were constructed by Gibson assembly in pCDNA5 or pET28a vectors, as indicated, using PCR amplicons generated using the primers listed below.
pCDNA5-APEX2-GFP: APEX2 was amplified from pcDNA3 APEX2-NES (Addgene # 49386).
APEX2 FWD GACTCTAGCGTTTAAACTTACACCATGGGAAAGTCTTACCCAACT
APEX2 REV TCCTCGCCCTTGCTCACCATGTCCAGGGTCAGGCGCTCCA
GFP FWD TGGAGCGCCTGACCCTGGACATGGTGAGCAAGGGCGAGGA
GFP REV CGGGCCCTCTAGACTCGAGCTCACTTGTACAGCTCGTCCA
pcDNA5/FRT/TO C1-APEX2: (The C1(1–29) coding sequence was ordered as a synthetic DNA from IDT)
APEX-GFP FWD AGCTTGGGTTTGCTGATGCCATGGTGAGCAAGGGCGA
APEX-GFP REV AGTACAACCACGGGGTCCATGGTGTAAGTTTAAACGCTAGAGTCCG
C1(1–29)-APEX2 FWD CTAGCGTTTAAACTTACACCATGGACCCCGTGGTTGTAC
C1(1–29)-APEX2 REV TCCTCGCCCTTGCTCACCATGGCATCAGCAAACCCAAG
pcDNA5/FRT/TO CBX1-APEX2: (CBX1 was amplified from human cDNA)
APEX-GFP FWD (1) CCCAAGAAAAAACGCAAGGTGGCTCGAGTCTAGAGGGCCCG
APEX-GFP REV (1) CTTGTCGTCATCGTCTTTGTAGTCCATGGTGTAAGTTTAAACGCTAGAGTCCGG
CBX1 (ENSG00000108468) FWD ATGGACTACAAAGACGATGACGACAAGGGGAAAAAACAAAACAAGAAGAAAGTGG
CBX1 (ENSG00000108468) REV ACTCACAGTTGGGTAAGACTTTCCGTTCTTGTCATCTTTTTTGTCATCATCCT
APEX-GFP FWD (2) TGACAAAAAAGATGACAAGAACGGAAAGTCTTACCCAACTGTGAGTGCT
APEX-GFP REV (2) CACCTTGCGTTTTTTCTTGGGGGCATCAGCAAACCCAAGCTC
pcDNA5/FRT/TO APEX2-eIF4A1: (eIF4A1 was amplified from human cDNA)
APEX-4A FWD (1) ATGTTGCTGACCTCATCTGATGGTACCGAGCTCGGATCCACTAGTCCAGT
APEX-4A REV (1) CTTGTCGTCATCGTCTTTGTAGTCCATGTCCAGGGTCAGGCGCTCCAGGG
APEX-4A FWD (2) ATGGACTACAAAGACGATGACGACAAGATGTCTGCGAGCCAGGATTCCCGATCC
APEX-4A REV (2) TGGATCCGAGCTCGGTACCATCAGATGAGGTCAGCAACATTGAGGGGCA
pcDNA5/FRT/TO APEX2-eIF4E1: (eIF4E1 was amplified from human cDNA)
APEX-GFP FWD AAAATAGGTTTGTTGTTTAAGCTCGAGTCTAGAGGGCCC
APEX-GFP REV TCCGGTTCGACAGTCGCCATGTCCAGGGTCAGGCGC
EIF4E (ENSG00000151247) FWD TGGAGCGCCTGACCCTGGACATGGCGACTGTCGAACC
EIF4E (ENSG00000151247) REV CGGGCCCTCTAGACTCGAGCTTAAACAACAAACCTATTTTTAGTGGT
pET28a-APEX2-eIF4A1: (recombinant protein expression)
APEX-eIF4A1 FWD tggacagcaaatgggtcgcgATGGGAAAGTCTTACCCAAC
APEX-eIF4A1 REV agtggtggtggtggtggtgcTCAGATGAGGTCAGCAACAT
pET28a-eIF4A1: (recombinant protein expression)
eIF4A FWD tggacagcaaatgggtcgcgATGTCTGCGAGCCAGGATTCCCGATCC
eIF4A REV AGTGGTGGTGGTGGTGGTGCTCAGATGAGGTCAGCAACAT
psiCHECK2: (in vitro transcription RNA reporter)
psiCHECK2 FWD taatacgactcactataggCGGAAACTGGAGCCTGAGGAGT
psiCHECK2 REV CGTCCTCCTGGCTGAAGTGGA
in vivo APEX labeling
Cells were plated in 15 cm dish and cultured for 3 days with 1 μg ml−1 of tetracycline. Cells were treated like in(Lam et al., 2015). Briefly, Biotin-tyramide containing (500 μM final) prewarmed DMEM media was added to cells for 30 minutes prior to the start of the experiment. One mM final H2O2 was added to each dish for a total labeling time of 1 minute (unless stated otherwise). Cells were gently agitated for 1 minute, and quenched with 2X quenching buffer (10 mM Trolox and 20 mM sodium ascorbate in DPBS).
Protein Purification
BL21 Star (DE3) Escherichia coli cells (Invitrogen) transformed with plasmids encoding eIF4A1 (WT) or APEX2-eIF4A1 in a 1.5 L culture were cultivated at 37 °C with 50 μg ml−1 kanamycin and then grown at 16 °C overnight with 1 mM IPTG. The cell pellets were resuspended in His buffer (20 mM HEPES-NaOH, pH 7.5, 500 mM NaCl, 10 mM imidazole, 10 mM β-mercaptoethanol) with 0.5% NP-40, sonicated, and centrifuged at 35,000g for 20 min. The supernatant was incubated with 1.5 ml bed volume of Ni-NTA Superflow (Qiagen) for 1 h. The beads were loaded on a gravity column and washed with His buffer containing 1 M NaCl. The proteins were eluted with 50 mM Na-phosphate buffer, pH 7.5, 500 mM NaCl, 100 mM Na2SO4, 250 mM imidazole. Samples were run through an FPLC HiTrap Heparin HP affinity column (GE Healthcare) with no reducing agent for further purification. Fractions 8–11 were collected. Samples were mixed with 0.25 volumes of 80% glycerol, flash-forzen in liquid nitrogen, and stored at −80°C. All purification steps were performed at 4°C.
in vitro APEX labeling
Recombinant APEX2-eIF4A1 (1.5 μM) was pre-incubated with hemin (4.5 μM) at room temperature for 1 hour. Excess hemin was removed by several rounds of gel filtration through a MicroSpin G-25 column (GE Healthcare). This solution was then combined with biotin-tyramide, and a five molar excess of a NanoLuc reporter RNA, in addition to 1 mM ADP and 1 mM MgCl2. The samples were then combined with APEX labeling buffer (10 mM Tris, pH 7.5, 150 mM NaCl, and 10% glycerol). The reaction started when peroxide was added to the mix and proceeded for a total of 1 minute in vitro labeling. The reactions were then stopped using either TRIzol or oligo binding buffer (Zymo). RNA was extracted using manufacturer’s protocol, and loaded onto a dot-blot apparatus.
in vitro transcription of a reporter RNA
A reporter RNA for in vitro APEX labeling experiments was synthesized using the psiCHECK-2 plasmid with an in vitro transcription kit (Cellscript). The RNA was later purified using an oligo clean and concentrator kit (Zymo).
Heat shock, Hippuristanol, and PP242 treatment
Cells were plated onto 10 or 15 cm dishes, and expression was induced for 3 days with 1 μg ml−1 of tetracycline. Media was then replaced with fresh media containing biotin-tyramide (500 μM) for 30 minutes. Cells were then placed in a 44°C water bath for better heat transfer during heat shock experiments. APEX labeling was performed immediately after each treatment. For the hippuristanol treatment, cells were treated with biotin-tyramide containing media and 1 μM of hippuristanol for 30 min prior to the start of the APEX reaction. Labeling occurred for 30 seconds. Labeling reactions were quenched with 2X quenching buffer (see above) and cells were immediately lysed in TRIzol. For the PP242 treatment, cells were incubated with biotin-tyramide and 2.5 μM PP242-containing media for 30 minutes prior to the start of the APEX reaction. Labeling occurred for 1 minute. Reactions were quenched and samples were prepared for both APEX-MS and APEX-Seq.
Streptavidin purification of biotinylated protein
After the APEX labeling reaction, cells were quenched with 2X quenching solution (see above) once, followed by a 1X quenching solution wash. One 1X quenching solution wash was used to resuspend cells, which were then gently pelleted and lysed in 800 μl of lysis buffer containing 1X quenching reagents (1% Triton, 0.1% SDS, 20 mM Tris-HCl pH 7.4, 150 mM NaCl, 5 mM MgCl2, 5 mM trolox, 10 mM sodium ascorbate, and one tablet (per 10 ml) of cOmplete Mini Protease Inhibitor Cocktail). Lysates were clarified by centrifugation for 10 min at 20,000 × g, 4°C. Streptavidin beads (Pierce) were equilibrated with lysis buffer for a total of two washes. Lysate was mixed with streptavidin beads at a volumetric ratio of 8 volumes beads per 5 volumes lysate and incubated at RT for 1 hr. Beads were washed twice with lysis buffer, once with 1M KCl solution, once with 2M urea, pH 8, and twice with lysis buffer (w/o detergent or quenching reagents). Biotinylated proteins were eluted using by boiling samples in 8M urea, pH 8 for 3 minutes at 98°C.
Purification and sequencing biotinylated RNA
After an in vivo labeling reaction, cells were lysed with TRIzol and RNA was purified by by precipitating RNA from the aqueous phase. Samples were treated with DNase I (NEB) and ~100 μg of RNA was then gently fragmented using 10−5 units of RNase A/T1 (Thermo Fisher Scientific) by placing 1 μl of the RNase cocktail in the lid of each tube and initiating the reaction by simultaneously centrifuging the samples. These were then incubated for 10 minutes at 37°C in a final RNA concentration of 1μg μl−1. The reaction was immediately quenched using 400 μl of TRIzol. RNA was extracted by either adding 500 μl of TRIzol, followed by 200 μl of Chloroform, and by precipitating RNA from the aqueous phase, or by Direct-Zol (Zymo) purifications following the manufacturer’s instructions. C1 Streptavidin beads (10 μl per sample; Thermo Fisher Scientific) were washed three times with Buffer 1 (1 mM MgCl2, 0.5% sodium deoxycholate in PBS), washed once and blocked for 30 minutes with Blocking Buffer (5X Denhardt’s reagent and 150 μg/ml−1 Poly IC (InvivoGen) in Buffer 1). Afterward, blocking Buffer was removed and replaced with extracted RNA samples in fresh Blocking Buffer. Samples were incubated at room temperature for 1 hour and then washed twice with Buffer 2 (6M Urea, pH 8, 0.1% SDS in PBS), once with Buffer 3 (2% SDS in PBS), once with Buffer 4 (750 mM NaCl, 0.5% sodium deoxycholate, 0.1% SDS, in PBS), and once with Buffer 5 (150 mM NaCl, 0.5% sodium deoxycholate, 0.1% SDS, in PBS). RNAs were eluted from Streptavidin beads by denaturation in 300 μl TRIzol (Qiagen) and extracted using either the above mentioned TRIzol/Chloroform procedure or Direct-zol kit, following the manufacturer’s instructions. RNAs were eluted in 6 μl H2O. RNAs were then fragmented for 7 minutes (as recommended for RIN values > 2 and < 7) at 94°C, following the NEBNext Ultra II Directional RNA Library Prep Kit (NEB, catalog # E7760S) instructions.
TMT proteomic mass spectrometry
100 μg of eluted proteins were brought up to 100 μl with 100 mM TEAB. 5 μl of 200 mM TCEP were added and samples were incubated at 55°C for 1 hour. Fresh iodoacetamide was made up in 100 mM TEAB (final concentration 375 mM). 5 μl of the 375 mM iodoacetamide were added to the sample and incubated for 30 minutes protected from light at room temperature. Six volumes (or more) (~600μL) of pre-chilled (−20°C) acetone were added. Sampl es were allowed to precipitate overnight at −20°C. Samples were pre cipitated at 8,000 × g for 10 min at 4 °C and resuspended with 100 μl of 50 mM TEAB. For the tryptic digest, 2.5 μl of trypsin (1 μg/μl) were added to 100 μg of protein and incubated overnight at 37 °C. Pept ides were quantified and normalized using a quantitative colorimetric peptide assay (Thermo Fisher Scientific). 41 μl of anhydrous acetonitrile were added to each TMT labeling reagent vial and the reagent was allowed to resuspend at RT for 5 min with occasional vortexing. The reduced and alkylated protein digest were transferred to each TMT Reagent vial. Reactions were incubated for 1 hr at RT. 8 μl of 5% hydroxylamine was added to each sample and incubated for 15 minutes to quench the reaction. Samples were dried in a Speed-Vac or frozen in −80°C for storage and transportation. Samples were run on an OrbiTrap mass spectrometer (ThermoFisher Scientific) using high pH fractionation.
Translation initiation factors highlighted in Figure 4A are: EIF1AX (P47813), EIF2D (P41214), EIF2S1 (P05198), EIF2S2 (P20042), EIF3A (Q14152), EIF3CL (B5ME19), EIF3D (O15371), EIF3E (P60228), EIF3F (O00303), EIF3G (O75821), EIF3H (O15372), EIF3I (Q13347), EIF3J (O75822), EIF3K (Q9UBQ5), EIF3L (Q9Y262), EIF3M (Q7L2H7), EIF4A1 (P60842), EIF4B (P23588), EIF4E (D6RBW1), EIF4G1 (Q04637–3), EIF4H (Q15056–2), EIF5 (P55010), EIF5B (O60841), PABPC1 (P11940), PABPC4 (Q13310–3)
Western Blots
Samples were blocked with 0.6% milk in TBST (0.05% tween-20) for 1 hour at RT. Membranes were incubated with the corresponding primary antibodies in signal enhancer solution 1 (Hikari NU00101) for 1 hour at RT, and secondary antibodies in signal enhancer solution 2 (Hikari NU00102) for 1 hour at RT. Three 5 min washes were performed between antibody incubations. STREP-HRP (1:1,000, CST 3999) was used to blot for biotinylated protein. Anti-FLAG (1:1,000, CST 2368), and anti-eIF4A (1:1,000, CST 2490) antibodies were used as primary antibodies and HRP-conjugated anti-rabbit IgG (CST 7074) was used as a secondary antibody. Chemiluminescence was induced by SuperSignal West Dura Extended Duration Substrate (Thermo Scientific) and images were acquired by a FluorChem R imaging system (ProteinSimple).
Immunofluorescence
Cells were plated onto poly-lysine coated coverslips in 12 well plates and APEX fusion expression was induced by adding 1 μg ml−1 of tetracycline. Two days later, cells were fixed in 3.7% paraformaldehyde (PFA) in PBS for 10 minutes at room temperature, and permeabilized with 1% Triton X-100 in PBS for 10 min at room temperature. Cells were then blocked with 3% BSA in PBS for 30 min at room temperature. All primary antibodies were incubated overnight at 4 °C and secondary antibodies at 37 °C for 1 hour. Several PBS washes were performed in-between antibody staining. Coverslips were mounted onto slides with ProLong Gold mountant (Thermo Fisher Scientific).
Single molecule FISH
Cells were plated onto poly-lysine coated coverslips in 12 well plates and APEX fusion expression was induced by adding 1 μg ml−1 of tetracycline. Two days later, cells were fixed in 4% paraformaldehyde (PFA) in 1X PBS for 10 minutes at room temperature, and permeabilized with 0.1% Triton X-100 in 1X PBS for 5 min at room temperature. Cells were washed with 1X PBS and were then incubated at room temperature for 1 hour with 1 mL of diluted primary antibody. Cells were washed with three 10 minute PBS washes. A second 1 hour incubation with 1 mL of diluted secondary antibody in PBS was performed at room temperature. Three 10 minute PBS washes were performed. A 10 minute incubation with 4% paraformaldehyde in PBS was performed. Fixed cells were then incubated at room temperature for 2–5 minutes with Wash Buffer A (2 mL Stellaris RNA FISH Wash Buffer A, 7 mL Nuclease-free water, and 1 mL deionized formamide). During the 2–5 minute incubation, a humidified chamber was assembled using a 150 mm tissue culture plate with a bottom lined water-saturated paper towel and a single layer of parafilm placed on top of the paper towel. 100 μL of Hybridization Buffer (900 μL RNA FISH hybridization buffer with 100 μL of deionized formamide mixed well) containing each probe was dispensed onto the parafilm inside the humidified chamber. Coverslips were gently transferred, cell side down, onto the 100 μL drop of Hybridization Buffer containing probe. Humidified chambers were sealed with parafilm and incubated at 37 C for at least 4 hours. After the incubation, the coverslips were transferred onto a 12-well plate containing 1 mL of Wash Buffer A and incubated at 37 C for 30 minutes. A small drop (~ 15 μL) of Vectashield Mounting Medium was added onto microscope slides and coverslips were added onto the slide, cell side down. Excess liquid was wicked away with a kim wipe, and clear nail polish was applied to the edges of the coverslip.
smFISH probes
Stellaris FISH probes with Quasar 570 dye were used for all smFISH experiments. ShipReady Stellaris probes were used for GAPDH (catalog #: SMF-2026–1).
Dot Blot Assay
All dot blot assays were performed using the Dot-Blot Microfiltration Apparatus (Bio-Rad). ZetaProbe membranes (Bio-Rad) were submerged in H2O for 5 min. RNA samples were loaded onto the apparatus and the solution was gently pulled through the membrane by vacuum suction (setting 3). Zeta-probe membranes were then cross-linked two times at 200 μJ/cm2 (CL-1000 Ultraviolet Crosslinker) and blocked for 2 hr using Odyssey blocking buffer + 1% SDS. 800CW Streptavidin (1:10,000 LI-COR Biosciences) was then added for 30 minutes in fresh blocking buffer with 1% SDS. Membranes were visualized in the LI-COR (Odyssey CLx). A ssDNA oligo with a 3’-biotin modification was used as a positive control (IDT).
Quantification and Statistical Analysis
Statistical details for each experiment, including n, and statistical tests used can be found in the figure legends. Mean and SEM were used for barplots. A FDR-corrected P value of ≤ 0.05 was used to assess significance for most comparisons. Figure 7E outliers were removed for clarity.
Deep sequencing data analysis
Deep sequencing reads were adapter and quality trimmed using Cutadapt (Martin, 2011) and then aligned using HISAT2 (Kim et al., 2015) against the GRCh38 human genome reference. Aligned reads were quantified using featureCounts (Liao et al., 2014). Read counts were further analyzed using DESeq2 (Love et al., 2014).
Proteomics data analysis
Mass spectra were processed using Proteome Discoverer. DESeq2 (Love et al., 2014) was used to perform quantitative ratiometric comparisons between each APEX fusion and APEX2-GFP.
Classifier predicting RNA granule residency
A regularized logistic regression classifier was built using biophysical features from each protein and known protein domains from PFAM. Continuous features were scaled and centered, and 70% of the data was partitioned into a training set. Repeated k-folds cross validation (k = 10) was performed for alpha and lambda parameters that minimized mean squared error.
Data and Code Availability
The raw sequencing data generated for this study are available at NCBI GEO GSE121575. Scripts to run the analyses mentioned above are available upon request.
Supplementary Material
Highlights.
The APEX proximity labeling enzyme biotinylates nearby RNAs in vivo
APEX-Seq maps subcellular RNA localization and protein association in mammalian cells
eIF4A1 is enriched on the 3’ side of the 43S preinitiation complex
The RNA content of stress granules changes dynamically and varies between stresses
Acknowledgements
We thank members of the Ingolia and Lareau labs as well as A. Dernberg, and L.J. Kitch for discussion. Hippuristanol is a kind gift from J. Tanaka. This work was supported by an NIH New Innovator’s Award DP2 CA195768-01 (N.T.I.), an NSF Graduate Research Fellowship (A.P.), and a Human Frontiers in Science Program long-term fellowship (S.I.). This work used the Vincent J. Coates Genomics Sequencing Laboratory at UC Berkeley, supported by NIH Instrumentation Grants S10 RR029668, S10 RR027303, and S10 OD018174. Proteomics data was acquired at the UC Davis Genome Center Proteomics Core by M. Salemi and B. Phinney.
Footnotes
Declaration of Interests
The authors declare no competing interests.
Publisher's Disclaimer: This is a PDF file of an unedited manuscript that has been accepted for publication. As a service to our customers we are providing this early version of the manuscript. The manuscript will undergo copyediting, typesetting, and review of the resulting proof before it is published in its final citable form. Please note that during the production process errors may be discovered which could affect the content, and all legal disclaimers that apply to the journal pertain.
REFERENCES
- Amaldi F, and Pierandrei-Amaldi P (1997). TOP genes: a translationally controlled class of genes including those coding for ribosomal proteins. Prog. Mol. Subcell. Biol 18, 1–17. [DOI] [PubMed] [Google Scholar]
- Brangwynne CP, Eckmann CR, Courson DS, Rybarska A, Hoege C, Gharakhani J, Jülicher F, and Hyman AA (2009). Germline P granules are liquid droplets that localize by controlled dissolution/condensation. Science 324, 1729–1732. [DOI] [PubMed] [Google Scholar]
- Branon TC, Bosch JA, Sanchez AD, Udeshi ND, Svinkina T, Carr SA, Feldman JL, Perrimon N, and Ting AY (2017). Directed evolution of TurboID for efficient proximity labeling in living cells and organisms. [DOI] [PMC free article] [PubMed]
- Buchan JR, and Parker R (2009). Eukaryotic stress granules: the ins and outs of translation. Mol. Cell 36, 932–941. [DOI] [PMC free article] [PubMed] [Google Scholar]
- Chen Y, Zhang Y, Wang Y, Zhang L, Brinkman EK, Adam SA, Goldman R, van Steensel B, Ma J, and Belmont AS (2018). Mapping 3D genome organization relative to nuclear compartments using TSA-Seq as a cytological ruler. J. Cell Biol [DOI] [PMC free article] [PubMed] [Google Scholar]
- Choi-Rhee E, Schulman H, and Cronan JE (2004). Promiscuous protein biotinylation by Escherichia coli biotin protein ligase. Protein Sci. 13, 3043–3050. [DOI] [PMC free article] [PubMed] [Google Scholar]
- De Benedetti A, and Graff JR (2004). eIF-4E expression and its role in malignancies and metastases. Oncogene 23, 3189–3199. [DOI] [PubMed] [Google Scholar]
- Elden AC, Kim H-J, Hart MP, Chen-Plotkin AS, Johnson BS, Fang X, Armakola M, Geser F, Greene R, Lu MM, et al. (2010). Ataxin-2 intermediate-length polyglutamine expansions are associated with increased risk for ALS. Nature 466, 1069–1075. [DOI] [PMC free article] [PubMed] [Google Scholar]
- Faisst AM, Alvarez-Bolado G, Treichel D, and Gruss P (2002). Rotatin is a novel gene required for axial rotation and left-right specification in mouse embryos. Mech. Dev 113, 15–28. [DOI] [PubMed] [Google Scholar]
- Feldman ME, Apsel B, Uotila A, Loewith R, Knight ZA, Ruggero D, and Shokat KM (2009). Active-site inhibitors of mTOR target rapamycin-resistant outputs of mTORC1 and mTORC2. PLoS Biol. 7, e38. [DOI] [PMC free article] [PubMed] [Google Scholar]
- Femino AM, Fay FS, Fogarty K, and Singer RH (1998). Visualization of single RNA transcripts in situ. Science 280, 585–590. [DOI] [PubMed] [Google Scholar]
- Fischer DS, Theis FJ, and Yosef N (2018). Impulse model-based differential expression analysis of time course sequencing data. Nucleic Acids Res. [DOI] [PMC free article] [PubMed] [Google Scholar]
- Fonseca BD, Zakaria C, Jia J-J, Graber TE, Svitkin Y, Tahmasebi S, Healy D, Hoang H-D, Jensen JM, Diao IT, et al. (2015). La-related Protein 1 (LARP1) Represses Terminal Oligopyrimidine (TOP) mRNA Translation Downstream of mTOR Complex 1 (mTORC1). J. Biol. Chem 290, 15996–16020. [DOI] [PMC free article] [PubMed] [Google Scholar]
- des Georges A, Dhote V, Kuhn L, Hellen CUT, Pestova TV, Frank J, and Hashem Y (2015). Structure of mammalian eIF3 in the context of the 43S preinitiation complex. Nature 525, 491–495. [DOI] [PMC free article] [PubMed] [Google Scholar]
- Graff JR, Konicek BW, Vincent TM, Lynch RL, Monteith D, Weir SN, Schwier P, Capen A, Goode RL, Dowless MS, et al. (2007). Therapeutic suppression of translation initiation factor eIF4E expression reduces tumor growth without toxicity. J. Clin. Invest 117, 2638–2648. [DOI] [PMC free article] [PubMed] [Google Scholar]
- Hashem Y, des Georges A, Dhote V, Langlois R, Liao HY, Grassucci RA, Hellen CUT, Pestova TV, and Frank J (2013). Structure of the mammalian ribosomal 43S preinitiation complex bound to the scanning factor DHX29. Cell 153, 1108–1119. [DOI] [PMC free article] [PubMed] [Google Scholar]
- Hayat MA (2007). Microscopy, Immunohistochemistry, and Antigen Retrieval Methods: For Light and Electron Microscopy (Springer Science & Business Media; ). [Google Scholar]
- Hershey JWB, Mathews M, Sonenberg N, and Cold Spring Harbor Laboratory (1996). Translational Control.
- Hinnebusch AG (2014). The Scanning Mechanism of Eukaryotic Translation Initiation. Annu. Rev. Biochem 83, 779–812. [DOI] [PubMed] [Google Scholar]
- Hong S, Freeberg MA, Han T, Kamath A, Yao Y, Fukuda T, Suzuki T, Kim JK, and Inoki K (2017). LARP1 functions as a molecular switch for mTORC1-mediated translation of an essential class of mRNAs. Elife 6. [DOI] [PMC free article] [PubMed] [Google Scholar]
- Hsieh AC, Liu Y, Edlind MP, Ingolia NT, Janes MR, Sher A, Shi EY, Stumpf CR, Christensen C, Bonham MJ, et al. (2012). The translational landscape of mTOR signalling steers cancer initiation and metastasis. Nature 485, 55–61. [DOI] [PMC free article] [PubMed] [Google Scholar]
- Hung V, Udeshi ND, Lam SS, Loh KH, Cox KJ, Pedram K, Carr SA, and Ting AY (2016). Spatially resolved proteomic mapping in living cells with the engineered peroxidase APEX2. Nat. Protoc 11, 456–475. [DOI] [PMC free article] [PubMed] [Google Scholar]
- Hyman AA, and Simons K (2012). Cell biology. Beyond oil and water--phase transitions in cells. Science 337, 1047–1049. [DOI] [PubMed] [Google Scholar]
- Iwasaki S, Floor SN, and Ingolia NT (2016). Rocaglates convert DEAD-box protein eIF4A into a sequence-selective translational repressor. Nature 534, 558–561. [DOI] [PMC free article] [PubMed] [Google Scholar]
- Jain S, Wheeler JR, Walters RW, Agrawal A, Barsic A, and Parker R (2016). ATPase-Modulated Stress Granules Contain a Diverse Proteome and Substructure. Cell 164, 487–498. [DOI] [PMC free article] [PubMed] [Google Scholar]
- Johannes G, Carter MS, Eisen MB, Brown PO, and Sarnow P (1999). Identification of eukaryotic mRNAs that are translated at reduced cap binding complex eIF4F concentrations using a cDNA microarray. Proc. Natl. Acad. Sci. U. S. A 96, 13118–13123. [DOI] [PMC free article] [PubMed] [Google Scholar]
- Kaewsapsak P, Shechner DM, Mallard W, Rinn JL, and Ting AY (2017). Live-cell mapping of organelle-associated RNAs via proximity biotinylation combined with protein-RNA crosslinking. Elife 6. [DOI] [PMC free article] [PubMed] [Google Scholar]
- Katoh H, Okamoto T, Fukuhara T, Kambara H, Morita E, Mori Y, Kamitani W, and Matsuura Y (2013). Japanese encephalitis virus core protein inhibits stress granule formation through an interaction with Caprin-1 and facilitates viral propagation. J. Virol 87, 489–502. [DOI] [PMC free article] [PubMed] [Google Scholar]
- Kedersha N, Panas MD, Achorn CA, Lyons S, Tisdale S, Hickman T, Thomas M, Lieberman J, McInerney GM, Ivanov P, et al. (2016). G3BP–Caprin1–USP10 complexes mediate stress granule condensation and associate with 40S subunits. J. Cell Biol 212, 845–860. [DOI] [PMC free article] [PubMed] [Google Scholar]
- Khong A, and Parker R (2018). mRNP architecture in translating and stress conditions reveals an ordered pathway of mRNP compaction. J. Cell Biol 217, 4124–4140. [DOI] [PMC free article] [PubMed] [Google Scholar]
- Khong A, Matheny T, Jain S, Mitchell SF, Wheeler JR, and Parker R (2017). The Stress Granule Transcriptome Reveals Principles of mRNA Accumulation in Stress Granules. Mol. Cell 68, 808–820.e5. [DOI] [PMC free article] [PubMed] [Google Scholar]
- Kim D, Langmead B, and Salzberg SL (2015). HISAT: a fast spliced aligner with low memory requirements. Nat. Methods 12, 357–360. [DOI] [PMC free article] [PubMed] [Google Scholar]
- Kim DI, Jensen SC, Noble KA, Kc B, Roux KH, Motamedchaboki K, and Roux KJ (2016). An improved smaller biotin ligase for BioID proximity labeling. Mol. Biol. Cell 27, 1188–1196. [DOI] [PMC free article] [PubMed] [Google Scholar]
- Kozak M (1991). An analysis of vertebrate mRNA sequences: intimations of translational control. J. Cell Biol 115, 887–903. [DOI] [PMC free article] [PubMed] [Google Scholar]
- Lad L, Mewies M, and Raven EL (2002). Substrate binding and catalytic mechanism in ascorbate peroxidase: evidence for two ascorbate binding sites. Biochemistry 41, 13774–13781. [DOI] [PubMed] [Google Scholar]
- Lahr RM, Fonseca BD, Ciotti GE, Al-Ashtal HA, Jia J-J, Niklaus MR, Blagden SP, Alain T, and Berman AJ (2017). La-related protein 1 (LARP1) binds the mRNA cap, blocking eIF4F assembly on TOP mRNAs. eLife 6. [DOI] [PMC free article] [PubMed] [Google Scholar]
- Lam SS, Martell JD, Kamer KJ, Deerinck TJ, Ellisman MH, Mootha VK, and Ting AY (2015). Directed evolution of APEX2 for electron microscopy and proximity labeling. Nat. Methods 12, 51–54. [DOI] [PMC free article] [PubMed] [Google Scholar]
- Lancaster AK, Nutter-Upham A, Lindquist S, and King OD (2014). PLAAC: a web and command-line application to identify proteins with prion-like amino acid composition. Bioinformatics 30, 2501–2502. [DOI] [PMC free article] [PubMed] [Google Scholar]
- Lee S-Y, Kang M-G, Park J-S, Lee G, Ting AY, and Rhee H-W (2016). APEX Fingerprinting Reveals the Subcellular Localization of Proteins of Interest. Cell Rep. 15, 1837–1847. [DOI] [PubMed] [Google Scholar]
- Li YR, King OD, Shorter J, and Gitler AD (2013). Stress granules as crucibles of ALS pathogenesis. J. Cell Biol 201, 361–372. [DOI] [PMC free article] [PubMed] [Google Scholar]
- Liao Y, Smyth GK, and Shi W (2014). featureCounts: an efficient general purpose program for assigning sequence reads to genomic features. Bioinformatics 30, 923–930. [DOI] [PubMed] [Google Scholar]
- Lin RY, Vera JC, Chaganti RS, and Golde DW (1998). Human monocarboxylate transporter 2 (MCT2) is a high affinity pyruvate transporter. J. Biol. Chem. 273, 28959–28965. [DOI] [PubMed] [Google Scholar]
- Llácer JL, Hussain T, Marler L, Aitken CE, Thakur A, Lorsch JR, Hinnebusch AG, and Ramakrishnan V (2015). Conformational Differences between Open and Closed States of the Eukaryotic Translation Initiation Complex. Mol. Cell 59, 399–412. [DOI] [PMC free article] [PubMed] [Google Scholar]
- Love MI, Huber W, and Anders S (2014). Moderated estimation of fold change and dispersion for RNA-seq data with DESeq2. Genome Biol. 15, 550. [DOI] [PMC free article] [PubMed] [Google Scholar]
- Markmiller S, Soltanieh S, Server KL, Mak R, Jin W, Fang MY, Luo E-C, Krach F, Yang D, Sen A, et al. (2018). Context-Dependent and Disease-Specific Diversity in Protein Interactions within Stress Granules. Cell 172, 590–604.e13. [DOI] [PMC free article] [PubMed] [Google Scholar]
- Martin M (2011). Cutadapt removes adapter sequences from high-throughput sequencing reads. EMBnet.journal 17, 10. [Google Scholar]
- Mazroui R, Sukarieh R, Bordeleau M-E, Kaufman RJ, Northcote P, Tanaka J, Gallouzi I, and Pelletier J (2006). Inhibition of ribosome recruitment induces stress granule formation independently of eukaryotic initiation factor 2alpha phosphorylation. Mol. Biol. Cell 17, 4212–4219. [DOI] [PMC free article] [PubMed] [Google Scholar]
- McMahon AC, Rahman R, Jin H, Shen JL, Fieldsend A, Luo W, and Rosbash M (2016). TRIBE: Hijacking an RNA-Editing Enzyme to Identify Cell-Specific Targets of RNA-Binding Proteins. Cell 165, 742–753. [DOI] [PMC free article] [PubMed] [Google Scholar]
- Molliex A, Temirov J, Lee J, Coughlin M, Kanagaraj AP, Kim HJ, Mittag T, and Taylor JP (2015). Phase separation by low complexity domains promotes stress granule assembly and drives pathological fibrillization. Cell 163, 123–133. [DOI] [PMC free article] [PubMed] [Google Scholar]
- Morisaki T, Lyon K, DeLuca KF, DeLuca JG, English BP, Zhang Z, Lavis LD, Grimm JB, Viswanathan S, Looger LL, et al. (2016). Real-time quantification of single RNA translation dynamics in living cells. Science 352, 1425–1429. [DOI] [PubMed] [Google Scholar]
- Myers SA, Wright J, Peckner R, Kalish BT, Zhang F, and Carr SA (2018). Discovery of proteins associated with a predefined genomic locus via dCas9–APEX-mediated proximity labeling. Nat. Methods 15, 437–439. [DOI] [PMC free article] [PubMed] [Google Scholar]
- Niedzwiecka A, Marcotrigiano J, Stepinski J, Jankowska-Anyszka M, WyslouchCieszynska A, Dadlez M, Gingras A-C, Mak P, Darzynkiewicz E, Sonenberg N, et al. (2002). Biophysical Studies of eIF4E Cap-binding Protein: Recognition of mRNA 5′ Cap Structure and Synthetic Fragments of eIF4G and 4E-BP1 Proteins. J. Mol. Biol. 319, 615–635. [DOI] [PubMed] [Google Scholar]
- Oh S, Flynn RA, Floor SN, Purzner J, Martin L, Do BT, Schubert S, Vaka D, Morrissy S, Li Y, et al. (2016). Medulloblastoma-associated DDX3 variant selectively alters the translational response to stress. Oncotarget 7, 28169–28182. [DOI] [PMC free article] [PubMed] [Google Scholar]
- Panas MD, Ivanov P, and Anderson P (2016). Mechanistic insights into mammalian stress granule dynamics. J. Cell Biol. 215, 313–323. [DOI] [PMC free article] [PubMed] [Google Scholar]
- Pelletier J, Graff J, Ruggero D, and Sonenberg N (2015). Targeting the eIF4F translation initiation complex: a critical nexus for cancer development. Cancer Res. 75, 250–263. [DOI] [PMC free article] [PubMed] [Google Scholar]
- Philippe L, Vasseur J-J, Debart F, and Thoreen CC (2018). La-related protein 1 (LARP1) repression of TOP mRNA translation is mediated through its cap-binding domain and controlled by an adjacent regulatory region. Nucleic Acids Res. 46, 1457–1469. [DOI] [PMC free article] [PubMed] [Google Scholar]
- Pisareva VP, Pisarev AV, Komar AA, Hellen CUT, and Pestova TV (2008). Translation initiation on mammalian mRNAs with structured 5’UTRs requires DExH-box protein DHX29. Cell 135, 1237–1250. [DOI] [PMC free article] [PubMed] [Google Scholar]
- Protter DSW, and Parker R (2016). Principles and Properties of Stress Granules. Trends Cell Biol. 26, 668–679. [DOI] [PMC free article] [PubMed] [Google Scholar]
- Raj A, Peskin CS, Tranchina D, Vargas DY, and Tyagi S (2006). Stochastic mRNA Synthesis in Mammalian Cells. PLoS Biology 4, e309. [DOI] [PMC free article] [PubMed] [Google Scholar]
- Ramaswami M, Paul Taylor J, and Parker R (2013). Altered Ribostasis: RNA-Protein Granules in Degenerative Disorders. Cell 154, 727–736. [DOI] [PMC free article] [PubMed] [Google Scholar]
- Rauniyar N, and Yates JR 3rd (2014). Isobaric labeling-based relative quantification in shotgun proteomics. J. Proteome Res 13, 5293–5309. [DOI] [PMC free article] [PubMed] [Google Scholar]
- Rees JS, Li X-W, Perrett S, Lilley KS, and Jackson AP (2015). Protein Neighbors and Proximity Proteomics. Mol. Cell. Proteomics 14, 2848–2856. [DOI] [PMC free article] [PubMed] [Google Scholar]
- Rhee H-W, Zou P, Udeshi ND, Martell JD, Mootha VK, Carr SA, and Ting AY (2013). Proteomic mapping of mitochondria in living cells via spatially restricted enzymatic tagging. Science 339, 1328–1331. [DOI] [PMC free article] [PubMed] [Google Scholar]
- Roux KJ, Kim DI, Raida M, and Burke B (2012). A promiscuous biotin ligase fusion protein identifies proximal and interacting proteins in mammalian cells. J. Cell Biol 196, 801–810. [DOI] [PMC free article] [PubMed] [Google Scholar]
- Saxton RA, and Sabatini DM (2017). mTOR Signaling in Growth, Metabolism, and Disease. Cell 168, 960–976. [DOI] [PMC free article] [PubMed] [Google Scholar]
- van Steensel B, and Henikoff S (2000). Identification of in vivo DNA targets of chromatin proteins using tethered dam methyltransferase. Nat. Biotechnol 18, 424–428. [DOI] [PubMed] [Google Scholar]
- Tcherkezian J, Cargnello M, Romeo Y, Huttlin EL, Lavoie G, Gygi SP, and Roux PP (2014). Proteomic analysis of cap-dependent translation identifies LARP1 as a key regulator of 5’TOP mRNA translation. Genes Dev. 28, 357–371. [DOI] [PMC free article] [PubMed] [Google Scholar]
- Thoreen CC, Kang SA, Chang JW, Liu Q, Zhang J, Gao Y, Reichling LJ, Sim T, Sabatini DM, and Gray NS (2009). An ATP-competitive mammalian target of rapamycin inhibitor reveals rapamycin-resistant functions of mTORC1. J. Biol. Chem 284, 8023–8032. [DOI] [PMC free article] [PubMed] [Google Scholar]
- Thoreen CC, Chantranupong L, Keys HR, Wang T, Gray NS, and Sabatini DM (2012). A unifying model for mTORC1-mediated regulation of mRNA translation. Nature 485, 109–113. [DOI] [PMC free article] [PubMed] [Google Scholar]
- Toombs JA, Petri M, Paul KR, Kan GY, Ben-Hur A, and Ross ED (2012). De novo design of synthetic prion domains. Proc. Natl. Acad. Sci. U. S. A 109, 6519–6524. [DOI] [PMC free article] [PubMed] [Google Scholar]
- Vainberg IE, Lewis SA, Rommelaere H, Ampe C, Vandekerckhove J, Klein HL, and Cowan NJ (1998). Prefoldin, a chaperone that delivers unfolded proteins to cytosolic chaperonin. Cell 93, 863–873. [DOI] [PubMed] [Google Scholar]
- Vogel MJ, Guelen L, de Wit E, Peric-Hupkes D, Lodén M, Talhout W, Feenstra M, Abbas B, Classen A-K, and van Steensel B (2006). Human heterochromatin proteins form large domains containing KRAB-ZNF genes. Genome Res. 16, 1493–1504. [DOI] [PMC free article] [PubMed] [Google Scholar]
- Wang C, Han B, Zhou R, and Zhuang X (2016). Real-Time Imaging of Translation on Single mRNA Transcripts in Live Cells. Cell 165, 990–1001. [DOI] [PMC free article] [PubMed] [Google Scholar]
- Wheeler JR, Matheny T, Jain S, Abrisch R, and Parker R (2016). Distinct stages in stress granule assembly and disassembly. Elife 5. [DOI] [PMC free article] [PubMed] [Google Scholar]
- Wheeler JR, Jain S, Khong A, and Parker R (2017). Isolation of yeast and mammalian stress granule cores. Methods 126, 12–17. [DOI] [PMC free article] [PubMed] [Google Scholar]
- Wu B, Eliscovich C, Yoon YJ, and Singer RH (2016). Translation dynamics of single mRNAs in live cells and neurons. Science 352, 1430–1435. [DOI] [PMC free article] [PubMed] [Google Scholar]
- Yamashita R, Suzuki Y, Takeuchi N, Wakaguri H, Ueda T, Sugano S, and Nakai K (2008). Comprehensive detection of human terminal oligo-pyrimidine (TOP) genes and analysis of their characteristics. Nucleic Acids Res. 36, 3707–3715. [DOI] [PMC free article] [PubMed] [Google Scholar]
- Yan X, Hoek TA, Vale RD, and Tanenbaum ME (2016). Dynamics of Translation of Single mRNA Molecules In Vivo. Cell 165, 976–989. [DOI] [PMC free article] [PubMed] [Google Scholar]
- Youn J-Y, Dunham WH, Hong SJ, Knight JDR, Bashkurov M, Chen GI, Bagci H, Rathod B, MacLeod G, Eng SWM, et al. (2018). High-Density Proximity Mapping Reveals the Subcellular Organization of mRNA-Associated Granules and Bodies. Mol. Cell 69, 517–532.e11. [DOI] [PubMed] [Google Scholar]
Associated Data
This section collects any data citations, data availability statements, or supplementary materials included in this article.
Supplementary Materials
Data Availability Statement
The raw sequencing data generated for this study are available at NCBI GEO GSE121575. Scripts to run the analyses mentioned above are available upon request.