Abstract
Every year, 4-6 million pregnant women undergo noninvasive prenatal testing (NIPT), which is used worldwide for fetal aneuploidy screening. Adequate fetal cell-free DNA (cfDNA) is the critically important factor to ensure high sensitivity and specificity. In this study, we sought to increase the fetal fraction by adjusting experimental factors in the size selection for NIPT. CfDNA was extracted from 1495 pregnant women at 12-26 weeks of gestation for sequencing of shorter cfDNA NIPT (< 140 bp). Multivariable linear regression models were used to evaluate the association between experimental factors and fetal fraction. Nomograms for the likelihood of high fetal fraction (> 20%) were constructed according to significant factors in multivariable regression models. Our results suggested that cfDNA and library concentrations were negatively correlated with fetal fraction, and uniquely mapped reads were positively correlated with fetal fraction. Lower cfDNA and library concentrations, shorter cfDNA fragments, and higher uniquely mapped reads may be more conducive to obtaining higher fetal fractions. Furthermore, we constructed easy-to-use nomograms incorporating the maternal, fetal characteristics and experimental factors to precisely predict the probability of high fetal fraction with an area under the curve (AUC) of 0.773 (95% confidence interval: 0.749-0.797). Collectively, our maternal plasma cfDNA-based nomograms consider experimental factors that can be adjusted and may improve a laboratory’s ability to obtain higher fetal cfDNA concentrations.
Keywords: Noninvasive prenatal testing, fetal fraction, experimental factors
Introduction
Noninvasive prenatal testing (NIPT) is based on sampling maternal blood, which contains fetal cfDNA fragments from the placenta; it was initially validated as a clinical prenatal screen for pregnancies at high risk for trisomies 21, 18, and 13 [1]. Given the high detection rates of these trisomies, it is widely used for fetal aneuploidy screening, with 4-6 million pregnant women undergoing NIPT annually [2,3]. Obtaining adequate fetal cell-free DNA (cfDNA) is necessary to ensure high sensitivity and specificity. Low fetal fraction (< 4%) of cfDNA usually results in screen failures and false-negative results [4,5].
Low fetal fractions occur when a small portion of cfDNA in maternal plasma is derived from placental cells (trophoblasts). This can be influenced by high maternal body mass index (BMI), early gestational age (GA), anticoagulation therapy, high shipping temperature, extraction method, laboratory NIPT work-up, and fetal aneuploidy [6-12]. An inverse association was found between maternal BMI and fetal fraction, which could be attributed to a dilution effect [6]. Shipping conditions influence cfDNA detection sensitivity as high temperatures can induce the unintended release of maternal-derived cfDNA due to white blood cell lysis between the time of blood draw and processing of plasma [7]. A recent study indicated that women treated with low molecular weight heparin might have decreased fetal fractions due to treatment-induced apoptosis [10]. The, fetal fraction is lower in trisomies 13 and 18, and triploid pregnancies [8,9]. Repeating sample collection or using a different aneuploidy screening test may be a reasonable strategy to reduce the probability of screening failure due to low fetal fractions. However, among 94 cases retested with a second blood sampling, only 61% had either positive or negative results [6], which challenges the utility of repeating sample collection for NIPT due to low fetal fractions.
To overcome low fetal fraction, Lo et al. performed plasma DNA size analysis that can be used to detect multiple types of fetal chromosomal aneuploidies with high accuracy for trisomy 13 [5]. However, they did not specifically include plasma samples with low fetal DNA [5]. Recent studies have shown that the most significant difference between fetal and maternal DNA, is a reduction in the 166-bp peak relative to the 143-bp peak [13,14]. Based on this, our group developed a new NIPT method to preferentially sequence shorter cfDNA fragments (< 140 bp) to significantly improve the fetal fraction [15,16]. Interestingly, a study of circulating tumor DNA also found that selecting fragments between 90 and 150 bp improved detection, with more than twofold median enrichment in > 95% of cases and more than fourfold enrichment in > 10% of cases [17]. Collectively, these results suggest that short cf-DNA offers new opportunities for early stage prenatal screening and cancer diagnosis. However, few investigations have studied the effect of maternal and fetal characteristics and experimental factors on fetal fraction or adjusting the experimental variables to obtain higher fetal cfDNA concentrations for size selection of NIPT.
In this study, we assessed the impact of experimental quality control, including cfDNA concentration and library concentration, on fetal fraction in normal and size selection NIPT. On the basis of size selection NIPT results and the effects of different factors on fetal fraction, we also constructed a simple and clinically relevant nomogram to predict a higher fetal fraction (> 20%). Personalized knowledge of maternal plasma cf-DNA may improve a laboratory’s ability to obtain higher concentrations of fetal cf-DNA.
Materials and methods
The study population included women pregnant with male fetuses drawn between October 2015 and July 2018 and a stated GA of at least 12 on the test requisition form. Size selection NIPT for fetal aneuploidy was applied in 1495 plasma samples, and 1382 plasma samples from pregnant women were tested with normal NIPT. All samples had fetal karyotypes (pregnancies in which NIPT results were positive) or clinical follow-up results. The study was approved by the reproductive medicine ethics committee of Suzhou municipal hospital. Blood samples (10 ml) were collected onsite from participants who gave their consent following pre-test counseling provided by genetic counselors. cfDNA was extracted from 600 μl plasma, a library was constructed by polymerase chain reaction (PCR), and recycled shorter fragments from PCR were produced by E-Gel® Agarose Gel Electrophoresis System using an E-Gel® SizeSelect™ 2% Agarose (Invitrogen, Carlsbad, CA, USA). cfDNA and library concentrations were measured by the QubitTM dsDNA HS Kit (Invitrogen, Carlsbad, CA, USA). Then, the recycled cfDNA was sequenced by the Ion Proton system. Fetal DNA concentration was evaluated by calculating the proportion of chromosome Y reads.
Statistical analysis
Fetal fraction disribution was assessed as approximately normal based on a normal Q-Q plot. Linear regression models were used to examine the associations of fetal fraction with cfDNA concentration, library concentration, and uniquely mapped reads. We generated categorical variables for cfDNA concentration (< 0.121, 0.121-0.151, 0.152-0.181, 0.182-0.221, and > 0.221 ng/μl), library concentration (< 5.406, 5.406-7.241, 7.242-8.731, 8.731-10.701, and > 10.701 ng/μl) and uniquely mapped reads (< 1.88, 1.88-2.20, 2.21-2.56, and > 2.56 Mb). Relative to the reference category, we computed the estimates and 95% confidence intervals (CI) for mean differences in fetal fraction for each category of cfDNA concentration, library concentration, and uniquely mapped reads. We used five different models. Model 1 was a univariate linear regression of the relationship between cfDNA concentration, library concentration, or uniquely mapped reads and fetal fraction. Model 2 was adjusted for GA (continuous numerical variables) and BMI (continuous numerical variables). Model 3 added the mean cf-DNA size to model (continuous numerical variables) on the basis of model 2. Model 4 was additionally adjusted for factors reported in the previous article. When analyzing the effect of cfDNA concentration on fetal fraction, Model 4 added maternal age (continuous numerical variables), multiple gestations (categorical variables), library concentration (continuous numerical variables), and uniquely mapped reads (continuous numerical variables) to Model 2. When analyzing the effect of library concentration on fetal fraction, Model 4 added maternal age (continuous numerical variables), multiple gestations (categorical variables), cfDNA concentration (continuous numerical variables), and uniquely mapped reads (continuous numerical variables) to Model 2. When analyzing the effect of uniquely mapped reads on fetal fraction, Model 4 added maternal age (continuous numerical variables), multiple gestations (categorical variables) and cfDNA concentration (continuous numerical variables) and library concentration (continuous numerical variables) to Model 2. Model 5 added mean size of continuous numerical variables) to Model 4. We selected these confounders based on their associations with the outcomes of interest or a 10% change in effect estimate.
The nomograms for predicting higher fetal fraction (> 20%) probability were established with the above-mentioned significant variables. The discriminatory and predictive abilities of the nomograms were assessed by the Akaike information criterion (AIC) value and the receiver operating characteristic (ROC) curve, respectively [18]. For a given set of candidate models for data points, the preferred model had the lowest AIC value [19,20]. All p values were 2-sided, and P < 0.05 was considered statistically significant. Statistical analyses was performed with GraphPad Prism 8.0 (Graph Pad Inc., San Diego, CA, USA), MedCalc (Ostend, Belgium), SPSS version 24.0 (IBM Corp, Armonk, NY, USA) and R (http://www.R-project.org) software packages.
Results
Fetal fraction decreases with greater cfDNA concentration in size selection-based NIPT and traditional NIPT
cfDNA was extracted from 1495 plasma samples of pregnant women carrying male fetuses at 12-26 weeks of gestation undergoing size selection-based NIPT (< 145 bp). The median cfDNA concentration was 0.174 ng/μl (range 0.04 ng/μl to 0.71 ng/μl). Within this range, there was a modest trend toward a lower fetal fraction with increasing cfDNA concentration (R2 = 0.0527, P < 0.0001, Figure 1A). Shorter fragments were the key factors affecting fetal fraction in size selection NIPT [21]. As shown in Figure 1B, when adjusted for fragment size, fetal fraction decreased with greater cfDNA fragment size in pregnant women with the same cfDNA concentration. In the same cfDNA fragment size range, fetal fraction decreased with higher cfDNA concentration. We then classified cfDNA concentration into the following five categories: < 0.121, 0.121-0.151, 0.152-0.181, 0.182-0.221, and > 0.221 ng/μl. The numbers of pregnant women with cfDNA concentration in these five categories were 363, 282, 306, 257, and 287, respectively. The mean fetal fractions across cfDNA concentration categories were 34.2% (range 7.2% to 75.9%), 32.7% (range 6.4% to 79.3%), 30.4% (range 10.5% to 55.8%), 27.9% (range 10% to 48.5%), and 27.1% (range 5.8% to 93.6%) (Figure 1C; Table 1). The mean fetal fraction differences across cfDNA concentration categories were -1.51% (95% CI: -3.10% to 0.09%) for 0.121-0.151 ng/μl, -3.82% (95% CI: -5.38% to -2.26%) for 0.152-0.181 ng/μl, -6.25% (95% CI: -7.89% to -4.62%) for 0.182-0.221, and -7.08% (95% CI: -8.67% to -5.50%) for > 0.221 ng/μl compared with < 0.121 ng/μl (ptrend < 0.0001). We also collected 1382 plasma samples from pregnant women undergoing traditional NIPT to assess the cfDNA concentration and fetal fraction, and we classified cfDNA concentration in to the above-mentioned categories. The mean fetal fractions of maternal plasma cfDNA concentration < 0.121, 0.121-0.151, 0.152-0.181, 0.182-0.221 and > 0.221 ng/μl were 12.7% (range 2.1% to 30.4%), 11.1% (range 3.2% to 29.4%), 10.8% (range 2.2% to 25.4%), 10.0% (range 4.5% to 29.9%), and 8.7% (range 3.2% to 22.2%), respectively (Figure 1D; Table 1). There was also a modest trend toward lower fetal fraction with increasing cfDNA concentration in traditional NIPT.
Figure 1.
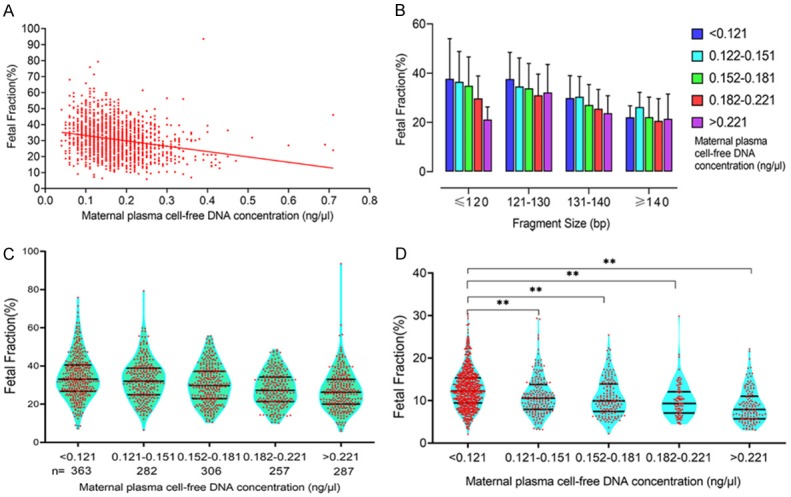
Relationship between fetal fraction and cfDNA concentration. A. cfDNA concentration was negatively correlated with fetal fraction in the sequencing of shorter cfDNA for NIPT. B. Among pregnant women in the same cfDNA concentration range, fetal fraction decreased with longer cfDNA fragment size and higher cfDNA concentration. C. The mean fetal fractions of maternal cfDNA concentrations < 0.121, 0.121-0.151, 0.152-0.181, 0.182-0.221, and > 0.221 ng/μl were 34.2%, 32.7%, 30.4%, 27.9%, and 27.1%, respectively. D. The mean fetal fractions of maternal plasma cfDNA concentrations < 0.121, 0.121-0.151, 0.152-0.181, 0.182-0.221, and > 0.221 ng/μl were 12.7%, 11.1%, 10.8%, 10.0%, and 8.7%, respectively. There was also a modest trend toward a lower fetal fraction with increasing cfDNA concentration in traditional NIPT (**P < 0.01).
Table 1.
Mean fetal fraction differences across cfDNA concentration categories in size selection and traditional NIPT
| cfDNA concentration (ng/μl) | Size selection NIPT | Traditional NIPT | ||
|---|---|---|---|---|
|
|
|
|||
| n | Fetal fraction | n | Fetal fraction | |
| < 0.121 | 363 | 34.2% (7.2%-75.9%) | 772 | 12.7% (2.1%-30.4%) |
| 0.121-0.151 | 282 | 32.7% (6.4%-79.3%) | 213 | 11.1% (3.2%-29.4%) |
| 0.152-0.181 | 306 | 30.4% (10.5%-55.8%) | 164 | 10.8% (2.2%-25.4%) |
| 0.182-0.221 | 257 | 27.9% (10%-48.5%) | 94 | 10.0% (4.5%-29.9%) |
| > 0.221 | 287 | 27.1% (5.8%-93.6%) | 139 | 8.7% (3.2%-22.2%) |
Fetal fraction also decreased with higher cfDNA concentration when adjusted for BMI, GA, maternal age, multiple gestations, library concentration, uniquely mapped reads, and mean cfDNA size (Figure 2, Model 5). The multivariable-adjusted (Figure 2, Model 4) mean fetal fraction differences across the maternal plasma cfDNA concentration categories were -1.53% (95% CI: -3.04% to -0.03%) for 0.121-0.151 ng/μl, -2.77% (95% CI: -4.25% to -1.28%) for 0.152-0.181 ng/μl, -4.63% (95% CI: -6.20% to -3.06%) for 0.182-0.221 ng/μl, and -6.19% (95% CI: -7.72% to -4.65%) for > 0.221 ng/μl compared with < 0.121 ng/μl (ptrend < 0.0001). However, mean fetal fraction differences after adjustment for confounding factors plus average cfDNA size (Figure 2, Model 5) were -1.05% (95% CI: -2.45% to 0.34%) for 0.121-0.151 ng/μl, -1.91% (95% CI: -3.29% to -0.52%) for 0.152-0.181 ng/μl, -3.85% (95% CI: -5.31% to -2.39%) for 0.182-0.221 ng/μl, and -4.75% (95% CI: -6.18% to -3.31%) for > 0.221 ng/μl compared with < 0.121 ng/μl (ptrend < 0.0001), suggest that sequencing shorter cfDNA significantly decreased mean fetal fraction differences between different cfDNA concentration groups, especially in the high cfDNA concentration group (> 0.221 ng/μl) by ~ 23%.
Figure 2.
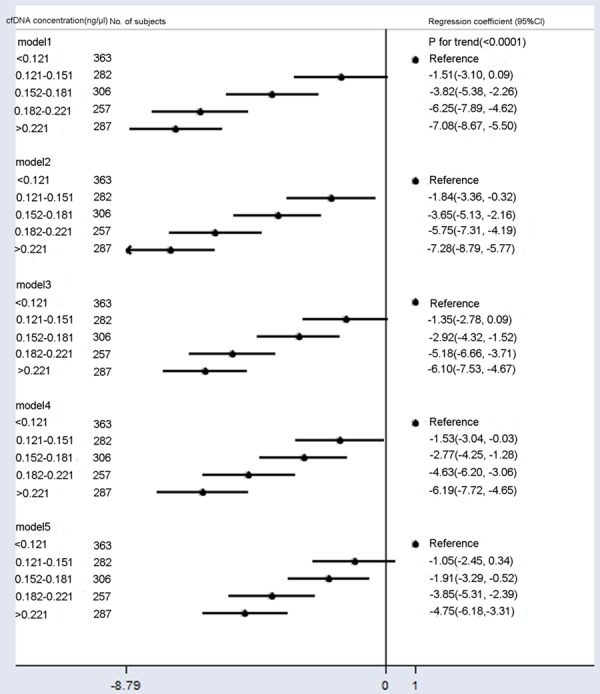
Mean differences in fetal fraction according to cfDNA concentration (ng/μl). Model 1: Crude model. Model 2 was adjusted for GA and BMI. Model 3 added the average cfDNA size to Model 2. Model 4 added maternal age, multiple gestations, library concentration, and uniquely mapped reads to Model 2. Model 5 added the average cfDNA size to Model 4. Compared to Models 2 and 4, Models 3 and 5 included additional adjustments for confounding factors of average cfDNA size, and they showed significantly reduced fetal fractions across cfDNA concentration categories.
Inverse relationship between library concentration and fetal fraction in the maternal circulation
Plasma cfDNA obtained from 1495 pregnant women was used to construct the library. Quantitative library data were used to analyze factors affecting fetal fraction. The median library concentration was 10.90 ng/μl (range 0.64 to 42 ng/μl). Within this range, there was a modest trend toward lower fetal fraction with increasing library concentration (R2 = 0.044, P < 0.0001, Figure 3A). As shown in Figure 3B, the results were similar after adjustment for fragment size compared to low library concentration, and women with a high library concentration tended to have a lower fetal fraction. We then classified library concentration into the following five categories: < 5.406, 5.406-7.241, 7.242-8.731, 8.731-10.701, and > 10.701 ng/μl. The numbers of pregnant women with library concentration belonging to these five categories were 299, 300, 301, 300, and 295, respectively. The mean fetal fractions across library concentration categories were 33.2% (range 5.8% to 79.3%), 32.7% (range 8.6% to 68.1%), 30.9% (range 6.4% to 93.6%), 28.9% (range 10.5% to 71.4%) and 27.6% (range 8.6% to 55.3%), respectively (Figure 1C; Table 2). The mean fetal fraction differences across the library concentration categories were -0.47% (95% CI: -2.13% to 1.19%) for 5.406-7.241 ng/μl, -2.24% (95% CI: -3.90% to -0.58%) for 7.242-8.731 ng/μl, -4.24% (95% CI: -5.90% to -2.58%) for 8.731-10.701 ng/μl, and -5.56% (95% CI: -7.23% to -3.89%) for > 10.701 ng/μl compared with < 5.406 ng/μl (ptrend < 0.0001). We also collected plasma samples from 1382 pregnant women undergoing traditional NIPT to assess the library concentration and fetal fraction and classified library concentrations into the above-mentioned categories. The mean fetal fractions in the categories of maternal plasma library concentration < 5.406, 5.406-7.241, 7.242-8.731, 8.731-10.701, and > 10.701 ng/μl were 13.2% (range 3.3% to 29.3%), 12.7% (range 3.3% to 30.4%), 11.8% (range 4.4% to 29.4%), 12.4% (range 3.2% to 28.0%), and 10.7% (range 2.1% to 29.9%), respectively (Figure 3D; Table 2). There was also a modest trend toward lower fetal fraction with increasing library concentration in traditional NIPT.
Figure 3.
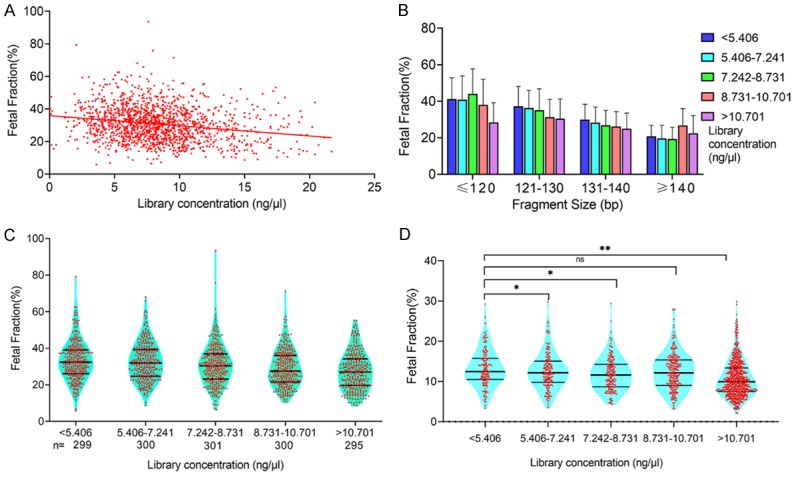
Relationship between fetal fraction and library concentration. A. Library concentration was negatively correlated with fetal fraction when sequencing shorter cfDNA for NIPT. B. In pregnant women with the same library concentration range, fetal fraction decreased with longer cfDNA fragment size. In the same cfDNA fragment size range, fetal fraction decreased with library concentration. C. The mean fetal fractions of maternal library concentrations < 5.406, 5.406-7.241, 7.242-8.731, 8.731-10.701, and > 10.701 ng/μl were 33.2%, 32.7%, 30.9%, 28.9%, and 27.6%, respectively. D. The mean fetal fractions of maternal plasma cfDNA concentrations < 5.406, 5.406-7.241, 7.242-8.731, 8.731-10.701, and > 10.701 ng/μl were 13.2%, 11.8%, 12.4%, and 10.7%, respectively. There was also a slight trend toward a lower fetal fraction with increasing library concentration in traditional NIPT (**P < 0.01, *P < 0.05).
Table 2.
Mean fetal fraction differences across library concentration categories in size selection and traditional NIPT
| Library concentration (ng/μl) | Size selection NIPT | Traditional NIPT | ||
|---|---|---|---|---|
|
|
|
|||
| n | Fetal fraction | n | Fetal fraction | |
| < 5.406 | 299 | 33.2% (5.8%-79.3%) | 145 | 13.2% (3.3%-29.3%) |
| 5.406-7.241 | 300 | 32.7% (8.6%-68.1%) | 160 | 12.7% (3.3%-30.4%) |
| 7.242-8.731 | 301 | 30.9% (6.4%-93.6%) | 166 | 11.8% (4.4%-29.4%) |
| 8.731-10.701 | 300 | 28.9% (10.5%-71.4%) | 237 | 12.4% (3.2%-28.0%) |
| > 10.701 | 295 | 27.6% (8.6%-55.3%) | 674 | 10.7% (2.1%-29.9%) |
Fetal fraction also decreased with an increase in the library concentration when adjusted for BMI, GA, maternal age, multiple gestations, cfDNA concentration, uniquely mapped reads, and mean cfDNA size (Figure 4, Model 5). The multivariable-adjusted (Figure 4, Model 4) mean fetal fraction differences across the categories of maternal plasma library concentration were -0.50% (95% CI: -2.04% to -1.04%) for 5.406-7.241 ng/μl, -2.25% (95% CI: -3.79% to -0.70%) for 7.242-8.731 ng/μl, -3.31% (95% CI: -4.86% to -1.75%) for 8.731-10.701 ng/μl, and -3.88% (95% CI: -5.63% to -2.14%) for > 10.701 ng/μl compared with < 5.406 ng/μl (ptrend < 0.0001). However, the corresponding mean fetal fraction differences for those library concentrations were -1.03% (95% CI: -2.46% to -0.41%), -2.48% (95% CI: -3.92% to -1.04%), -3.49% (95% CI: -4.94% to -2.05%), and -4.86% (95% CI: -6.48% to -3.23%) compared with < 5.406 ng/μl (ptrend < 0.0001), after adjustment for confounding factors plus average cfDNA size (Figure 2, Model 5). These findings indicate that sequencing shorter cfDNA increased mean fetal fraction differences between library concentration groups; however, sequencing shorter cfDNA yieldeda higher fetal fraction in the high library concentration group (> 0.221 ng/μl, mean fetal fraction: 27.6%). Compared with Model 1, additional adjustment for confounding factors (Model 5) slightly reduced fetal fraction differences among groups.
Figure 4.
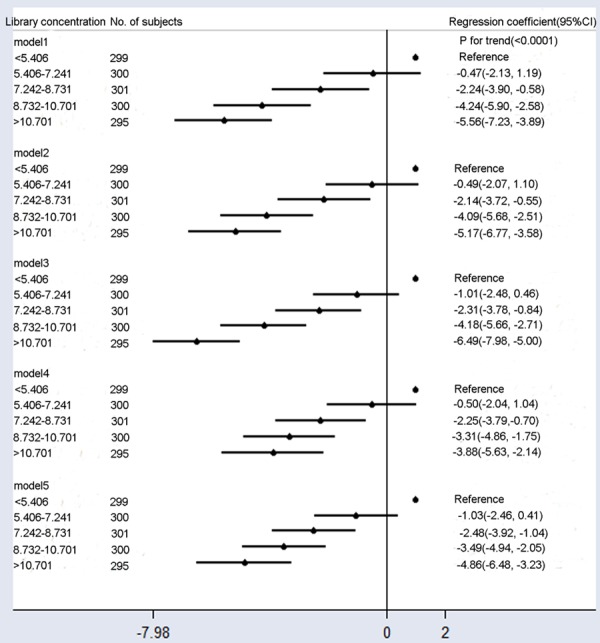
Mean differences in the fetal fraction according to library concentration (ng/μl). Model 1: Crude model. Model 2 was adjusted for GA and BMI. Model 3 added the average cfDNA size to Model 2. Model 4 added maternal age, multiple gestations, cfDNA concentration, and uniquely mapped reads to Model 2. Model 5 added the average cfDNA size to Model 4. Compared with Model 1, additional adjustment for confounding factors slightly reduced fetal fraction differences among different groups.
The impact of uniquely mapped reads per sample on fetal fraction
There was a slight trend toward a higher fetal fraction with increased uniquely mapped reads (R2 = 0.001), but this was not significant (P = 0.21) (Figure 5A). We then classified uniquely mapped reads intofour categories: < 1.88, 1.88-2.20, 2.21-2.56, and > 2.56 Mb. The numbers of pregnant women in the uniquely mapped reads categories were 374, 380, 372, and 369, respectively. The mean fetal fractions on uniquely mapped reads < 1.88, 1.88-2.20, 2.21-2.56, and > 2.56 Mb were 28.6% (range 5.8% to 62.6%), 30.4% (range 8.6% to 71.4%), 32.0% (range 7.2% to 79.3%) and 31.7% (range 8.6% to 93.6%), respectively (Figure 5B). The mean fetal fraction differences across the categories of uniquely mapped reads were 1.87% (95% CI: 0.38%-3.37%) for 1.88-2.20 Mb, 3.49% (95% CI: 1.99%-5.0%) for 2.21-2.56 Mb, and 3.19% (95% CI: 1.68-4.71%) for > 2.56 Mb compared with < 1.88 Mb (ptrend < 0.0001, Model 1, Figure 6). Mean fetal fraction positively correlated with fetal fraction within uniquely mapped reads < 2.56 Mb adjustment for the average cfDNA size (Figure 5C). After adjustment for all confounding factors (Model 5), there was a slight trend toward a higher fetal fraction with more uniquely mapped reads (Model 1, Figure 6).
Figure 5.
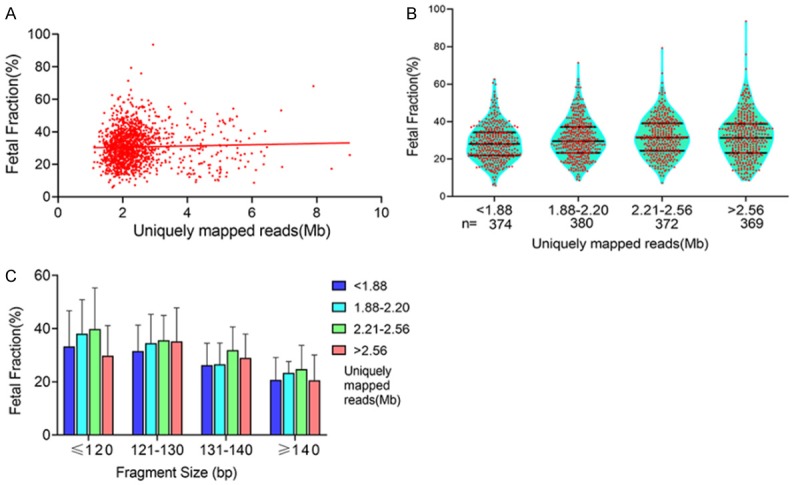
Relationship between fetal fraction and uniquely mapped reads. A. There was a slight trend toward higher fetal fraction with increasing uniquely mapped reads (R2 = 0.001, P = 0.21). B. The mean fetal fractions on uniquely mapped reads < 1.88, 1.88-2.20, 2.21-2.56, and > 2.56 Mb were 28.6%, 30.4%, 32.0%, and 31.7%, respectively. C. In pregnant women with the same uniquely mapped reads range, fetal fraction decreased with longer cfDNA fragment size. In the same cfDNA fragment size range, fetal fraction increased with uniquely mapped reads.
Figure 6.
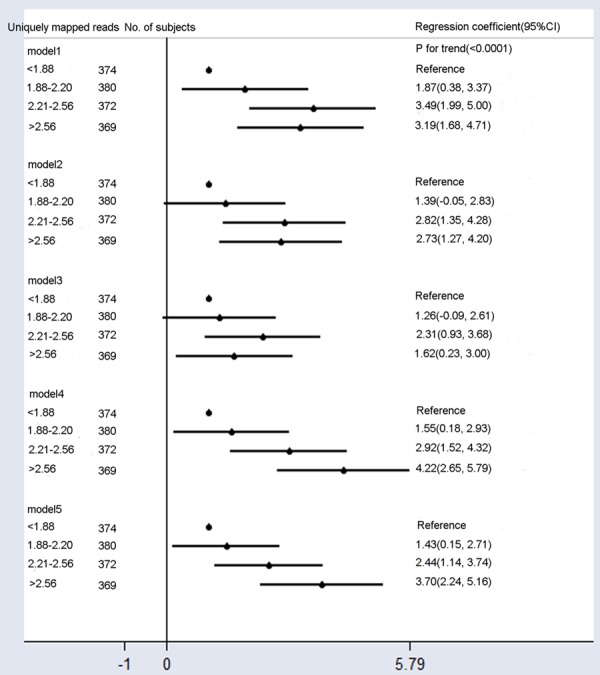
Mean differences in fetal fraction according to uniquely mapped reads. Model 1: Crude model. Model 2 was adjusted for GA and BMI. Model 3 added the average cfDNA to Model 2. Model 4 added maternal age, multiple gestations, cfDNA concentration, and library concentration to Model 2. Model 5 added the average cfDNA size to Model 4. Compared to Models 2 and 4, Models 3 and 5 included additional adjustments for confounding factors of the average cfDNA szie, and they showed significantly reduced fetal fraction differences across uniquely mapped reads categories.
Construction and validation of the clinically relevant nomogram
We randomly allocated 1495 size selection NIPT samples into training (n = 1200) and validation (n = 295) sets. In the training set, based on the above-mentioned significant independent factors, we developed four nomograms to predict the probability of higher fetal fraction (> 20%). We also adopted the AIC value and ROC curve to compare predictive abilities for higher fetal fraction (> 20%) among the nomograms. Compared to Models 1 (AIC: 926; AUC: 0.777), 3 (AIC: 949; AUC: 0.757), and 4 (AIC: 949; AUC: 0.753), we observed that Model 2 had the lowest AIC value (928, P = 0.051 compared to Model 1) and largest AUC (0.773; P = 0.481 compared to Model 1) (Figure 7A). Therefore, we considered that Model 2 was superior to Models 1, 3, and 4. Figure 7C shows user-friendly and quantitative nomograms of Model 2. Obviously, the average cfDNA size, BMI, and plasma cfDNA concentration at the prognostic ability of the nomograms had the largest contributions to predicting a higher fetal fraction (> 20%), followed by library concentration, GA, and multiple gestations. Each point for variables was determined by the intersection of the vertical line drawn from the variable to the point axis [22]. Then, all identified points were summed up on the scale for the six variables. The probability of predicting a higher fetal fraction (> 20%) was read on the total point axis. In the validation sets, the AUC for Model 2 was 0.779 (95% CI: 0.728-0.825) (Figure 7B).
Figure 7.
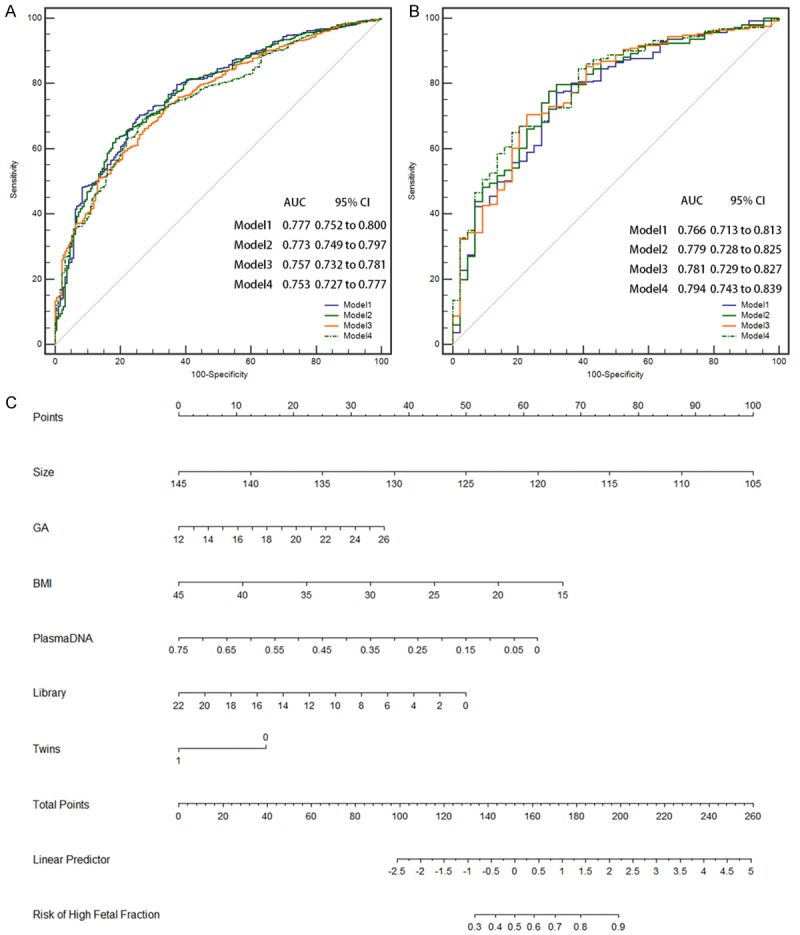
ROC curves for predicting higher fetal fraction (> 20%) ability among the nomograms. A. ROC curve for predicting higher fetal fraction ability of the training data. B. ROC curve for predicting higher fetal fraction ability of the validation data. C. Nomogram for predicting higher fetal fraction. Based on the sum of the covariate points, a vertical line was drawn from the total point line to calculate the probability of high fetal fraction.
Discussion
The reliability of NIPT depends on the assumption that there is sufficient fetal cfDNA in maternal plasma. To date, several technologies have been reported to enrich fetal cfDNA in NIPT. Minarik et al. described the use of Agencourt AMPure XP Reagent beads, and size selection of DNA fragments ~ 155-160 bp was performed after cfDNA extraction. Following size selection, the effective fetal fractions increased to 14.08-50.66% (median = 22.35%) [23]. Hu et al. carried out DNA enrichment after end-repairing and before adaptor ligation during NIPT library construction [12]. After enrichment, the fetal fraction increased to 22.6 ± 6.6%. Our group developed a new NIPT method that sequenced of shorter cfDNA fragments (< 140 bp) to significantly improve the fetal fraction, which increased to 30.7% [21]. For size selection NIPT, to efficiently perform emulsion PCR and subsequent sequencing, size selection for the correct cfDNA library fragment peak < 140 bp is performed with an E-Gel® Agarose Gel Electrophoresis System using an E-Gel® Size Select™ 2% Agarose. These gels have a top row of wells for sample loading and a bottom row of wells to retrieve cfDNA bands of interest. The system also provides real-time monitoring cfDNA bands migrations. Among the 1495 shorter cfDNA sequencing samples, cfDNA concentration and library concentration were negatively correlated with fetal fraction, and uniquely mapped reads were positively correlated with fetal fraction. We also found that cfDNA concentration and library concentration were negatively correlated with fetal fraction in traditional NIPT. Hence, laboratories should note that excessive cfDNA and library concentrations will reduce cfDNA from fetal sources, and affecting NIPT accuracy for detecting aneuploidy.
Several experimental factors may affect fetal DNA concentration. Absorption of cfDNA by magnetic beads occurs during cfDNA extraction and library construction. cfDNA is selectively bound to magnetic beads, which are immobilized when the sample plate is placed on a magnet, leaving unwanted fragments in the liquid phase, which is discarded [24]. Molecular weight exclusion (essentially size selection) of unwanted lower molecular weight DNA fragments can be controlled by changing the volume of PEG NaCl buffer added to the reaction, modifying the final concentration of PEG in the resulting mixture, or altering the size range of fragments bound to the beads [24,25]. Laboratory temperature and humidity and the drying time of magnetic beads in the extracted cfDNA and constructed library may also affect cfDNA binding to the magnetic beads, which in turn affects the fetal fraction in traditional and size selection NIPT. High-resolution plasma DNA size profiling revealed that the most striking differences between fetal and maternal cfDNA fragments were the relative reduction of the 166-bp peak and elevation of smaller peaks ≤ 143 bp for fetal cfDNA, thus suggesting that maternal-derived DNA is longer [5,26,27]. Indeed, sequencing shorter cfDNA significantly decreased mean fetal fraction differences among cfDNA concentration groups, especially in the high cfDNA concentration group (> 0.221 ng/μl) by ~ 23%. Sequencing shorter cfDNA could yield a higher fetal fraction in the high library concentration group (> 0.221 ng/μl, mean fetal fraction: 27.6%). However, probably due to PCR amplification in the process of library construction, sequencing shorter cfDNA increased mean fetal fraction differences among library concentration groups. Fetal fraction was evaluated by calculating the proportion of Y chromosome reads in size selection NIPT. We found that the proportion increased with greater sequencing depth, which is more common in NIPT for subchromosomal abnormalities [27,28].
Fetal fraction in maternal plasma is affected by multiple factors such as BMI, GA, and extraction method [6,11], but few studies have evaluated the comprehensive effect of these factors, including cutting out small molecular weight cfDNA bands from an electrophoretic sizing gel for fetal fraction enrichment or established a practical predictive model. In this study, we constructed easy-to-use, accurate nomograms to predict higher fetal fraction (> 20%). Nomograms are used to visualize quantified confounding factors, and they are useful to better understand how to obtain higher fetal fractions. However, the following limitations should be noted: First, the nomogram were constructed according to data obtained at a single center. Larger samples are needed to verify. Second, although we adjusted for many confounding factors, such as anticoagulation therapy [6], and in vitro fertilization conception [29], other relevant factors may have been overlooked. Third, cutting out small molecular weight cfDNA bands requires a well-experienced laboratory technician.
In summary, our results show that cfDNA concentration and library concentration were negatively correlated with fetal fraction, while uniquely mapped reads were positively correlated with fetal fraction. Lower cfDNA and library concentrations, shorter cfDNA fragments, and higher uniquely mapped reads may be more conducive to obtaining higher fetal fractions. Our easy-to-use nomograms can assist laboratories in obtaining higher fetal cfDNA concentration.
Acknowledgements
We thank all the families for participating in this research project. This work was supported by the Suzhou Key Medical Center (SZZX201505), Jiangsu Maternal and Children Health Care Research Project (F201603), Jiangsu Provincial Medical Innovation Team (CXTDB2017013), Suzhou Clinical Medical Expert Team (SZYJTD201708), Suzhou Science and Technology Support Program (SYS201649 and SYSD2017102), Jiangsu Maternal and Children Health Care Key Discipline (FXK201748 and FXK201754), Natural Science Foundation of China (NSFC) (No. 81801478), Science and Technology Development Fund of Nanjing Medical University (2017NJMU158), Key Research and Development Plan Project of Jiangsu Province (be2017650), the Innovation Program of Jiangsu Province (Q.Z.), and NSFC grants (Nos. 31271399 and 81472047, Q.Z.).
Disclosure of conflict of interest
None.
References
- 1.Allyse MA, Wick MJ. Noninvasive prenatal genetic screening using cell-free DNA. JAMA. 2018;320:591–592. doi: 10.1001/jama.2018.9418. [DOI] [PubMed] [Google Scholar]
- 2.Hoskovec JM, Swigert AS. Sequencing of circulating cell-free DNA during pregnancy. N Engl J Med. 2018;379:2282. doi: 10.1056/NEJMc1812266. [DOI] [PubMed] [Google Scholar]
- 3.Green ED, Rubin EM, Olson MV. The future of DNA sequencing. Nature. 2017;550:179–181. doi: 10.1038/550179a. [DOI] [PubMed] [Google Scholar]
- 4.Canick JA, Palomaki GE, Kloza EM, Lambert-Messerlian GM, Haddow JE. The impact of maternal plasma DNA fetal fraction on next generation sequencing tests for common fetal aneuploidies. Prenat Diagn. 2013;33:667–674. doi: 10.1002/pd.4126. [DOI] [PubMed] [Google Scholar]
- 5.Yu SC, Chan KC, Zheng YW, Jiang P, Liao GJ, Sun H, Akolekar R, Leung TY, Go AT, van Vugt JM, Minekawa R, Oudejans CB, Nicolaides KH, Chiu RW, Lo YM. Size-based molecular diagnostics using plasma DNA for noninvasive prenatal testing. Proc Natl Acad Sci U S A. 2014;111:8583–8588. doi: 10.1073/pnas.1406103111. [DOI] [PMC free article] [PubMed] [Google Scholar]
- 6.Suzumori N, Sekizawa A, Takeda E, Samura O, Sasaki A, Akaishi R, Wada S, Hamanoue H, Hirahara F, Kuriki H, Sawai H, Nakamura H, Yamada T, Miura K, Masuzaki H, Yamashita T, Kamei Y, Namba A, Murotsuki J, Tanemoto T, Fukushima A, Haino K, Tairaku S, Matsubara K, Maeda K, Kaji T, Ogawa M, Osada H, Nishizawa H, Okamoto Y, Kanagawa T, Kakigano A, Endo M, Kitagawa M, Ogawa M, Izumi S, Katagiri Y, Takeshita N, Kasai Y, Naruse K, Neki R, Masuyama H, Hyodo M, Kawano Y, Ohba T, Ichizuka K, Nagamatsu T, Watanabe A, Nishikawa N, Hamajima N, Shirato N, Yotsumoto J, Nishiyama M, Koide K, Hirose T, Sago H. Classification of factors involved in nonreportable results of noninvasive prenatal testing (NIPT) and prediction of success rate of second NIPT. Prenat Diagn. 2019;39:100–106. doi: 10.1002/pd.5408. [DOI] [PubMed] [Google Scholar]
- 7.Medina Diaz I, Nocon A, Mehnert DH, Fredebohm J, Diehl F, Holtrup F. Performance of streck cfDNA blood collection tubes for liquid biopsy testing. PLoS One. 2016;11:e0166354. doi: 10.1371/journal.pone.0166354. [DOI] [PMC free article] [PubMed] [Google Scholar]
- 8.Palomaki GE, Kloza EM, Lambert-Messerlian GM, van den Boom D, Ehrich M, Deciu C, Bombard AT, Haddow JE. Circulating cell free DNA testing: are some test failures informative? Prenat Diagn. 2015;35:289–293. doi: 10.1002/pd.4541. [DOI] [PubMed] [Google Scholar]
- 9.Nicolaides KH, Syngelaki A, del Mar Gil M, Quezada MS, Zinevich Y. Prenatal detection of fetal triploidy from cell-free DNA testing in maternal blood. Fetal Diagn Ther. 2014;35:212–217. doi: 10.1159/000355655. [DOI] [PubMed] [Google Scholar]
- 10.Burns W, Koelper N, Barberio A, Deagostino-Kelly M, Mennuti M, Sammel MD, Dugoff L. The association between anticoagulation therapy, maternal characteristics, and a failed cfDNA test due to a low fetal fraction. Prenat Diagn. 2017;37:1125–1129. doi: 10.1002/pd.5152. [DOI] [PubMed] [Google Scholar]
- 11.Jorgez CJ, Dang DD, Simpson JL, Lewis DE, Bischoff FZ. Quantity versus quality: optimal methods for cell-free DNA isolation from plasma of pregnant women. Genet Med. 2006;8:615–619. doi: 10.1097/01.gim.0000241904.32039.6f. [DOI] [PubMed] [Google Scholar]
- 12.Hu P, Liang D, Chen Y, Lin Y, Qiao F, Li H, Wang T, Peng C, Luo D, Liu H, Xu Z. An enrichment method to increase cell-free fetal DNA fraction and significantly reduce false negatives and test failures for non-invasive prenatal screening: a feasibility study. J Transl Med. 2019;17:124. doi: 10.1186/s12967-019-1871-x. [DOI] [PMC free article] [PubMed] [Google Scholar]
- 13.Jiang P, Lo YMD. The long and short of circulating cell-free DNA and the ins and outs of molecular diagnostics. Trends Genet. 2016;32:360–371. doi: 10.1016/j.tig.2016.03.009. [DOI] [PubMed] [Google Scholar]
- 14.Sun K, Jiang P, Wong AIC, Cheng YKY, Cheng SH, Zhang H, Chan KCA, Leung TY, Chiu RWK, Lo YMD. Size-tagged preferred ends in maternal plasma DNA shed light on the production mechanism and show utility in noninvasive prenatal testing. Proc Natl Acad Sci U S A. 2018;115:e5106–e5114. doi: 10.1073/pnas.1804134115. [DOI] [PMC free article] [PubMed] [Google Scholar]
- 15.Qiao L, Zhang Q, Liang Y, Gao A, Ding Y, Zhao N, Zhang W, Li H, Lu Y, Wang T. Sequencing of short cfDNA fragments in NIPT improves fetal fraction with higher maternal BMI and early gestational age. Am J Transl Res. 2019;11:4450–4459. [PMC free article] [PubMed] [Google Scholar]
- 16.Qiao L, Yu B, Liang Y, Zhang C, Wu X, Xue Y, Shen C, He Q, Lu J, Xiang J, Li H, Zheng Q, Wang T. Sequencing shorter cfDNA fragments improves the fetal DNA fraction in noninvasive prenatal testing. Am J Obstet Gynecol. 2019;221:345.e1–345.e11. doi: 10.1016/j.ajog.2019.05.023. [DOI] [PubMed] [Google Scholar]
- 17.Mouliere F, Chandrananda D, Piskorz AM, Moore EK, Morris J, Ahlborn LB, Mair R, Goranova T, Marass F, Heider K, Wan JCM, Supernat A, Hudecova I, Gounaris I, Ros S, Jimenez-Linan M, Garcia-Corbacho J, Patel K, Ostrup O, Murphy S, Eldridge MD, Gale D, Stewart GD, Burge J, Cooper WN, van der Heijden MS, Massie CE, Watts C, Corrie P, Pacey S, Brindle KM, Baird RD, Mau-Sorensen M, Parkinson CA, Smith CG, Brenton JD, Rosenfeld N. Enhanced detection of circulating tumor DNA by fragment size analysis. Sci Transl Med. 2018;10 doi: 10.1126/scitranslmed.aat4921. [DOI] [PMC free article] [PubMed] [Google Scholar]
- 18.Zhang R, Lin P, Yang X, He RQ, Wu HY, Dang YW, Gu YY, Peng ZG, Feng ZB, Chen G. Survival associated alternative splicing events in diffuse large B-cell lymphoma. Am J Transl Res. 2018;10:2636–2647. [PMC free article] [PubMed] [Google Scholar]
- 19.Suo S, Cheng F, Cao M, Kang J, Wang M, Hua J, Hua X, Li L, Lu Q, Liu J, Xu J. Multiparametric diffusion-weighted imaging in breast lesions: association with pathologic diagnosis and prognostic factors. J Magn Reson Imaging. 2017;46:740–750. doi: 10.1002/jmri.25612. [DOI] [PubMed] [Google Scholar]
- 20.Hou Y, Yu Z, Tam NL, Huang S, Sun C, Wang R, Zhang X, Wang Z, Ma Y, He X, Wu L. Exosome-related lncRNAs as predictors of HCC patient survival: a prognostic model. Am J Transl Res. 2018;10:1648–1662. [PMC free article] [PubMed] [Google Scholar]
- 21.Liang B, Li H, He Q, Li H, Kong L, Xuan L, Xia Y, Shen J, Mao Y, Li Y, Wang T, Zhao YL. Enrichment of the fetal fraction in non-invasive prenatal screening reduces maternal background interference. Sci Rep. 2018;8:17675. doi: 10.1038/s41598-018-35738-0. [DOI] [PMC free article] [PubMed] [Google Scholar]
- 22.Chen F, Lin L, Yan L, Liu F, Qiu Y, Wang J, Hu Z, Wu J, Bao X, Lin L, Wang R, Cai G, Aoyagi K, Cai L, He B. Nomograms and risk scores for predicting the risk of oral cancer in different sexes: a large-scale case-control study. J Cancer. 2018;9:2543–2548. doi: 10.7150/jca.24431. [DOI] [PMC free article] [PubMed] [Google Scholar]
- 23.Minarik G, Repiska G, Hyblova M, Nagyova E, Soltys K, Budis J, Duris F, Sysak R, Gerykova Bujalkova M, Vlkova-Izrael B, Biro O, Nagy B, Szemes T. Utilization of benchtop next generation sequencing platforms ion torrent PGM and MiSeq in noninvasive prenatal testing for chromosome 21 trisomy and testing of impact of in silico and physical size selection on its analytical performance. PLoS One. 2015;10:e0144811. doi: 10.1371/journal.pone.0144811. [DOI] [PMC free article] [PubMed] [Google Scholar]
- 24.Fisher S, Barry A, Abreu J, Minie B, Nolan J, Delorey TM, Young G, Fennell TJ, Allen A, Ambrogio L, Berlin AM, Blumenstiel B, Cibulskis K, Friedrich D, Johnson R, Juhn F, Reilly B, Shammas R, Stalker J, Sykes SM, Thompson J, Walsh J, Zimmer A, Zwirko Z, Gabriel S, Nicol R, Nusbaum C. A scalable, fully automated process for construction of sequence-ready human exome targeted capture libraries. Genome Biol. 2011;12:R1. doi: 10.1186/gb-2011-12-1-r1. [DOI] [PMC free article] [PubMed] [Google Scholar]
- 25.Lennon NJ, Lintner RE, Anderson S, Alvarez P, Barry A, Brockman W, Daza R, Erlich RL, Giannoukos G, Green L, Hollinger A, Hoover CA, Jaffe DB, Juhn F, McCarthy D, Perrin D, Ponchner K, Powers TL, Rizzolo K, Robbins D, Ryan E, Russ C, Sparrow T, Stalker J, Steelman S, Weiand M, Zimmer A, Henn MR, Nusbaum C, Nicol R. A scalable, fully automated process for construction of sequence-ready barcoded libraries for 454. Genome Biol. 2010;11:R15. doi: 10.1186/gb-2010-11-2-r15. [DOI] [PMC free article] [PubMed] [Google Scholar]
- 26.Lo YM, Chan KC, Sun H, Chen EZ, Jiang P, Lun FM, Zheng YW, Leung TY, Lau TK, Cantor CR, Chiu RW. Maternal plasma DNA sequencing reveals the genome-wide genetic and mutational profile of the fetus. Sci Transl Med. 2010;2:61ra91. doi: 10.1126/scitranslmed.3001720. [DOI] [PubMed] [Google Scholar]
- 27.Yin AH, Peng CF, Zhao X, Caughey BA, Yang JX, Liu J, Huang WW, Liu C, Luo DH, Liu HL, Chen YY, Wu J, Hou R, Zhang M, Ai M, Zheng L, Xue RQ, Mai MQ, Guo FF, Qi YM, Wang DM, Krawczyk M, Zhang D, Wang YN, Huang QF, Karin M, Zhang K. Noninvasive detection of fetal subchromosomal abnormalities by semiconductor sequencing of maternal plasma DNA. Proc Natl Acad Sci U S A. 2015;112:14670–14675. doi: 10.1073/pnas.1518151112. [DOI] [PMC free article] [PubMed] [Google Scholar]
- 28.Lo KK, Karampetsou E, Boustred C, McKay F, Mason S, Hill M, Plagnol V, Chitty LS. Limited clinical utility of non-invasive prenatal testing for subchromosomal abnormalities. Am J Hum Genet. 2016;98:34–44. doi: 10.1016/j.ajhg.2015.11.016. [DOI] [PMC free article] [PubMed] [Google Scholar]
- 29.Lee TJ, Rolnik DL, Menezes MA, McLennan AC, da Silva Costa F. Cell-free fetal DNA testing in singleton IVF conceptions. Hum Reprod. 2018;33:572–578. doi: 10.1093/humrep/dey033. [DOI] [PubMed] [Google Scholar]


