

Abstract
Purpose:
This study investigated the acoustic and articulatory movement parameters underlying lexical stress production in children with apraxia of speech (CAS), children with articulation/phonological delay (i.e. speech delay, SD), and children with typical speech-language development (TD). We examined whether there were group differences in these instrumental measures of stress production.
Method:
Participants were 24 children (seven CAS, eight SD, nine TD) between three and seven years of age. Acoustic and kinematic measures, including acoustic duration, peak and average fundamental frequency, and jaw movement duration and displacement, were taken from perceptually accurate productions of a strong-weak form. Relative stress analyses were conducted using the Pairwise Variability Index (PVI).
Result:
There was a significant difference between the CAS and TD groups in the PVI for movement duration, with the CAS group showing a smaller movement duration contrast between stressed and unstressed syllables. There were no significant group differences for displacement or any of the acoustic variables.
Conclusion:
The kinematic findings suggest reduced temporal control for lexical stress production in children with CAS. This finding surfaced during analyses of perceptually accurate productions but suggests a possible basis for lexical stress errors in CAS that could be explored in future studies.
Keywords: Childhood apraxia of speech (CAS), lexical stress, acoustic measures, kinematic measures
Childhood apraxia of speech (CAS) is a neurogenic speech sound disorder that involves impaired planning and/or programming of spatial and temporal aspects of speech movements (American Speech-Language-Hearing Association [ASHA], 2007). A widely-recognised challenge associated with CAS is the differential diagnosis of this disorder from other types of childhood speech sound disorders, including articulation and/or phonological impairment. ASHA’s (2007) technical report on CAS discusses that although there are no universal features of CAS that consistently and reliably differentiate it from other speech sound disorders, three features have received research support: error inconsistency, difficulty with transitions between sounds or syllables, and impaired prosody, including lexical and/or phrasal stress.
Previous studies have documented and explored stress deficits in children with CAS (e.g. Munson, Bjorum, & Windsor, 2003; Odell & Shriberg, 2001; Shriberg, Aram, & Kwiatkowski, 1997a, 1997b; Shriberg et al., 2003; Skinder, Strand, & Mignerey, 1999; Velleman & Shriberg, 1999). Impaired speech motor control, which is characteristic of CAS, is presumed to underlie the prosodic deficits seen in this population (e.g. ASHA, 2007; Shriberg et al., 2003). This notion, however, has not been adequately explored in past research. The current study examined speech motor control during accurate lexical stress production (i.e. relative prominence of syllables within words) in children with CAS, children with speech delay (SD) characterised by articulation and/or phonological deficits, and typically-developing (TD) controls. Using a multi-modal approach, we explored whether the acoustic and articulatory movement parameters that underlie accurate lexical stress production differentiate children with CAS from those with SD and TD. This approach was taken since prior research has uncovered deficits in speech motor control within perceptually accurate productions using instrumental techniques similar to those used in the present study (e.g. Grigos, Moss, and Lu, 2015; Smith, Sadagopan, Walsh, & Weber-Fox, 2010).
Correlates of Stress in Typical Speakers
Acoustic Correlates.
Stressed and unstressed syllables are associated with differences in duration, fundamental frequency (F0), and intensity (Fry, 1958; Liberman, 1960), as well as vowel formant structure (Fry, 1964; Howell, 1993). While attempts have been made to rank these acoustic cues according to their importance in both stress production (e.g. Liberman, 1960) and perception (e.g. Fry, 1958), large individual differences in cue use have been reported (Howell, 1993). Additionally, studies have provided evidence for trading relationships among acoustic cues (Howell, 1993; Kehoe, Stoel-Gammon, & Buder, 1995; Liberman, 1960), where the absence of a given stress cue may be offset by use of another. These findings support the notion that stress is not realised by a single, consistent acoustic parameter (e.g. Hayes, 1995) but rather a combination of cues which may vary between and within individuals. Although children as young as 18 months of age have been shown to use F0, intensity, and duration to mark stress (Kehoe et al., 1995), developmental differences in lexical stress production have been reported. For instance, Ballard, Djaja, Arciuli, James, and van Doorn (2012) found that adults and children as young as three did not differ in their control of relative duration, intensity, or F0 for strong-weak (SW; i.e. trochaic) forms, but differences were observed between adults and seven-year-old children for weak-strong (WS; i.e. iambic) forms.
Articulatory Correlates.
Stress production is thought to involve the actions of multiple subsystems (pulmonary, laryngeal, articulatory), resulting in a range of physiological correlates (Kent & Netsell, 1971). In terms of articulation, Kent and Netsell (1971) found that vowels in stressed, compared to unstressed, syllables tended to be produced with lower jaw positions (i.e. greater opening) and greater lingual displacement toward the target. Similarly, Kelso, Vatikiotis-Bateson, Saltzman, and Kay (1985) demonstrated that articulatory movements associated with stressed syllables were generally larger in displacement, longer in duration, and higher in velocity compared to unstressed syllables. In a study with developmental implications, Goffman and Malin (1999) demonstrated that adults and children (three- to four-year-olds) produced distinct lip movement patterns for SW and WS forms. For adults, both forms showed evidence of amplitude modulation (i.e. larger movement displacement for stressed compared to unstressed syllables), but this was greater for WS forms. Children also showed evidence of amplitude modulation but only in WS forms. Interestingly, movements for WS forms were less variable than for SW forms in both groups, even though the former is often considered to be more challenging. The authors suggested that children may be able to use established rhythmic behaviours, such as those used during babbling, to produce SW forms but need to implement more specified (i.e. less variable) movement sequences to produce highly-modulated WS forms.
Taken together, previous kinematic findings suggest that lexical stress production is associated with various changes in articulator movement. In an articulatory model of stress production, de Jong (1995) describes stress as a “local shift toward hyperarticulate speech” (p. 493), which encompasses a variety of articulatory changes that increase a syllable’s distinctness. This includes actions such as increased oral opening in stressed vowels, increased oral closure in stressed consonants, and stress-related changes along a horizontal dimension, such as increased retraction and protrusion (de Jong, 1995). An important component of the hyperarticulation model is that stress is viewed in terms of “abstract articulatory goals” (p. 501) rather than being articulator-specific. Thus, a variety of different articulators and strategies (i.e. movement amplitude, timing, etc.) may be used to achieve the speaking goal. The present study examines the acoustic and articulatory correlates of stress reviewed above in relation to CAS.
Stress in CAS
Prosodic deficits, including stress errors, have been noted as a characteristic of CAS since some of the earliest descriptions of this disorder (e.g. Rosenbek & Wertz, 1972; Yoss & Darley, 1974), and there has been much interest in atypical prosody as a potential indicator of CAS. For instance, a series of studies by Shriberg and colleagues (1997a, 1997b) compared the speech and prosody-voice profiles of three separate samples of children with suspected CAS to children with speech delay and found that only stress significantly differentiated a portion of children in these groups. The most common stress error pattern was described as excessive/equal phrasal stress, but lexical stress errors were also noted. While the present study further investigates stress in CAS, we note that recent work within the prosodic domain has also focused on phrasing errors (i.e. inappropriate pauses) to develop a Pause Marker for differentiating CAS from speech delay (e.g. Shriberg et al., 2017).
A number of studies have examined the acoustic correlates of stress in children with CAS. A common focus throughout this research has been on determining whether acoustic measures of stress differentiate children with CAS from those without this disorder (Munson et al., 2003; Shriberg et al., 2003; Skinder et al., 1999), but there are numerous methodological differences that limit the ability to directly compare these works. These include differences in stimuli, participant group studied in comparison to children with CAS, and type of lexical stress analysis (e.g. separate analyses of each acoustic variable versus use of a composite measure).
In Skinder et al.’s (1999) study, children with CAS and typically-developing peers imitated di- and multisyllabic words and interrogative and emotive sentences, and listeners judged the stress accuracy of the children’s productions. As a group, the children with CAS were judged to be less accurate than the typically-developing children for all types of stimuli, but acoustic analysis (conducted for two of the sentences) showed that children in both groups used F0, amplitude, and duration similarly to mark sentential stress. Subsequently, Munson et al. (2003) investigated the acoustic correlates of stress in children with CAS in comparison to children with phonological disorder. The participants in this study imitated SW and WS nonwords, and listeners judged whether the productions had initial or final stress. Similar to Skinder et al.’s (1999) findings, the listeners judged the productions of the CAS group to match the target stress pattern less often than those of the phonological disorder group, but no significant differences were noted in the groups’ use of acoustic cues (vowel duration, F0 and amplitude at vowel midpoint, or timing of the pitch peak in stressed syllables) to mark stress. Both Skinder et al. (1999) and Munson et al. (2003) posited that reduced segmental accuracy of the children with CAS compared to their comparison groups may have contributed to the lower stress accuracy ratings for the CAS group, despite the lack of group differences in the acoustic analyses. Munson et al. (2003) also raised the possibility that other acoustic correlates of stress which were not assessed in their study, such as measures of vowel and consonant articulation, may have differed between the groups and contributed to the perceptual findings.
The results of the Skinder et al. (1999) and Munson et al. (2003) studies differ from those of Shriberg et al. (2003), which demonstrated differences in acoustic measures of lexical stress between children with CAS and those with speech delay. Shriberg et al. (2003) studied imitated productions of SW words in 11 participants with CAS and 24 with speech delay. Composite Lexical Stress Ratios were derived from participants’ average ratios of strong to weak syllable measures of vowel duration, frequency area (frequency average × vowel duration), and amplitude area (amplitude average × vowel duration). Five of the six Lexical Stress Ratios that fell at the upper and lower extremes of the distribution were obtained by children with CAS, which was significantly more than expected by chance. The authors interpreted their findings as support for the Lexical Stress Ratio as a possible diagnostic marker for CAS. However, in light of conflicting acoustic findings from prior studies (Munson et al., 2003; Skinder et al., 1999), the question of whether acoustic measures of stress are able to differentiate children with CAS from other children clearly remains unresolved.
Purpose and Research Questions
Previous research has provided perceptual as well as some acoustic support that stress production differs in children with CAS compared to children without this disorder. The conflicting acoustic findings from past work and lack of articulatory/kinematic studies of stress production in CAS motivate the need to develop a clearer understanding of the patterns of speech motor control that underlie lexical stress production in children with and without CAS. Therefore, the purpose of this study was to examine whether acoustic and/or kinematic parameters associated with accurate lexical stress production differentiate children with CAS from children with SD and TD children. Specifically, the following research questions were addressed: (1) Do children with CAS, SD, and TD differ in their modification of acoustic cues to mark lexical stress? (2) Do children with CAS, SD, and TD produce different oral articulator movement patterns to mark lexical stress? Based on perceptual descriptions of equalised stress in CAS (e.g. Shriberg et al., 1997a; Rosenbek & Wertz, 1972; Yoss & Darley, 1974), we predicted that children with CAS would demonstrate reduced acoustic and kinematic contrasts between strong and weak syllables compared to children with SD and TD.
Method
Participants
Twenty-four children between the ages of three and seven years participated in this study: seven with CAS, eight with SD, and nine TD controls. These children were part of a larger study (n = 33; 11 CAS, 11 SD, 11 TD) examining articulatory control in childhood apraxia of speech (Grigos, Moss, & Lu, 2015). From this larger group of children, nine children (four CAS, three SD, two TD) were excluded from the present study because they did not produce a required minimum of three tokens that met the analysis criteria, described below. This minimum of three analysable productions was set to allow intra-participant patterns and/or variability to be observed. The groups were similar in age (CAS: M = 63.6 months, St Dev = 13.3; SD: M = 65.0 months, St Dev = 10.7; TD: M = 66.6 months, St Dev = 12.5). There was one female participant in the SD group, one in the TD group, and the remaining participants were male. All participants were monolingual speakers of American English.
All of the children in this study completed a standardised speech, language, cognitive, and oral motor testing protocol and a hearing screening as part of their participation in the larger study. Inclusionary criteria and group assignment procedures are described in detail in that report (Grigos et al., 2015) but will be briefly summarised here. All participants were required to demonstrate non-verbal cognitive and receptive language skills that were within a normal range as determined by the Columbia Mental Maturity Scale (CMMS; Burgmeister, Blum, & Lorge, 1972) and the receptive language subtest of the Test of Early Language Development (TELD-3; Hresko, Reid, & Hammill, 2007), respectively. All participants also passed a hearing screening (500, 1000, 2000 and 4000 Hz at 25 dB SPL) and demonstrated normal structure of the oral mechanism as determined by the Verbal Motor Production Assessment for Children (VMPAC; Hayden & Square, 1999). Expressive language and speech production skills were also assessed, but performance criteria differed for the CAS, SD, and TD groups as described in the next section. Expressive language was evaluated using the TELD-3, and speech production was evaluated through the Goldman Fristoe Test of Articulation (GFTA-2; Goldman & Fristoe, 2000), the Sequencing subtest of the VMPAC, and a 100-word speech sample. Speech accuracy within the speech samples was described using percentage of consonants and vowels correct (PCC and PVC; Shriberg, Austin, Lewis, McSweeny, & Wilson, 1997) and a measure of whole words correct (WWC) that defined correct productions as those without segmental or suprasegmental errors. Results of formal and informal testing for the participants in the current study (n = 24) are shown in Table I.
Table I:
Formal and Informal Testing Results
| TELD |
CMMS |
GFTA |
VMPAC |
SPEECH SAMPLE |
||||||||
|---|---|---|---|---|---|---|---|---|---|---|---|---|
| Participant | Age (mos.) | RLQ | ELQ | ADS | Percentile | SS | GMC | FOMC | SEQ | PCC | PVC | WWC |
| CAS1 | 45 | 116 | 115 | 150 | 5 | 64 | 95 | 77 | 57 | 54 | 81 | 27 |
| CAS2 | 51 | 122 | 91 | 106 | 56 | 104 | 80 | 66 | 48 | 75 | 87 | 49 |
| CAS3 | 62 | 113 | 115 | 150 | 19 | 88 | 85 | 84 | 72 | 55 | 52 | 47 |
| CAS4 | 64 | 110 | 88 | 120 | 13 | 82 | 85 | 93 | 87 | 87 | 92 | 59 |
| CAS5 | 68 | 110 | 105 | 122 | <1 | 47 | 100 | 91 | 70 | 80 | 85 | 55 |
| CAS6 | 69 | 85 | 91 | 113 | 2 | 55 | 100 | 97 | 76 | 66 | 76 | 54 |
| CAS7 | 86 | 115 | 115 | 116 | 30 | 100 | 100 | 98 | 98 | 83 | 83 | 61 |
| SD1 | 49 | 125 | 124 | 103 | 2 | 53 | 85 | 83 | 61 | 65 | 88 | 43 |
| SD2 | 56 | 108 | 115 | 118 | 43 | 99 | 100 | 97 | 80 | 88 | 93 | 75 |
| SD3 | 58 | 95 | 102 | 105 | 66 | 110 | 100 | 74 | 100 | 90 | 93 | 68 |
| SD4 | 63 | 110 | 112 | 130 | 79 | 112 | 100 | 99 | 100 | 90 | 95 | 73 |
| SD5 | 64 | 110 | 94 | 106 | 14 | 83 | 100 | 94 | 100 | 79 | 86 | 56 |
| SD6 | 72 | 110 | 97 | 106 | 27 | 98 | 100 | 95 | 98 | 83 | 99 | 67 |
| SD7 | 78 | 105 | 102 | 94 | 8 | 74 | 95 | 99 | 78 | 84 | 87 | 60 |
| SD8 | 79 | 100 | 97 | 118 | 9 | 77 | 100 | 100 | 100 | 74 | 89 | 62 |
| TD1 | 49 | 122 | 112 | 108 | 41 | 99 | 100 | 100 | 100 | 80 | 87 | 84 |
| TD2 | 50 | 131 | 115 | 105 | 72 | 110 | 100 | 98 | 96 | 94 | 98 | 91 |
| TD3 | 58 | 119 | 112 | 128 | >87 | 117 | 100 | 99 | 83 | 92 | 89 | 95 |
| TD4 | 66 | 130 | 118 | 128 | >83 | 113 | 100 | 100 | 100 | 98 | 99 | 98 |
| TD5 | 68 | 121 | 97 | 150 | >79 | 112 | 100 | 100 | 100 | 100 | 100 | 100 |
| TD6 | 69 | 118 | 94 | 130 | >79 | 112 | 100 | 99 | 100 | 99 | 100 | 99 |
| TD7 | 73 | 118 | 112 | 115 | 54 | 107 | 100 | 97 | 98 | 97 | 100 | 91 |
| TD8 | 82 | 110 | 102 | 107 | >64 | 110 | 100 | 99 | 100 | 100 | 99 | 98 |
| TD9 | 84 | 100 | 115 | 94 | >64 | 109 | 100 | 100 | 94 | 93 | 95 | 94 |
Note: CAS = childhood apraxia of speech; SD = speech delay characterized by articulation/phonological impairment; TD = typical development. TELD = Test of Early Language Development-3 (RLQ = receptive language quotient; ELQ = expressive language quotient); CMMS = Columbia Mental Maturity Scale (ADS = age deviation score); GFTA = Goldman-Fristoe Test of Articulation-2 (SS = standard score); VMPAC = Verbal Motor Production Assessment for Children (GMC = global motor control; FOMC = focal oral motor control; SEQ = sequencing); PCC = percentage of consonants correct; PVC = percentage of vowels correct; WWC = percentage of whole words correct. Table adapted from Grigos et al. (2015).
Group Assignment.
As described in Grigos et al. (2015), the differential diagnoses of CAS and SD were based on in-depth analyses of speech performance across the three different speaking contexts: single words (GFTA-2), connected speech (speech sample), and sound/ syllable sequencing tasks (VMPAC). Children assigned to the speech-impaired groups (CAS or SD) met at least one of the following: GFTA-2 standard scores below 85, PCC below 85%, and/or WWC below 65% for children up to 48 months of age or below 80% for children over 48 months of age (based on normative data for whole-word accuracy reported in Schmitt, Howard, & Schmitt, 1983). Children were assigned to the CAS group if they demonstrated the three features highlighted in the ASHA (2007) technical report on CAS (i.e. inconsistent consonant and vowel errors across repeated productions, difficulty with articulatory transitions between sounds and/or syllables, and inappropriate lexical and/or phrasal stress) in more than one speaking context. Children with CAS also had to display at least four of the following characteristics associated with this disorder (e.g. ASHA, 2007; Davis, Jakielski, & Marquardt, 1998; Hall, Jordan, & Robin, 1993; Odell & Shriberg, 2001; Shriberg et al., 1997; Velleman & Strand, 1994): metathesis, vowel errors, timing errors, phoneme distortions, articulatory groping, impaired volitional oral movement, reduced phonetic inventory, and poorer expressive than receptive language skills. Children were assigned to the SD group if they demonstrated consonant or vowel substitutions, omissions, additions, and distortions consistent with an articulation impairment (e.g. interdental lisp, r-distortion) and/or systematic use of phonological processes (e.g. velar fronting, gliding) consistent with a phonological impairment. These error patterns had to be observed in more than one speaking context. Critically, children in the SD group did not exhibit a combination of the three features highlighted in ASHA’s (2007) technical report or motor speech/sequencing deficits on the VMPAC. There was not an expressive language requirement for children in the CAS and SD groups since speech production deficits may impact expressive language skills. Children were assigned to the TD group if they had negative histories of speech, language, hearing, or neurological problems and demonstrated the following: normal structure and function of the oral mechanism based on the VMPAC, age-appropriate expressive language skills based on the TELD-3 (not lower than one standard deviation below the mean), and age-appropriate articulation skills in single-word productions and connected speech. The latter was determined using a GFTA-2 cutoff score of 85 and normative data provided in Smit, Hand, Freilinger, Bernthal, and Bird (1990) and Hodson and Paden (1981).
Data Collection
Data collection took place in a sound-attenuated booth in the Department of Communicative Sciences and Disorders at New York University. A motion capture system (Vicon 460; Vicon Motion Systems, 2001) was used to track articulator movement in three dimensions during a word production task at a sampling rate of 120 frames per second. Participants were seated in a chair that faced three motion capture cameras. Seven 3-mm reflective markers were placed on the lips (midline of the vermilion border of the upper lip, midline of the vermilion border of the lower lip, right and left corners of the mouth) and jaw (midline, right and left sides) to track movement of these articulators. In addition, five reference markers were placed on the forehead (midline, right and left sides) and nose (nasion and tip). Data collection sessions were recorded using a Sony digital video camera. A series of Audio Video Interleave files were created during each session, which were converted into Waveform Audio (WAV) files with a 22 050 Hz sampling rate.
Children participated in a task that elicited multiple productions of single-word targets in the context of a story. Productions of several different target words (pop, puppet, puppypop) were elicited from each participant as part of the larger project, but only the procedures and analyses from puppypop (/ˈpʌ.pi.ˌpap/) will be reported here. This “word” represented a character’s name in the story and was chosen for the present study because its trisyllabic structure enabled the analysis of a SW stress pattern (puppy, /ˈpʌ.pi/) while avoiding final lengthening effects on the unstressed syllable (Ballard et al., 2012). Thus, lexical stress analyses were conducted on the SW form puppy within the puppypop productions.
Participants were introduced to the character puppypop through a prop and verbal models of the character’s name. As the experimenter told a story, the prop was used to prompt the children to produce the target in response to a question or cloze sentence. Approximately 10-15 productions of puppypop were elicited from each participant in a randomised order with the other target words. Participants were periodically exposed to additional models of the target throughout the story, but direct imitations were avoided whenever possible. This elicitation paradigm was selected over tasks such as repetition or picture naming in order to encourage naturalistic productions of the targets.
Data Selection
Participants’ productions of puppypop were narrowly transcribed by the first author. Each participant’s first five accurate and appropriate productions were selected for acoustic and kinematic analysis, resulting in a maximum data set of 35 productions for the CAS group (five × seven participants), 40 for the SD group (five × eight participants), and 45 for the TD group (five × nine participants), or 120 total. The target number was set at five per participant since this was attainable for most of the children. However, six participants did not reach five analysable productions, including three participants that had four (all CAS) and three participants that had three (one CAS, one SD, one TD). Thus, the actual data set was reduced to 111 productions (30 CAS, 38 SD, 43 TD). Accurate tokens were those that were judged to be perceptually correct on both segmental and suprasegmental (i.e. lexical stress) levels. Analyses were limited to correct productions for several reasons. First, since the interest in this study was potential group differences in acoustic and kinematic parameters of lexical stress, this decreased the likelihood that any observed differences would be due to segmental effects caused by articulation errors. Additionally, underlying deficits in speech motor control have been observed in perceptually correct productions (e.g. Smith, Sadagopan, Walsh, & Weber-Fox, 2010), further justifying the analysis of accurate productions. Fully accurate productions of puppypop were always selected first. However, given that this multisyllabic token was challenging for some of the participants to produce, certain exceptions were made if five fully accurate productions of puppypop were not available. The criteria for acceptable segmental errors were those that did not involve, or were not directly adjacent to, the portion of the target to be analysed (puppy). Therefore, acceptable errors could affect the vowel or final consonant in the third, unanalysed, syllable of the original three-syllable target (puppypop), such as vowel substitution/distortion and final consonant substitution/deletion. A total of nine productions with acceptable segmental errors were analysed, including one from the CAS group, three from the SD group, and five from the TD group. Appropriate tokens were those that were free of factors that could prohibit or compromise valid acoustic measures of lexical stress parameters, such as background noise, rising intonation (as in questioning or guessing), and abnormal vocal characteristics that are considered unrelated to stress (Kehoe et al., 1995).
Reliability.
Two additional transcribers experienced in narrow transcription independently listened to and transcribed a subset of the puppypop productions to ensure that those selected for acoustic and kinematic analysis were perceived as accurate by more than one listener. One participant from each group was randomly selected for this process, and transcribers were blind to group membership. Each transcriber listened to the participant’s full inventory of puppypop productions (i.e. the five productions selected for analysis and the remainder of their puppypop productions, including any with segmental and/or suprasegmental errors) so that the transcribers were not only exposed to correct productions. The transcribers were instructed to judge if each production was accurate or inaccurate, with accurate productions being those perceived as correct on both segmental and suprasegmental levels. Then, judgments on the productions selected for analysis were compared and percentage of agreement was calculated. The average agreement with the other transcribers was 90% for puppypop judgments, rising to 97% when limiting judgments to the analysed portion of the word (puppy).
Acoustic Measures
Acoustic analyses were carried out using Praat (Boersma & Weenink, 2011). Acoustic duration and F0 measures were taken from the first and second vowels in each disyllabic form puppy (V1: /ʌ/, V2: /i/). While intensity was also an acoustic parameter of interest, the absence of a head-mounted microphone during data collection limited the validity of our intensity measures, precluding their use. Vowel onsets and offsets were identified using a broadband spectrogram with a window length of 0.005 seconds to determine general boundary regions and the acoustic waveform for final decisions (Turk, Nakai, and Sugahara, 2006). Vowel onset was marked at the release of the preceding consonant (Peterson & Lehiste, 1960), as indicated by the release burst on the spectrogram and waveform. Vowel offset was determined by a combination of cues (e.g. Jacewicz, Fox, & Salmons, 2011; Turk et al., 2006), including the offset of second formant energy in the spectrogram and a decrease in waveform amplitude and/or a change in its periodicity (e.g. elimination of periodicity, change in complexity).
Acoustic Duration.
Acoustic duration was measured from vowel onset (i.e. the point of consonant release) to vowel offset, which included voice onset time and any aspiration that occurred during that time. While the onset of voicing is sometimes used as the starting point for acoustic measures of vowel duration (e.g. Munson et al., 2003, Peterson & Lehiste, 1960), we selected the present approach because it is more similar to the movement duration measure used in this study. In support of this decision, we note that previous studies that have taken both acoustic and kinematic measures of vowel duration have measured acoustic duration from the release of the preceding consonant (e.g. Edwards, Beckman, & Fletcher, 1991).
Fundamental Frequency.
For F0 measures, the pitch range was set from 100 to 550 Hz based on the range typically used by the participants. In order to decrease consonantal effects on the F0 measures, the initial and final 15 ms of the voiced region of each vowel was eliminated; if the voiced region was less than 40 ms long, then one quarter of its duration was eliminated (Levi, 2005). On several occasions, tokens selected for analysis showed obvious pitch track errors that could not be resolved by adjusting pitch settings. These were replaced with the next accurate/ appropriate token from the inventory, if available. On the four occasions where replacement tokens were not available, the vowel was cropped using the procedure described above, followed by additional manual cropping until the analysis region only contained a normal pitch line. Maximum (“peak”) and average F0 were measured for each cropped vowel using Praat’s automatic, autocorrelation method.
Kinematic Measures
Jaw movement was tracked from the right jaw marker to reduce error associated with chin surface tracking (Green, Wilson, Wang, & Moore, 2007). Reference markers on the forehead and nose determined orientation and accounted for head movement/rotation. The jaw signal was derived by subtracting its y coordinate from the stationary forehead markers (jaw - forehead). The kinematic traces were analysed using MATLAB, version 7.5 (MathWorks, 2007). As described in Grigos et al. (2015), the onset and offset of the movement sequence for each puppypop production was determined using the jaw displacement trajectory. Movement onset was marked as ten frames (0.083 seconds) prior to the maximum (“peak”) jaw closing displacement for the initial consonant (puppypop), and movement offset was marked as ten frames (0.083 seconds) after the peak jaw opening displacement for the final vowel (puppypop). However, since the current study focused on the SW structure of the first two syllables in puppypop, measures of jaw movement duration and displacement were only analysed for the movement sequences associated with the vowels (V1: /ʌ/, V2: /i/) in each disyllabic form puppy.
Movement Duration.
Movement duration for V1 (/ʌ/) was calculated as the time between the peak closure for the first /p/ (/ˈpʌ.pi.ˌpap/) to the peak closure for the second /p/ (/ˈpʌ.pi.ˌpap/) in each production. Similarly, movement duration for V2 (/i/) was calculated as the time between the peak closure for the second /p/ (/ˈpʌ.pi.ˌpap/) to the peak closure for the third /p/ (/ˈpʌ.pi.ˌpap/) in each production (see Figure 1). Thus, movement duration was a temporal measure of jaw opening into each vowel and closing into the following consonant (/p/ in both instances).
Figure 1.
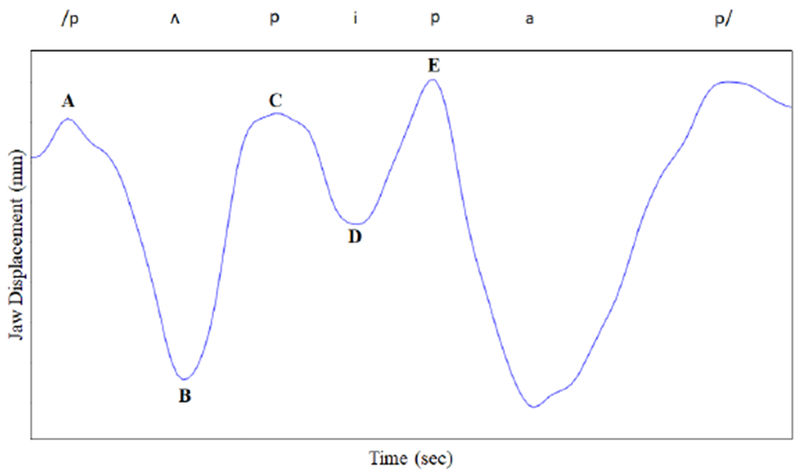
Kinematic trace of jaw displacement for the utterance puppypop (/ˈpʌ.pi.ˌpap/). Movement duration was calculated as the time between points A-C and C-E. Displacement was measured as the distance between points A-B and C-D.
Displacement.
Displacement for V1 was measured as the degree of jaw opening from the peak closure for the first /p/ (/ˈpʌ.pi.ˌpap/) to maximum opening for the vowel (/ʌ/) in each production. Similarly, displacement for V2 was measured as the degree of jaw opening from the peak closure for the second /p/ (/ˈpʌ.pi.ˌpap/) to maximum opening for the vowel (/i/) in each production (see Figure 1).
Relative Stress Analyses
A Pairwise Variability Index (PVI; Ballard et al., 2012; Ballard et al., 2010; Low et al., 2000) was computed for the acoustic and kinematic parameters of interest as a measure of relative stress between the first and second syllables in each production of puppy. A relative stress analysis enabled the examination of how children with CAS, SD, and TD mark contrasts between strong and weak syllables, regardless of any intrinsic differences that exist between the syllables (particularly, the vowels) in the disyllabic form. For instance, there are differences in vowel height between V1 and V2 in puppy, and therefore, independent of stress considerations, differences in the degree of jaw opening might be expected for these vowels (i.e. greater opening for the low-mid /ʌ/ compared to the high /i/). In this study, our interest was not in the absolute differences between vowels/syllables, but rather in potential group differences in the degree of contrast between stressed and unstressed syllables.
The PVI was calculated using the following formula (adapted from Ballard et al., 2012; Ballard et al., 2010), where m is the measure of a given acoustic parameter (i.e. acoustic duration, peak F0, average F0) or kinematic parameter (i.e. movement duration, displacement) from each syllable in a given puppy production: PVI_parameter = 100 × {(m1 – m2) / [(m1 + m2) / 2]}. As described in previous studies that have used this measure of relative stress (e.g. Ballard et al., 2012; Ballard et al., 2010), the size of the PVI in terms of its absolute value indicates the degree of contrast between the two syllables in the measured parameter: the larger the PVI, the greater the contrast. Additionally, the sign of the PVI indicates which syllable has the greater value of the measured parameter. A positive PVI reflects a greater value for the first syllable compared to the second, as expected for a SW form, and a negative PVI reflects a greater value for the second syllable compared to the first, as expected for a WS form (Ballard et al., 2012; Ballard et al., 2010). Recall that in the present study, multiple (three to five) puppy productions from each participant underwent acoustic and kinematic analyses, resulting in three to five PVI values for each participant for each acoustic and kinematic parameter.
Statistical Analyses
Linear mixed effects analyses were conducted in R, version 3.5.0 (R Core Team, 2018) using the lme4 (Bates, Maechler, Bolker, & Walker, 2015) and lmerTest (Kuznetsova, Brockhoff, & Christensen, 2017) packages. Five dependent variables were analysed: (1) PVI_acoustic duration, (2) PVI_peak F0, (3) PVI_average F0, (4) PVI_movement duration, and (5) PVI_displacement. Each model was constructed with the fixed effects of Group (CAS, SD, TD) and age (in months), with the former as the factor of interest and the latter regarded as a control variable (e.g. Winter, 2013). Each model also specified random intercepts for participants to account for child-specific variation. Likelihood ratio tests compared each full model to a reduced model without Group to determine the significance of this factor (e.g. Winter, 2013). When Group was significant, pairwise comparisons were made between each group (under the full model). For all tests, an alpha level of 0.05 was used to determine statistical significance.
Result
Acoustic Findings
Means and standard deviations for PVIs for the acoustic variables are presented by group in Table II. All means were positive, as expected for a SW form. Likelihood ratio tests comparing full (i.e. with Group) and reduced (i.e. without Group) models were not significant for PVI_acoustic duration (χ2(2) = 1.79, p = 0.408), PVI_peak F0 (χ2(2) = 0.53, p = 0.786), or PVI_average F0 (χ2(2) = 0.33, p = 0.847). In other words, group membership was not a significant predictor of PVI values for any of the acoustic variables.
Table II.
Mean (standard deviation) PVIs by group
| Group | PVI_Acoustic Duration | PVI_Peak F0 | PVI_Average F0 | PVI_Movement Duration | PVI_Displacement |
|---|---|---|---|---|---|
| CAS | 19.6 (25.2) | 0.9 (13.6) | 2.5 (8.5) | 18.0 (32.4) | 73.4 (65.8) |
| SD | 12.3 (21.2) | 3.2 (10.6) | 4.2 (11.6) | 21.9 (18.3) | 66.3 (45.5) |
| TD | 15.0 (16.5) | 2.4 (11.7) | 3.4 (10.5) | 33.1 (29.3) | 86.9 (62.0) |
Note: PVI = pairwise variability index; F0 = fundamental frequency; CAS = childhood apraxia of speech; SD = speech delay characterized by articulation/phonological impairment; TD = typical development.
Kinematic Findings
Means and standard deviations for PVIs for the kinematic variables are presented by group in Table II. All means were positive, as expected for a SW form. For PVI_movement duration, a comparison of the full and reduced models was significant (χ2(2) = 6.42, p = 0.040), indicating an effect of group membership. Pairwise comparisons revealed significantly larger PVI_movement duration values for participants in the TD group compared to the CAS group (β = 15.24, t = 2.39, p = 0.018). There were no significant differences between the SD and CAS groups (β = 3.97, t = 0.61, p = 0.544) or the TD and SD groups (β = 11.28, t = 1.90, p = 0.061). For PVI_displacement, the likelihood ratio test comparison between full and reduced models was not significant (χ2(2) = 2.38, p = 0.304), suggesting that group membership was not a significant predictor of this variable.
Discussion
This study examined PVIs for acoustic and kinematic variables as an index of relative stress in productions of a SW form (puppy) that were perceived to be accurate. By examining PVIs for acoustic duration, F0, and jaw movement duration and displacement, this study investigated both control of acoustic cues and aspects of articulatory control for the production of lexical stress contrasts. We sought to determine whether children with CAS, SD, and TD demonstrated underlying differences in speech motor control despite their perceptual accuracy in achieving these contrasts.
Control of Acoustic Cues for Lexical Stress Production
In this study, children with CAS, SD, and TD performed similarly in the manner in which they used acoustic cues for duration and F0 to mark lexical stress in accurate productions of puppy. Specifically, the groups did not differ in stress contrastiveness based on any of these parameters. These results parallel Munson et al.’s (2003) finding of no significant differences between children with suspected CAS and those with phonological disorder in their use of acoustic cues to mark stress, based on analyses of F0 and intensity ratios in SW stimuli and duration ratios in WS stimuli. In contrast, the present results differ from Shriberg et al.’s (2003) finding that a Lexical Stress Ratio derived from acoustic measures differentiated children with CAS and those with speech delay. One aspect of Shriberg et al.’s (2003) study that distinguishes it from both the current investigation and that of Munson et al. (2003) is the composite nature of the Lexical Stress Ratio. It is possible that acoustic differences in lexical stress between children with and without CAS might only be appreciated when relevant acoustic cues are examined in a collective fashion as opposed to independently. Future studies could directly compare singular versus composite lexical stress measures in order to shed more light on this possibility.
Articulatory Control for Lexical Stress Production
By examining PVIs for jaw movement duration and displacement, this study investigated both temporal and spatial aspects of articulatory control for the production of lexical stress contrasts. Significant group differences were noted in the temporal domain. All of the groups, on average, displayed positive PVIs for movement duration (i.e. a pattern of increased jaw movement duration for V1 compared to V2), but children in the TD group achieved a significantly larger jaw movement duration contrast compared to those with CAS. Under a hyperarticulation model of stress (de Jong, 1995), increasing the relative duration of stressed syllables can be viewed as a strategy to enhance their distinctness. Despite the fact that the analysed productions were judged to be perceptually accurate, children with CAS as a group did not modify movement duration to the same extent as the TD children to mark stress. Other signs of reduced temporal control in children with CAS, such as longer acoustic durations compared to TD children, have been documented in previous studies (e.g. Bahr, 2005; Nijland et al., 2003). The present movement duration findings add to this evidence and suggest that poor temporal control of articulatory movements could contribute to lexical stress difficulties in CAS. Specifically, children with CAS may have difficulty specifying movement parameters to achieve sufficient temporal contrasts between stressed and unstressed syllables. One important consideration is that SD participants did not significantly differ from the CAS or TD groups in their use of movement duration to mark lexical stress. Descriptively, movement duration PVIs for the SD group were more similar to those of CAS group than to those of the TD group, as seen in Figure 2. Thus, while potential differences between the CAS and SD groups are clearly of research and clinical interest from a differential diagnosis standpoint, they were not identified in this study. Additional research exploring temporal control in a wider range of stress tasks is needed to further investigate this issue.
Figure 2.
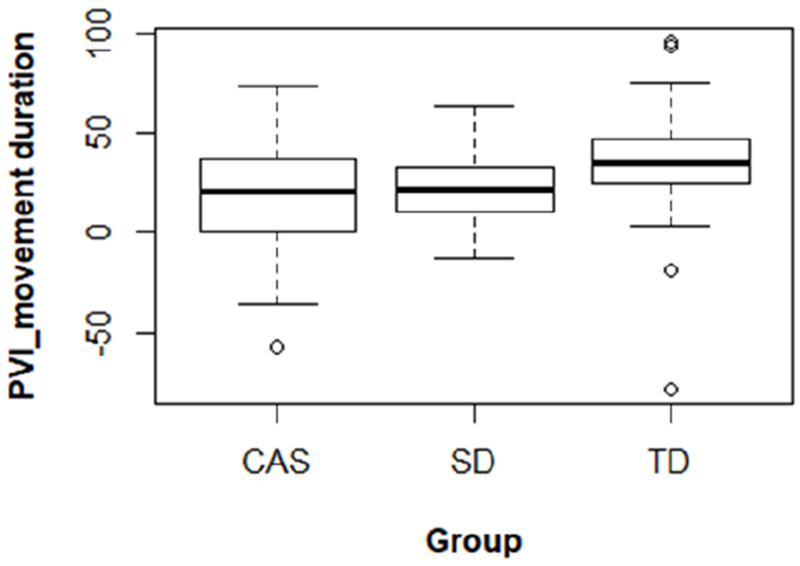
Boxplots of pairwise variability indices for movement duration by group. PVI = pairwise variability index; CAS = childhood apraxia of speech; SD = speech delay characterised by articulation/phonological impairment; TD = typical development.
In terms of movement displacement, we did not find evidence that spatial control for lexical stress production differs between children with CAS, SD, and TD. Across groups, PVIs for displacement indicated a pattern of larger jaw movements for V1 compared to V2, which is not surprising given the intrinsic differences in vowel height/jaw opening for puppy discussed previously. The relevant finding is that the groups showed similar degrees of stress contrastiveness. Similar to the displacement results in the present analysis, Goffman (1999) reported that four- to six-year-old TD children and those with SLI and concomitant speech deficits did not differ in their degree of amplitude modulation in SW forms (e.g. (/ˈpʌ.pәp/); however, in that study, neither group modulated these forms using displacement, which was attributed to a rhythmic bias of the motor system. Although the participants in the current study did demonstrate amplitude modulation in the analysed form puppy (i.e. larger jaw excursion for V1 compared to V2), this is likely related to a stimulus effect, namely, intrinsic differences in the vowels /ʌ/ and /i/. Interestingly, Goffman (1999) found group differences for WS forms, as children with SLI did not produce as large of a contrast in movement amplitude between unstressed and stressed syllables as the TD children. Future kinematic studies of lexical stress in CAS should investigate the production SW forms with more equivalent vowels and the production of WS forms to explore Goffman’s (1999) findings in this population.
Relationship Between Acoustic and Kinematic Findings
Overall, the results of this study illustrate differences in movement timing between children with CAS and those with typical speech development during the production of lexical stress, in the absence of acoustic differences between these groups. The closure duration of the consonants in the analysed form puppy may underlie differences between the acoustic and kinematic findings. The measures of lexical stress in this study focused on vowels and the opening/closing gestures associated with them. Therefore, periods of consonantal closure (i.e. complete occlusion) were not targeted for acoustic or kinematic measurement. However, since movement duration was measured from points of maximum jaw closure, the stop closure interval was also captured. For instance, the measure of opening into the vowel included any potential period between maximal jaw closure and the actual release of the oral constriction as achieved by the jaw and/or lips. Similarly, the measure of closing into the following consonant included any potential period between the onset of oral closure as achieved by the jaw and/or lips and maximal jaw closure. The finding that the TD group displayed a significantly larger durational contrast than the CAS group only when measured across the full articulatory sequence – when no significant group differences were seen for acoustic duration as measured from consonantal release – points to a possible influence of stop closure duration. This possibility is particularly relevant since stop closure duration has been found to vary as a function of stress. For instance, Stathopoulos and Weismer (1983) found longer closure periods for stressed compared to unstressed stops in initial and medial word positions. Therefore, perhaps the modification of this consonantal cue to stress contributed to the larger durational contrast displayed by the TD children. This speculation should be explored further in future studies. While stop closure duration is measurable from the acoustic signal, we were unable to measure this for initial stops in the present study since the words were elicited in isolation.
Limitations and Future Directions
This study was retrospective in nature since we conducted lexical stress analyses on data that had been previously collected as part of a larger study (Grigos et al., 2015). A future, prospective study would allow greater control over the design of the stimuli and the experimental conditions. Across groups and dependent measures, negative PVIs were occasionally observed for individual, trial-level responses. Recall that negative PVIs indicate larger values of the measured parameter (e.g. duration, F0) for the second syllable compared to the first, which was not the expected pattern for the SW form analysed in this study, puppy. Since productions were elicited using a multisyllabic stimulus (as in Ballard et al., 2012) and analyses were limited to productions that were perceived to have correct stress, the occurrence of negative PVIs may relate more to the intrinsic characteristics of the vowels in puppy rather than suprasegmental effects such as final lengthening or stress. For instance, V1 (/ʌ/) and V2 (/i/) differ along at least two dimensions, vowel tension and height, that have been associated with duration and F0, respectively (Small, 1999; Whalen & Levitt, 1995). The vowel /ʌ/ is lax and low-mid in height, whereas /i/ is typically classified as tense and high, which may explain why children sometimes produced an unexpected duration pattern (i.e. longer V2 than V1) and/or F0 pattern (i.e. higher F0 for V2 compared to V1) in perceptually accurate productions of the SW target. In light of this stimulus consideration, along with factors such as small sample size and a limited number of accurate/appropriate productions available for analysis, the results of this study should be confirmed in a prospective research study with (a) larger groups of participants, and (b) a wider variety of stimulus items. If future work continues to find differences in the degree of lexical stress contrasts between children with and without CAS, it will be important to explore the specific factors that may contribute to this (i.e. is a smaller degree of contrast due to reduced stress on the stressed syllable or to excess stress on the unstressed syllable?). Finally, future studies should also directly explore a potential contribution of stop closure duration to the present study’s findings.
Conclusion
The purpose of this study was to examine whether acoustic and/or articulatory correlates of stress differentiate children with CAS from those with SD and TD. Children with CAS were found to produce a smaller durational contrast between stressed and unstressed syllables in perceptually accurate productions compared to children with TD. This difference was only revealed through kinematic measures of jaw movement duration that may have included portions of consonantal closure and not through acoustic measures of vowels as measured from consonantal release. Our results suggest difficulty controlling temporal aspects of speech movements as a possible basis for lexical stress errors which are prevalent in CAS and should continue to be explored in future studies.
Acknowledgments
The authors acknowledge Julie Case, Panagiota Keough, Penelope Elias, and Jessica Storer for assistance with data collection and processing. Portions of this work were presented at the 2013 American Speech-Language-Hearing Association Convention in Chicago, Illinois and the 2014 Conference on Motor Speech in Sarasota, Florida.
Declaration of Interest
This research was supported by National Institute on Deafness and Other Communicative Disorders Grant R03DC009079 awarded to Maria Grigos.
References
- American Speech, Language, Hearing Association. (2007). Childhood Apraxia of Speech [Technical Report]. Available from www.ASHA.org/policy.
- Bahr RH (2005). Differential diagnosis of severe speech disorders using speech gestures. Topics in Language Disorders, 25, 254–265. [Google Scholar]
- Ballard KJ, Djaja D, Arciuli J, James DGH, & van Doorn J (2012). Developmental trajectory for production of prosody: Lexical stress contrastivity in children ages 3 to 7 years and in adults. Journal of Speech, Language, Hearing Research, 55, 1822–1835. [DOI] [PubMed] [Google Scholar]
- Ballard KJ, Robin DA, McCabe P, & McDonald J (2010). A treatment for dysprosody in childhood apraxia of speech. Journal of Speech, Language, Hearing Research, 53, 1227–1245. [DOI] [PubMed] [Google Scholar]
- Bates D, Maechler M, Bolker B, & Walker S (2015). Fitting linear mixed effects models using lme4. Journal of Statistical Software, 67, 1–48. [Google Scholar]
- Boersma P, & Weenink D (2011). Pratt 5.3.03 [Computer Software]. Amsterdam: Institute of Phonetic Sciences. [Google Scholar]
- Burgmeister B, Blum L, & Lorge I (1972). Columbia Mental Maturity Scale. San Antonio, TX: The Psychological Corporation. [Google Scholar]
- Davis BL, Jakielski KJ, & Marquardt TP (1998). Developmental apraxia of speech: Determiners of differential diagnosis. Clinical Linguistics & Phonetics, 12(1), 25–45. [Google Scholar]
- de Jong KJ (1995). The supraglottal articulation of prominence in English: Linguistic stress as localized hyperarticulation. Journal of the Acoustical Society of America, 97(1), 491–504. [DOI] [PubMed] [Google Scholar]
- Edwards E, Beckman ME, & Fletcher J (1991). The articulatory kinematics of final lengthening. Journal of the Acoustical Society of America, 89(1), 369–382. [DOI] [PubMed] [Google Scholar]
- Fry DB (1958). Experiments in the perception of stress. Language and Speech, 1, 126–152. [Google Scholar]
- Fry DB (1964). The dependence of stress judgements on vowel formant structure. Paper presented at the 5th International Congress of Phonetic Sciences, Munster. [Google Scholar]
- Goffman L (1999). Prosodic influences on speech production in children with specific language impairment and speech deficits: Kinematic, acoustic, and transcription evidence. Journal of Speech, Language, and Hearing Research, 42, 1499–1517. [DOI] [PubMed] [Google Scholar]
- Goffman L, & Malin C (1999). Metrical effects on speech movements in children and adults. Journal of Speech, Language, and Hearing Research, 42, 1003–1015. [DOI] [PubMed] [Google Scholar]
- Goldman R, & Fristoe M (2000). Goldman-Fristoe Test of Articulation – 2. Circle Pines, MN: American Guidance Services, Inc. [Google Scholar]
- Green JR, Wilson EM, Wang Y, & Moore CA (2007). Estimating mandibular motion based on chin surface targets during speech. Journal of Speech, Language, and Hearing Research, 50, 928–939. [DOI] [PMC free article] [PubMed] [Google Scholar]
- Grigos MI, Moss A, & Lu Y (2015). Oral articulatory control in childhood apraxia of speech. Journal of Speech, Language, and Hearing Research, 58, 1103–1118. [DOI] [PMC free article] [PubMed] [Google Scholar]
- Grigos MI, & Patel R (2010). Acquisition of articulatory control for sentential focus in children. Journal of Phonetics, 38, 706–715. [Google Scholar]
- Hall PK, Jordan LS, & Robin DA (1993). Developmental apraxia of speech: Theory and clinical practice. Austin, TX: Pro-Ed. [Google Scholar]
- Hayden DA, & Square PA (1999). VMPAC: Verbal Motor Production Assessment for Children. San Antonio, TX: Psychological Association. [Google Scholar]
- Hayes B (1995). Metrical stress theory: Principles and case studies. Chicago, IL: The University of Chicago Press. [Google Scholar]
- Hodson BW, & Paden EP (1981). Phonological processes which characterize intelligble and unintelligible speech in early childhood. Journal of Speech and Hearing Disorders, 46, 369–373. [Google Scholar]
- Howell P (1993). Cue trading in the production and perception of vowel stress. Journal of the Acoustical Society of America, 94(4), 2063–2073. [DOI] [PubMed] [Google Scholar]
- Hresko W, Reid D, & Hammill D (2007). Test of Early Language Development. Austin, TX: Pearson Assessment. [Google Scholar]
- Jacewicz E, Fox RA, & Salmons J (2011). Regional dialect variation in the vowel systems of typically developing children. Journal of Speech, Language, and Hearing Research, 54, 448–470. [DOI] [PMC free article] [PubMed] [Google Scholar]
- Kehoe M, Stoel-Gammon C, & Buder EH (1995). Acoustic correlates of stress in young children’s speech. Journal of Speech and Hearing Research, 38, 338–350. [DOI] [PubMed] [Google Scholar]
- Kelso JAS, Vatikiotis-Bateson E, Saltzman EL, & Kay B (1985). A qualitative dynamic analysis of reiterant speech production: Phase portraits, kinematics, and dynamic modeling. Journal of the Acoustical Society of America, 77(1), 266–280. [DOI] [PubMed] [Google Scholar]
- Kent RD, & Netsell R (1971). Effects of stress contrasts on certain articulatory parameters. Phonetica, 24, 23–44. [DOI] [PubMed] [Google Scholar]
- Kuznetsova A, Brockhoff PB, & Christensen RHB (2017). lmerTest Package: Tests in linear mixed effects models. Journal of Statistical Software, 82, 1–26. [Google Scholar]
- Levi SV (2005). Acoustic correlates of lexical accent in Turkish. Journal of the International Phonetic Association, 35(1), 73–97. [Google Scholar]
- Liberman P (1960). Some acoustic correlates of word stress in American English. The Journal of the Acoustical Society of America, 32(4), 451–454. [Google Scholar]
- Low EL, Grabe E, & Nolan F (2000). Quantitative characterizations of speech rhythm: Syllable-timing in Singapore English. Language and Speech, 43(4), 377–401. [DOI] [PubMed] [Google Scholar]
- MathWorks. (2007). MATLAB Version 7.2 [Computer software]. Natick, MA: Author. [Google Scholar]
- Munson B, Bjorum EM, & Windsor J (2003). Acoustic and perceptual correlates of stress in nonwords produced by children with suspected developmental apraxia of speech and children with phonological disorder. Journal of Speech, Language, and Hearing Research, 46, 189–202. [DOI] [PubMed] [Google Scholar]
- Nijland L, Maassen B, van der Meulen S, Gabreels F, Kraaimaat FW, & Schreuder R (2003). Planning of syllables in children with developmental apraxia of speech. Clinical Linguistics and Phonetics, 17(1), 1–24. [DOI] [PubMed] [Google Scholar]
- Odell KH, & Shriberg LD (2001). Prosody-voice characteristics of children and adults with apraxia of speech. Clinical Linguistics & Phonetics, 15(4), 275–307. [Google Scholar]
- Peterson GE, & Lehiste I (1960). Duration of syllable nuclei in English. The Journal of the Acoustical Society of America, 32(6), 693–703. [Google Scholar]
- R Core Team (2018). R: A Language and Environment for Statistical Computing R Foundation for Statistical Computing, Vienna, Austria. [Google Scholar]
- Rosenbek JC, & Wertz RT (1972). A review of fifty cases of developmental apraxia of speech. Language, Speech, and Hearing Services in the Schools, 3, 23–33. [Google Scholar]
- Schmitt LS, Howard BH, & Schmitt JF (1983). Conversational speech sampling in the assessment of articulation proficiency. Language, Speech, and Hearing Services in Schools, 14, 210–214. [Google Scholar]
- Shriberg LD, Aram DM, & Kwiatkowski J (1997a). Developmental apraxia of speech: II. Toward a diagnostic marker. Journal of Speech, Language, and Hearing Research, 40, 286–312. [DOI] [PubMed] [Google Scholar]
- Shriberg LD, Aram DM, & Kwiatkowski J (1997b). Developmental apraxia of speech III: A subtype marked by inappropriate stress. Journal of Speech, Language, and Hearing Research, 40, 313–337. [DOI] [PubMed] [Google Scholar]
- Shriberg LD, Campbell TF, Karlsson HB, Brown RL, McSweeny JL, & Nadler CJ (2003). A diagnostic marker for childhood apraxia of speech: The lexical stress ratio. Clinical Linguistics & Phonetics, 17(7), 549–574. [DOI] [PubMed] [Google Scholar]
- Shriberg LD, Strand EA, Fourakis M, Jakielski KJ, Hall SD, Karlsson HB,…Wilson DL (2017). A diagnostic marker to discriminate childhood apraxia of speech from speech delay: I. Development and description of the pause marker. Journal of Speech, Language, and Hearing Research, 60, S1096–S1117. [DOI] [PMC free article] [PubMed] [Google Scholar]
- Skinder A, Strand EA, & Mignerey M (1999). Perceptual and acoustic analysis of lexical and sentential stress in children with developmental apraxia of speech. Journal of Medical Speech-Language Pathology, 7(2), 133–144. [Google Scholar]
- Small LH (1999). Fundamentals of phonetics: A practical guide for students. Needham Heights, MA: Allyn & Bacon. [Google Scholar]
- Smit AB, Hand L, Freilinger JJ, Bernthal JE, & Bird A (1990). The Iowa articulation norms project and its Nebraska replication. Journal of Speech & Hearing Disorders, 55(4), 779–798. [DOI] [PubMed] [Google Scholar]
- Smith A, Sadagopan N, Walsh B, & Weber-Fox C (2010). Increasing phonological complexity reveals heightened instability in inter-articulatory coordination in adults who stutter. Journal of Fluency Disorders, 35(1), 1–18. [DOI] [PMC free article] [PubMed] [Google Scholar]
- Stathopoulos ET, & Weismer G (1983). Closure duration of stop consonants. Journal of Phonetics, 11, 395–400. [Google Scholar]
- Turk A, Nakai S, & Sugahara M (2006). Acoustic segment durations in prosodic research: A practical guide In Sudhoff S, Lenertová D, Meyer R, Pappert S, Augurzky P, Mleinek I, Richter N & Schlieβer J (Eds.), Methods in empirical prosody research (pp. 1–28). Berlin: Mouton de Gruyter. [Google Scholar]
- Velleman SL, & Shriberg LD (1999). Metrical analysis of the speech of children with suspected developmental apraxia of speech. Journal of Speech, Language, and Hearing Research, 42, 1444–1460. [DOI] [PubMed] [Google Scholar]
- Velleman SL, & Strand K (1994). Developmental verbal dyspraxia In Bernthal JE & Bankson NW (Eds.), Child phonology: Characteristics, assessment, and intervention with special populations (pp. 110–139). New York: Thieme Medical. [Google Scholar]
- Vicon Motion Systems. (2001). Vicon 460 [Computer software]. Los Angeles, CA: Author. [Google Scholar]
- Whalen DH, & Levitt AG (1995). The universality of intrinsic F0 of vowels. Journal of Phonetics, 23, 349–366. [Google Scholar]
- Winter B (2013). Linear models and linear mixed effects models in R with linguistic applications. arXiv:1308.5499. [http://arxiv.org/pdf/1308.5499.pdf]
- Yoss KA, & Darley FL (1974). Developmental apraxia of speech in children with defective articulation. Journal of Speech and Hearing Research, 17, 399–416. [DOI] [PubMed] [Google Scholar]