Abstract
The study of exosomes has become increasingly popular due to their potentially important biological roles. Urine can be used as an effective source of exosomes for noninvasive investigations into the pathophysiological states of the genitourinary tract, but first, detailed characterization of exosomal components in healthy individuals is essential. Here, we significantly extend the number of N-glycan compositions, including sulfated species, identified from urinary exosomes and determine the sialic acid linkages for many of those compositions. Capillary electrophoresis-mass spectrometry (CE-MS), matrix-assisted laser desorption/ionization mass spectrometry (MALDI-MS), and capillary liquid chromatography-tandem mass spectrometry (LC-MS/MS) were used to identify N-glycan and sulfated N-glycan compositions. Second, because the alteration of sialylation patterns has been previously implicated in various disease states, ion-exchange chromatography, microfluidic capillary electrophoresis (CE), and MALDI-MS were adopted to resolve positional isomers of sialic acids. Structures of the sialyl-linkage isomers were assigned indirectly through α2–3 sialidase treatment and sialic acid linkage-specific alkylamidation (SALSA). In total, we have identified 219 N-glycan structures that include 175 compositions, 64 sialic acid linkage isomers, 26 structural isomers, and 27 sulfated glycans.
Keywords: microfluidic capillary electrophoresis, capillary electrophoresis-mass spectrometry, liquid chromatography-mass spectrometry, human urinary exosomes, glycomics, sialyl-linkage isomers
Graphical Abstract
The analysis of exosomes is a rapidly expanding field with some importance to cancer diagnosis and therapy, as exosomes could be a promising source of potential disease biomarkers.1–2 Exosomes are small vesicles (typically 30–100 nm) released by cells through fusion of the multivesicular body with the plasma membrane.3–4 Released exosomes can be found in the extracellular space and circulating body fluids. With mRNA, miRNA, and proteins enclosed, released exosomes can transfer information and materials originating from their parent cells to various body sites, as well as modulate intercellular communication and dispose of cellular waste products.5–6
For tumor cells, the exosome biogenesis appears enhanced.7 Through reaching both adjacent and distant body sites,8 cancer-derived exosomes may promote the development of cancer by supporting tumor proliferation, invasion, and angiogenesis and by suppressing the immune system.9 As the contents enclosed in exosomes resemble their parent cells, signaling and metabolic alterations of tumor cells can be monitored through analysis of cancer-derived exosomes.10 Consequently, the pathological development and pharmacological response of cancer patients can potentially be interpreted by analyzing the exosomes in various body fluids.5 Among these body fluids, urine is readily available in large volumes, and its collection is non-invasive for patients. Particularly, the molecular analysis of urinary exosomes can potentially help identify biomarkers of the urinary system diseases, such as bladder cancer and prostate cancer. So far, mRNA and proteins derived from urinary exosomes have been extensively studied,11–14 but only a few studies have been directed toward the glycomic information on proteins derived from urinary exosomes.15–17 Consequently, the need to characterize the exosomal glycomes in structural terms is obvious, and here, we provide a thorough characterization of N-glycans provided by state-of-the art analytical techniques.
As a crucial post-translational modification, glycosylation plays a vital role in a broad range of biological processes, including protein function, cell metabolism, and host-pathogen interactions.18 Various types of cancer alter the expression of glycosyltransferases, tertiary conformation of peptides, and availability of sugar nucleotide donors and cofactors; consequently, aberrant glycosylation patterns have been widely observed.19 For instance, the overexpression of β1,6-branched N-glycans, core-fucosylated N-glycans, sialyl Lewis X/A structures, and sialylated structures have been observed in the glycoproteins of cancer cells.19–21 Additionally, aberrant glycosylation patterns have been proposed to be associated with tumor proliferation, invasion, altered metastasis, and angiogenesis.21 Therefore, the onset and progression of cancer can be reflected by altered glycosylation patterns, and glycomic profiling can potentially lead to identification of cancer biomarkers.22 However, the universal existence of isomeric monosaccharides, branched structures, linkage isomers, positional isomers, and various other modifications of glycans, e.g., sulfation, contribute to the enormous structural diversity of glycans, making a comprehensive structural identification of glycans extremely challenging.
To provide structurally extensive information, complementary glycan profiling techniques have been incorporated here to identify and profile N-glycans derived from the glycoproteins of human urinary exosomes (see Table 1). Ion-exchange chromatography16 fractionated N-glycans based on their charge states and simplified the structural identification steps. Capillary electrophoresis-mass spectrometry (CE-MS) separated and identified the N-glycans fractions of human urinary exosomes with high separation efficiency and detection sensitivity. Liquid chromatography-mass spectrometry (LC-MS) analysis confirmed N-glycan compositions, and tandem mass spectrometry (MS/MS) provided more detailed structural information on the identified N-glycan compositions, whenever feasible.
Table 1.
Methods used to analyze N-glycans derived from urinary exosomes and total numbers of N-glycan compositions, isomers, and structures identified by each method and in combination.
| Analytical Method | Fractionation Method | Neutralization Method | Labeling Reagent | Total Compositions | Sulfated N-glycans | Structural Isomers | Sialic Acid Isomers | Total Structures |
|---|---|---|---|---|---|---|---|---|
| CE-MS | Ion exchange | Methylamidation | GT | 146 | -- | -- | -- | 146 |
| MALDI-MS | Ion exchange | Methylamidation | -- | 68 | 20 | -- | 64 | 98 |
| SALSA | ||||||||
| LC-MS | Ion exchange | Reduction | -- | 73 | 14 | 26 | -- | 88 |
| Reduction + methylamidation | ||||||||
| C18 | Reduction + permethylation | |||||||
| Microfluidic CE | Ion exchange | Methylamidation | APTS | 17 | -- | -- | 20 | 23 |
| SALSA | ||||||||
| Combined Totals | 175 | 27 | 26 | 64 | 219 | |||
Even with this set of complementary techniques, the sialyl-linkage isomers, the alteration of which has been proposed in association with the development of cancer,17,23 cannot be easily resolved and subsequently identified. Consequently, we have adopted several strategies for the indirect structural assignment of the N-glycan profile, including fractionation and concentration with ion-exchange chromatography, digestion with exoglycosidases, derivatization by methylamidation and sialic acid linkage-specific alkylamidation (SALSA),24 and analysis by matrix-assisted laser desorption/ionization mass spectrometry (MALDI-MS). In particular, α2–3 sialidase digestion and SALSA derivatization identified sialic-acid linkage isomers, and these two approaches showed consistent results for the structural identification of sialylated structures. Sialyl linkages of major N-glycan compositions were then resolved and assigned to the N-glycomic profile of human urinary exosomes by microfluidic capillary electrophoresis (CE) with laser-induced fluorescence (LIF) detection.25
Experimental Section
The following sections are included in the Supporting Information: list of materials, LC-MS characterization of urinary exosomes, exosome size measurements by dynamic light scattering (DLS), total protein determination by bicinchoninic acid (BCA) assay, reduction and permethylation of N-glycans, extraction of permethylated sulfated N-glycans, fractionation of permethylated N-glycans through C-18 columns, digestion of N-glycans with sialidase and fucosidase, fabrication of microfluidic CE devices, poly(acrylamide) coating of microchannels, microfluidic CE analysis, MALDI-MS analysis, and LC-MS and MS/MS analysis.
Isolation of Exosomes from Human Urine.
Urinary exosomes were isolated through a multi-step differential centrifugation.16 To each 20 mL of commercial normal human urine (pooled gender, BioreclamationIVT) or urine from healthy male volunteers, 200 μL of 2% sodium azide and a half tablet of Protease Inhibitor Cocktail (PIC) were added. Urinary sediment was removed after centrifugation at 17,000 g for 60 min. The pellet was re-dissolved in 500 μL of isolation solution (10 mM triethanolamine, 250 mM sucrose, 0.02% NaN3, and 100 mg dithiothreitol at pH 7.6) and centrifuged at 14,000 g for 7 min. Supernatants from the two centrifugation steps were combined and ultracentrifuged at 200,000 g for 2 h. Subsequently, the pellet was re-dissolved in 20 mL of phosphate buffered saline (PBS) containing 0.02% sodium azide and ultracentrifuged again at 200,000 g for 2 h. For DLS characterization, the pellet was reconstituted in 3 mL of PBS buffer. For the BCA assay and glycomic analysis, the pellet was dissolved in 300 μL of 50 mM phosphate buffer containing 0.2% SDS and incubated at 60 °C for 10 min.
Release of N-Glycans through Peptide-N-Glycosidase F (PNGase F) Digestion.
N-Glycans were released from proteins through enzymatic digestion.26 Glycoproteins were denatured through the addition of 0.1% SDS and 0.2% 2-mercaptoethanol and incubated at 60 °C for 1 h. NP-40 was subsequently added to encapsulate SDS into the detergent micelles. To release N-glycans, denatured glycoproteins were incubated with PNGase F for 18 h at 37 °C. The released N-glycans were then purified by solid-phase extraction on activated charcoal columns.27
Fractionation of Intact N-Glycans by Ion-Exchange Chromatography.
Reduced or reducing native N-glycans released by PNGase F digestion were fractionated through Oasis MAX extraction cartridges.16 Cartridges were pre-conditioned sequentially with 1 mL of 95% acetonitrile, 2 mL of 100 mM sodium acetate, 6 mL of H2O, and 6 mL of 95% acetonitrile. The intact glycans derived from 50–100 μL of urinary exosomes were dissolved in 3 mL of 95% acetonitrile and loaded onto the cartridges by gravity. To maximize sample loading onto the cartridges, the loading step was performed three times before elution. Then, N-glycans loaded onto the cartridges were eluted stepwise with 5 mL of 50% acetonitrile and 3 mL of 10, 20, 50, and 100 mM sodium acetate to fractionate glycans on the basis of their charge states. The eluents were then desalted through active charcoal columns.
Methylamidation of Sialic Acids.
Sialic acids of glycans were neutralized and stabilized through methylamidation.25 Carboxyl groups of sialic acids were activated by adding 5 μL of 100 mM PyAOP in DMSO. A 5 μL aliquot of 1 M 4-methylmorpholine and 2 M methylamine hydrochloride in DMSO was added to the sample to produce basic conditions and methylamidate the carboxyl groups. The reaction proceeded at room temperature for 2–8 h and was subsequently quenched by adding 240 μL of 85% acetonitrile. Neutralized glycans were then purified through solid-phase extraction on amino columns.25
Sialic Acid Linkage Specific Alkylamidation (SALSA).
SALSA is a sequential two-step alkylamidation reaction to neutralize charge on sialic acids and differentiate their linkage isomers.24 First, fractionated native glycans were incubated with 20 μL of the first alkylamidation solution, containing 2 M isopropylamine hydrochloride (iPA-HCl), 0.5 M hydroxybenzotriazole (HOBt), and 0.5 M 1-ethyl-3-(3-dimethylaminopropyl)carbodiimide hydrochloride (EDC-HCl) in DMSO. This isopropylamidation step proceeded at room temperature for 1 h, and the products were purified through solid-phase extraction on amino columns. To the eluent, a methylamine solution was added to a final concentration of 1% (v/v), and the eluent was dried in a Centrivap concentrator. The dried products were then methylamidated in a second alkylamidation step, similar to the methylamidation reaction.
Labeling of N-Glycans with 8-Aminopyrine-1,3,6-trisulfonic Acid (APTS).
For microfluidic CE, the alkylamidated glycans were subsequently labeled with APTS to impart a −3 charge for electrophoretic separation and a fluorophore for laser-induced fluorescence detection.28 To each neutralized N-glycan sample, 1 μL of 0.9 M APTS and 1 μL of 1 M NaBH3CN were added. The labeling reactions proceeded at 55 °C for 2–6 h. Afterward, free APTS was removed through overnight dialysis, and the APTS-labeled glycans were dried with a Centrivap concentrator.
Labeling of N-Glycans with Girard’s Reagent T (GT).
For CE-MS, the alkylamidated glycans were then labeled with GT to impart a +1 charge for electrophoretic separation and MS analysis in positive ion mode. Neutralized glycan samples were reconstituted in 25 μL of 0.02 M Girard’s reagent T in 10% acetic acid. Samples were then incubated at 55 °C for 4 h and dried with a Centrivap concentrator.
Capillary Electrophoresis-Mass Spectrometry (CE-MS).
On a CESI 8000 instrument (SCIEX Separations, Framingham, MA), a neutral capillary cartridge (30 μm i.d. × 90 cm length; Opti-MS, B07368, SCIEX Separations) was pre-conditioned sequentially with 0.1 M HCl, water, and 10% acetic acid (v/v) as the background electrolyte (BGE) for 10 min each at 100 psi. The conductive side capillary was pre-conditioned with water and BGE for 5 min each at 100 psi. The separation capillary was electrically conditioned with a separation voltage of 30 kV and applied pressure of 10 psi.
N-Glycan fractions labeled with Girard’s Reagent T (GT), which were derived from a 50 μL aliquot of urinary exosomes, were dissolved in 10 μL of 5% BGE. Sample was injected into the capillary hydrostatically at 1 psi for 25 s, followed by the electrophoretic separation with an applied potential of 25 kV. For delayed-flow operation, a pressure of 2 psi was applied to the capillary 40 min after the electrophoretic separation was initiated. An adapter kit connected the capillary to the nanospray source of an LTQ Orbitrap mass spectrometer (Thermo Fisher, Waltham, MA). A 1-kV potential was applied through the Xcalibur software (Version 2.2, Thermo Fisher) to generate a stable electrospray. Positive ions ranging from 100–2000 m/z were collected and analyzed by the FTMS analyzer. Extracted ion electropherograms (EIEs) for individual m/z values (± 0.1 Da) were boxcar-averaged (7 points), exported, and plotted in OriginPro 2018. The ten structures with the lowest m/z ratio were detected with a mass accuracy of 50–80 ppm due, in part, to their small mass-to-charge ratios. All the other structures were detected with a mass accuracy < 50 ppm with 65 of those structures detected with a mass accuracy < 20 ppm.
Results
Isolation of N-Glycans Derived from Urinary Exosomes.
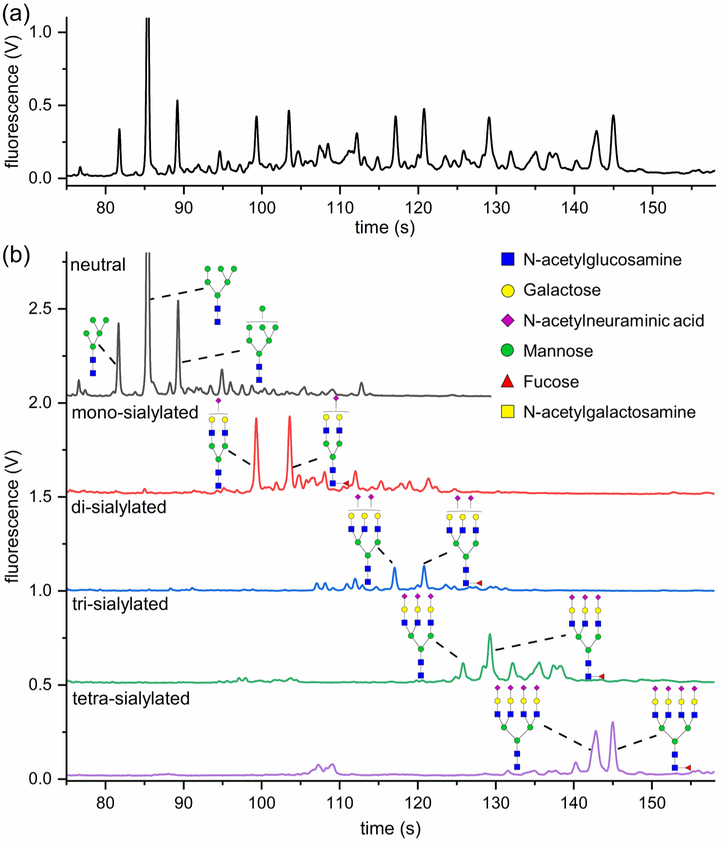
Following centrifugal isolation, exosome samples were analyzed by dynamic light scattering (DLS), and their diameters ranged from 30–100 nm with aggregated species having an average diameter of ~200 nm (Figure S1). The isolated exosomes yielded a total protein concentration of 1.5 μg/μL as measured by the bicinchoninic acid (BCA) assay. Therefore, ~450 μg of exosomal proteins were isolated from 20 mL of human urine. To confirm the presence of N-glycans derived from glycoproteins in these exosomes, samples were treated with PNGase F, neutralized by methylamidation, labeled with 8-aminopyrene-1,3,6-trisulfonic acid (APTS), and analyzed on a microfluidic CE device (Figure S2). The electropherograms showed an abundance of well-resolved N-glycans (Figure 1a), especially tetra-antennary structures. Additionally, the enzymatically cleaved N-glycans were methylamidated, and their compositions were profiled through MALDI-MS analysis (Figure S3). The MALDI-MS spectrum was in good agreement with our previously published N-glycan profile of healthy male volunteers.16
Figure 1.
(a) Electropherogram of N-glycans released from human urinary exosomes, methylamidated, labeled with APTS, and separated by microfluidic CE with LIF detection. Large tetra-antennary N-glycan compositions were detected with migration times >135 s and were quite abundant. (b) N-Glycans released from urinary exosomes were fractionated on the basis of their charge states by ion-exchange chromatography, methylamidated, labeled with APTS, and separated by microfluidic CE. Structures were assigned to the electropherograms by correlating migration time and peak area with mass and relative abundance of glycans detected by MALDI-MS.
Fractionation of Released Native N-Glycans.
To further characterize the N-glycan composition, the N-glycans released from exosomes were fractionated by ion-exchange chromatography,16 which simplifies subsequent structural identification. Here, released native N-glycans were preconcentrated and fractionated by ion-exchange chromatography on the basis of their charge states and, subsequently, neutralized by methylamidation, labeled with APTS, and analyzed by microfluidic CE (Figure 1b). For N-glycans released from human urinary exosomes, the charge state primarily represents the number of sialic acid residues, which is the only charged monosaccharide in human N-glycans. Moreover, phosphorylation and sulfation of glycans can generate extra charge(s), and some sulfated glycans have been detected in urinary exosomes16 and are further characterized below.
To confirm the fractionation of N-glycans is based on the number of sialic acids, the methylamidated N-glycan fractions were analyzed by MALDI-MS (Figure S4), and the majority of N-glycans were detected in the fractions corresponding to their degree of sialylation. Some N-glycan structures with fewer sialic acids were observed in tri-sialylated and tetra-sialylated fractions. The existence of those structures may be due to an incomplete fractionation by ion-exchange chromatography, or less likely, a loss of labile sialic acid groups during the sample preparation process.
By comparing the relative intensity and m/z ratios of the structures in Figure S4 with the areas and migration times of peaks in the electropherogram (Figure 1b), a few N-glycan peaks in Figure 1b could be assigned by their corresponding N-glycan structures. For instance, in the mono-sialylated fraction, two major N-glycan compositions were detected (Figure S4b) and assigned to one bi-antennary structure and its fucosylated counterpart. Therefore, in the electropherogram (Figure 1b), the two intense peaks were assigned to these two bi-antennary structures. Additionally, the full N-glycan profile can be reconstructed by combining the profiles of the corresponding fractions together. However, due to a possible sample loss during fractionation, the relative peak intensities among fractions were slightly different from that of the full profile.
Structural Identification with CE-MS and LC-MS.
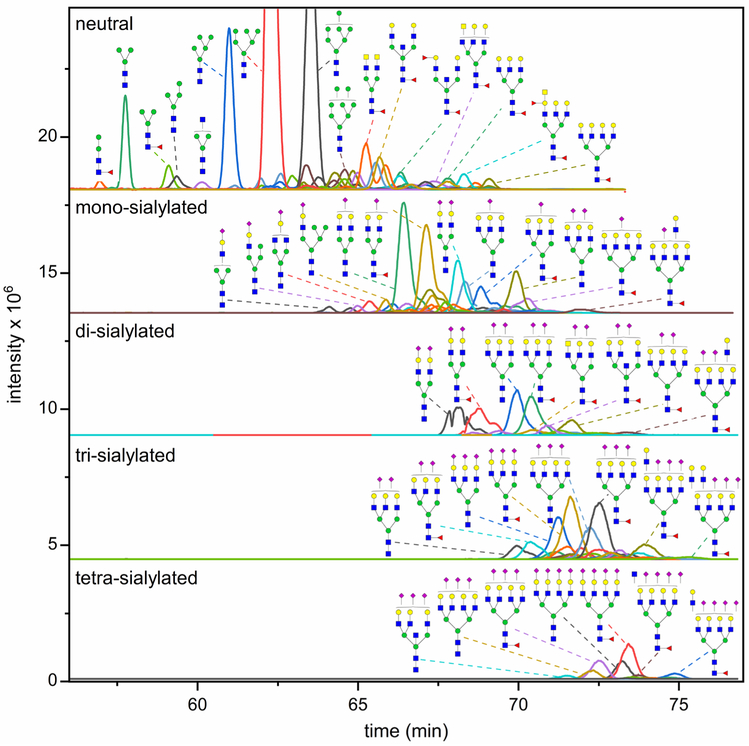
All N-glycan fractions were analyzed by CE-MS to identify N-glycan compositions. Fractionated and methylamidated N-glycans were labeled with Girard’s reagent T (GT) to add a single positive charge for the electrophoretic separation and enhance the ionization efficiency of N-glycans in the CE-MS analysis. Through CE-MS, 145 N-glycan compositions were identified (Tables S1), among which, 25 N-glycan compositions were potentially tetra- or penta-sialylated structures. Furthermore, the resulting extracted ion electropherograms (Figure 2) and corresponding structural assignments of N-glycan fractions were consistent with the electropherograms generated by microfluidic CE (Figure 1b).
Figure 2.
Extracted ion electropherograms (EIEs) of N-glycans fractionated by ion exchange, methylamidated, labeled with GT, and analyzed by CE-MS. A 40-min delayed flow was used to increase the separation efficiency for the derivatized glycans. Intense peaks are annotated by corresponding potential structures. A few N-glycan compositions showed multiple peaks, such as the (Hex)2(HexNAc)2(NeuAc)2 + (Man)3(GlcNAc)2 in the di-sialylated fraction, indicating a successful separation of some isomers with CE-MS.
Subsequently, reduced native N-glycan were fractioned by ion exchange chromatography, and a portion of those fractions were methylamidated. After the methylamidation step, the samples were purified on a HILIC column, which did not retain sulfated N-glycans. Reduced permethylated N-glycans were fractionated with a C-18 column.16 Reduced native, reduced methylamidated, and reduced permethylated N-glycans were then analyzed by LC-MS to confirm the presence of identified N-glycans. As listed in Tables 2, S1, and S2, neutral, sialylated, and sulfated N-glycans were indeed detected, with some N-glycan structures confirmed through MS/MS analysis. Particularly, N-glycans carrying a bisecting GlcNAc (Figure S5) and the sulfate modification of some N-glycans (Table 2) were confirmed.
Table 2.
Sulfated N-glycan structures derived from glycoproteins of urinary exosomes and detected by either MALDI-MS or LC-MS. Sulfated N-glycans were collected from the aqueous phase of permethylated N-glycans and analyzed with MALDI-MS in the positive ion mode with DHB as a matrix. In addition, reduced native N-glycans fractionated by ion exchange were analyzed with PGC-LC-MS, and some sulfated N-glycans were unequivocally confirmed through MS/MS. H = hexose, N = N-acetylhexosamine, F = deoxyhexose, S = sialic acid, and Su = sulfate group.
| observed m/z MALDI-MS | theoretical m/z MALDI-MS | observed m/z LC-MS | theoretical m/z LC-MS | possible composition | diagnostic fragment ions LC-MS | tentative structure |
|---|---|---|---|---|---|---|
| 1939.7462 (2Na+-H+) | 1939.8793 | 773.3 (949.15*) | 773.3 (948.46*) | H3N4F1Su1 | 486.7, 1059.3, 1342.4 |  |
| 2143.8398 (2Na+-H+) | 2143.9791 | H4N4F1S1Su1 |
 or 
|
|||
| 2173.8552 (2Na+-H+) | 2173.9897 | H5N4Su1 |
 or 
|
|||
| 2348.9128 (2Na+-H+) | 2348.0789 | H5N4F1Su1 |  |
|||
| 919.8 (2NH4+) |
902.3 | H5N4Su2 | 445.6, 565.7, 789.9, 1358.3 |  |
||
| 2348.9128 (2Na+-H+) | 2348.0789 | H5N4F1Su1 |  |
|||
| 2388.9534 (2Na+-H+) | 2389.1054 | 1172.41* | 1173.07* | H4N5F1Su1 | 1434.60, 1523.02, 1536.72 |  |
| 2436.0403 (3Na+−2H+) | 2436.0020 | 984.5 (NH4+) |
975.3 | H5N4F1Su2 | 445.6, 607.8, 854.1, 1342.2 |  |
| 2477.0867 (3Na+−2H+) | 2477.0285 | 1206.82* | 1206.05* | H4N5F1Su2 | 942.24, 1058.98, 1756.61 |  |
| 2517.8914 (3Na+−2H+) | 2518.0551 | H3N6F1Su2 |  |
|||
| 2629.2751 (2Na+-H+) | 2629.1358 | 1294.37* | 1293.09* | H4N5F2Su2 | 547.69, 778.89, 1059.85, 1655.25 |  |
| 1008.6 | 1007.8 | H5N4S1Su1 | 365.6, 445.6, 656.9, 1358.3, 1569.3 | |||
| 1029.2** | 1028.4 | H4N4S1Su1 | 486.6, 656.9, 1569.4, 1852.1 | |||
| 1029.0** | 486.7, 657.0, 882.6, 1569.3, | |||||
| 2711.1006 (3Na+−2H+) | 2711.1389 | 1094.5 (NH4+) |
1084.8 | H6N5Su2 | 445.6, 973.2, 1196.2, 1803.1 |  |
| 2728.2505 (Na+) | 2728.2971 | 1110.9** (NH4+) |
1101.4 | H4N4F1S1Su1 | 365.6, 656.9, 956.1 |  |
| 1110.8** (NH4+) |
365.6, 657.0, 955.9, 1545.3 | |||||
| 2670.2996 (3Na+−2H+) | 2670.1123 | H7N4Su2 |  |
|||
| 2670.2996 (3Na+−2H+) | 2670.1623 | H3N6F2Su2 |  |
|||
| 2758.2343 (Na+) | 2758.3077 | H5N5S1Su1 |  |
|||
| 2824.3269 (Na+) | 2824.2489 | H5N5S1Su2 |  |
|||
| 1191.5 | 1190.4 | H6N5S1Su1 | 365.5, 445.6, 657.0, 968.3, 2014.2 |  |
||
| 1130.7 | 1129.9 | H4N6S1Su1 | 656.9, 860.1, 1399.2, 2055.2 |  |
||
| 3166.3882 (Na+) |
3166.5072 | H7N5SlSul |  |
|||
| 3166.3882 (Na+) |
3166.3779 | H6N5S2Su2 | ||||
| 945.8 (NH4+, +3) |
939.7 (+3) | H5N6F1S2Su1 | 445.4, 657.0, 1080.7, 1186.7 |  |
||
| 3066.5334 (2Na+-H+) | 3066.4425 | H4N7S1Su1 |  |
|||
| 2880.3503 (Na+) | 2880.4714 | H4N6F3(Su) | 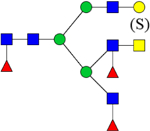 |
Sulfated N-glycans released through chloroform extraction after the permethylation step
Multiple peaks of the same possible composition were detected during chromatography
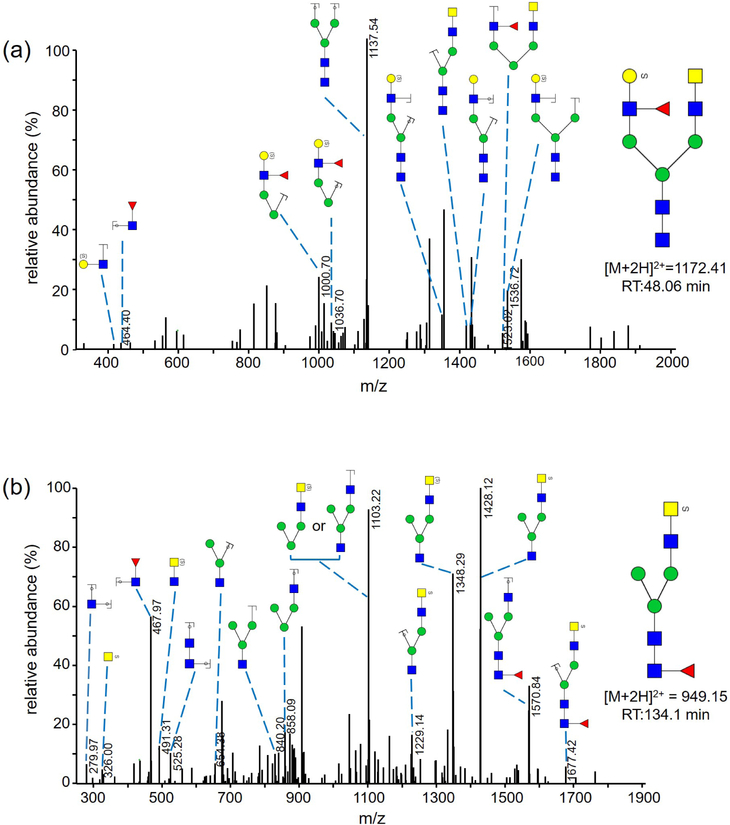
We previously reported sensitive and specific detection of charged, sulfated, permethylated N-glycans with MALDI-MS after sequential enrichment on ion-exchange columns.29–30 In this study, we employed a simpler and faster method adopted from Kumagai et al.31 to enrich sulfated, permethylated glycans in one step. After release and permethylation of the N-glycans, charged glycans were separated from uncharged glycans in a chloroform extraction step. Charged permethylated glycans, such as sulfated N-glycans, were extracted into the aqueous phase while uncharged glycans stayed in the chloroform phase during the extraction. Permethylated, sulfated glycans recovered from the aqueous phase were desalted on a C18 Micro SpinColumn prior to the analysis by MALDI-MS or LC-MS/MS (Figure 3) in positive-ion mode (Table 2). Twenty mono- and di-sulfated glycan compositions were detected by MALDI-MS, and their tentative structures are shown in Table 2. Four of these permethylated, sulfated N-glycan structures were detected by LC-MS/MS previously and confirmed with MS/MS in their reduced, non-methylamidated forms (Table 2).
Figure 3.
(a) MS/MS spectrum of a reduced and permethylated N-glycan with m/z 1172.41 [M+2H]2+. Diagnostic fragments of m/z 464.40 [HexNAc-dHex+H]+ and m/z 1536.72 [M+H – S-HexNAc-dHex]+ indicate the sulfate modification of the terminal Gal residue. (b) MS/MS spectrum of a reduced and permethylated N-glycan with m/z of 949.15. Diagnostic fragments of m/z 326.00 [S-HexNAc+H]+ and m/z 1570.84 [M+H – S-HexNAc]+ indicate the sulfate modification of the terminal GalNAc residue.
Overall, 175 N-glycan compositions, including 27 sulfated N-glycans, were detected in the urinary exosomes through CE-MS and LC-MS (Tables 2 and S1). Additionally, with the isomeric resolution through LC-MS with a graphitized carbon column, 26 N-glycan structural isomers were resolved and characterized by MS/MS analysis (Table S2). Table 1 summarizes the number of compositions, isomers, and structures detected by each method. Overlap of the data sets is excellent. Of the structures listed in Table S1, CE-MS analysis detected all compositions, except three observed with LC-MS analysis. The Orbitrap MS used for CE-MS had higher sensitivity than the ion trap used for LC-MS analysis; consequently, LC-MS analysis detected fewer compositions than CE-MS. For a similar reason, CE-MS detected all structures detected by MALDI-MS analysis, but not vice versa, due to the lower sensitivity of the MALDI-MS instrument.
Structural Assignment by Exoglycosidase Digestions.
To resolve sialyl-linkage isomers effectively, N-glycan fractions were separated by microfluidic CE with high isomeric resolution. However, even with the above compositional information on N-glycans, the structural assignment of peaks in Figure 1 still remained somewhat ambiguous. Therefore, exoglycosidase digestions and sialic-acid linkage specific alkylamidation (SALSA) were adopted for indirect structural assignment of the N-glycan profile.
Fractionated N-glycans were treated with exoglycosidases to selectively release different monosaccharides from the non-reducing termini. First, α2–3,6,8 sialidase was used to release all the sialic acid groups, providing simplified information on the N-glycan structures. The neutral fraction was not treated with sialidase due to the absence of sialic acid residues in this fraction. N-Glycan fractions treated with α2–3,6,8 sialidase were analyzed by microfluidic CE (Figure S6) and MALDI-MS (data not shown). Potential N-glycan structures were assigned to peaks in the electropherograms by comparison with MALDI-MS spectra.
Second, the fractionated, native N-glycans were methylamidated to stabilize and neutralize terminal sialic acids and, subsequently, incubated with α1–2,3,4,6 fucosidase to identify fucosylated structures. Fucosidase-treated N-glycan fractions were analyzed by MALDI-MS (data not shown) to confirm the complete cleavage of fucose residues. Although different cleavage efficiency in releasing α1–6 linked fucose from the trimannosyl core and α1–3,4 linked fucose from the antennae have been documented by the exoglycosidase supplier, no fucosylated glycans were detected by MALDI-MS after the fucosidase treatment, which indicated complete cleavage of all the fucose residues. Therefore, the fucosidase treatment did not provide site- or linkage-specific information of fucosylation. Figure S7 compares electropherograms from ion-exchange fractions of N-glycans treated with fucosidase and not treated with the enzyme (intact). Electropherograms were aligned by matching the electrophoretic mobilities after co-injection of intact and fucosidase-treated samples of each fraction (Figure S8). Structures were assigned to peaks in the electropherograms by comparing with the MALDI-MS spectra and tracking the shift in migration time observed in the electropherograms.
For the fucosidase-treated neutral fraction, no migration shift was observed for the more intense peaks, which is consistent with the previous assignment of high-mannose structures (Figure 1b). In the mono- and di-sialylated fractions, after treatment with fucosidase, the second most intense peak merged into the most intense peak, indicating the existence of one fucosylated structure and its corresponding non-fucosylated counterpart. Similarly, two fucosylated structures and their corresponding non-fucosylated counterparts were observed in the tri-sialylated fraction. The migration shift of peaks in the tetra-sialylated fraction is not as clear, but the intense peak with the migration time of ~148 s likely corresponds to a fucosylated structure.
Intact N-glycan fractions (except for the neutral fraction) were then treated with α2–3 sialidase, which can specifically release α2–3 linked terminal sialic acids and provide linkage-specific information about sialylated N-glycans. Again, α2–3 sialidase-treated fractions were methylamidated and analyzed by microfluidic CE (Figure S9) and MALDI-MS (Figure S10). In all α2–3 sialidase-treated fractions, most glycans detected were neutral or mono-sialylated, which indicated the existence of less than two α2–6-linked sialic acid residues for most N-glycan structures. The exoglycosidase results and normalized abundances of sialic acid linkage isomers in each fraction are listed in Table S3.
Structural Assignment by SALSA.
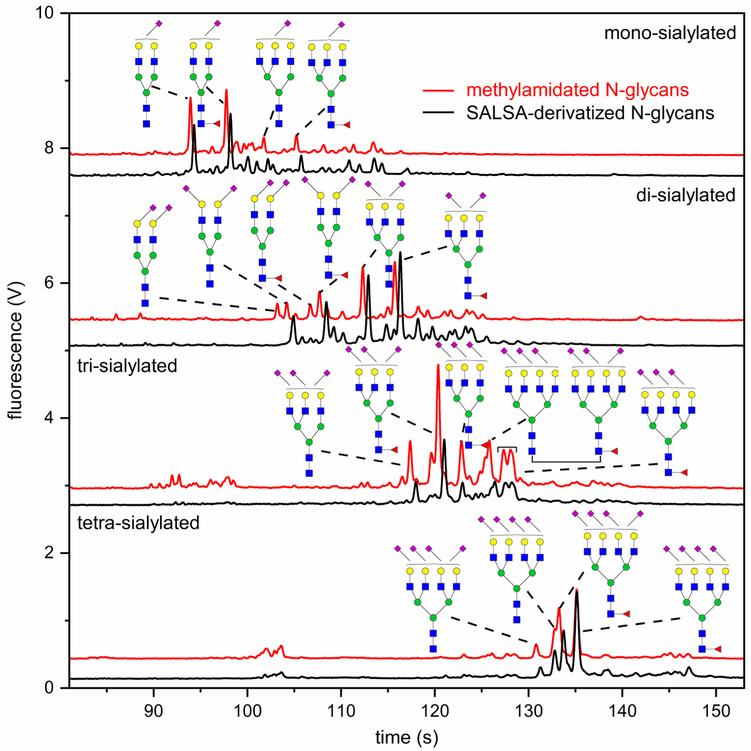
In addition to α2–3 sialidase digestion, a complementary strategy involving sialic acid linkage-specific derivatization was exploited to confirm the identification of sialyl linkage isomers. As reported recently,24 SALSA can selectively derivatize α2–3-linked sialic acids with methylamine (+13.032 Da) and α2–6-linked sialic acids with isopropylamine (+41.063 Da). For the N-glycans analyzed to this point by microfluidic CE and MALDI-MS, all sialic acid residues were neutralized by methylamidation. Compared to the methylamidated N-glycans, SALSA derivatization of N-glycans yields a mass shift of 28.031 Da in the MS spectrum and a migration shift in the electropherogram for each α2,6-linked sialic acid. As shown in Table S3, the majority of N-glycans derived from urinary exosomes have less than two α2–6-linked sialic acids, simplifying peak assignments of the SALSA-derivatized glycans. Figure 4 shows the comparison between methylamidated and SALSA-derivatized N-glycan fractions. Again, migration times were aligned by co-injecting the methylamidated and SALSA-derivatized samples (Figure S11). Structures were assigned by analyzing a portion of the sample by MALDI-MS (Figure S12) and tracking the shift in migration times of glycan peaks.
Figure 4.
Electropherograms of N-glycans fractionated by ion exchange, derivatized by either methylamidation or SALSA method, labeled with APTS, and separated by microfluidic CE. Detected population of sialic acid isomers is consistent with the results from exoglycosidase treatment. Of note, there are less than two α2–6-linked sialic acids for most detected structures.
N-Glycans with α2–6-linked sialic acids were the dominant composition in the mono-sialylated fraction, which is in good agreement with the exoglycosidase results. In the di-sialylated fraction, most tri-antennary N-glycans have one α2–3-linked and one α2–6-linked sialic acid. Bi-antennary N-glycans with one α2–3 and one α2–6 linkage, two α2–3 linkages, or two α2–6 linkages were detected by MALDI-MS from both α2–3 sialidase-treated samples (Table S3, Figure S10) and SALSA-derivatized samples (Figure S12b). However, some of these bi-antennary isomers were not assigned in the electropherograms (Figure 4 and Table S3), because those assignments are still ambiguous. For the tri- and tetra-sialylated fractions, N-glycans with no α2–6 linkage or one α2–6 linkage are most abundant, which is again consistent with the α2–3 sialidase results. For tetra-antennary structures, the difference in hydrodynamic volumes between a non-fucosylated structure and its fucosylated counterpart can be coincidentally compensated by the difference in hydrodynamic volumes resulting from various types of sialic acid linkages. In one example, a non-fucosylated, tetra-sialylated structure co-migrated with its fucosylated, tetra-antennary counterpart at 133 s (Figure 4).
Structural Assignment of N-Glycans Derived from Urinary Exosomes.
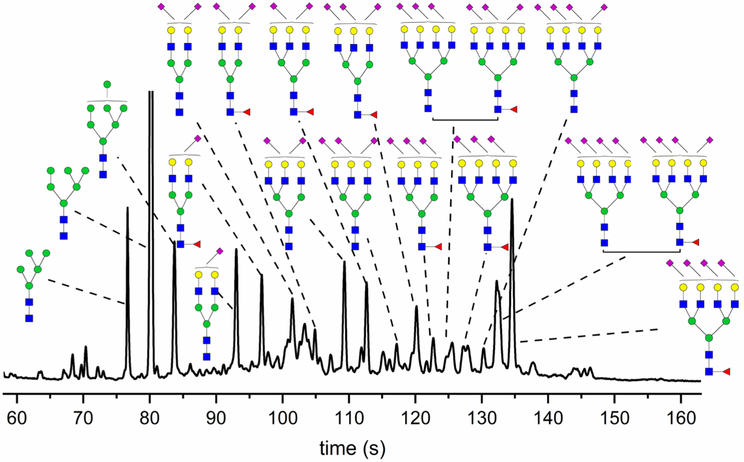
With the above indirect structural identification approaches, including ion-exchange fractionation, exoglycosidase digestions, SALSA derivatization, and MALDI-MS, the most intense peaks in the N-glycan profile of human urinary exosomes could be assigned with their corresponding structures (Figure 5). As shown in the N-glycan profile, different sialic acid linkage isomers were separated at high resolution, indicating good isomeric resolution of this technique. In total, we identified 64 sialyl-linkage isomers with SALSA derivatization and MALDI-MS analysis, and assigned 19 N-glycan structures to the microfluidic CE profile of the N-glycans.
Figure 5.
Annotated electropherogram of N-glycans derived from human urinary exosomes. Nineteen N-glycan isomers were assigned through a combination of microfluidic CE, ion-exchange chromatography, CE-MS, MALDI-MS, exoglycosidase digestions, and SALSA.
Discussion
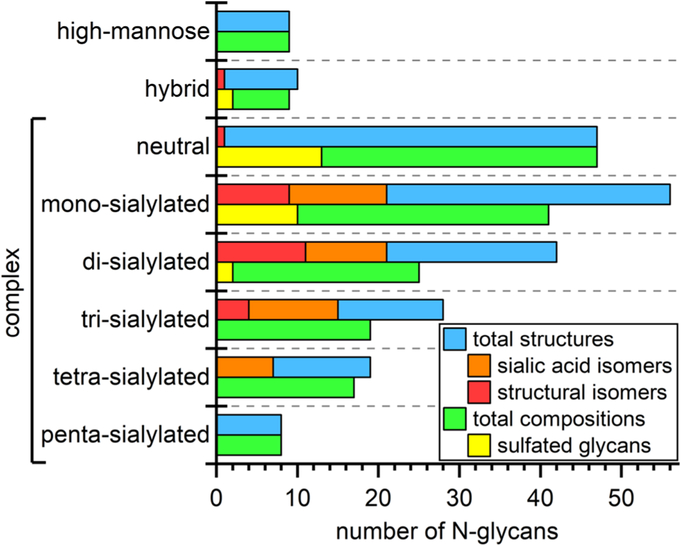
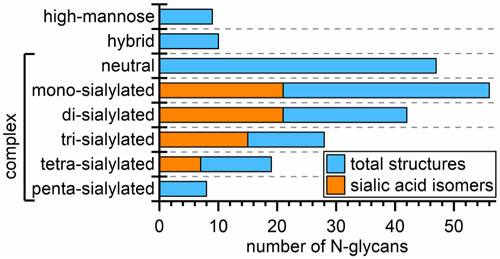
Recently, we outlined and tested an analytical strategy to address the extreme complexity of both N- and O-glycans found in human urinary exosomes. In the present report, we provide additional analytical capabilities to address some of the more intricate features of N-glycans structures such as the sialic acid linkage variations and other aspects of glycan isomerism. Our multi-methodological approach combines the best available chromatographic and electrophoretic techniques to separate glycans and their isomers with mass spectrometry for structural identification; consequently, we have detected 219 N-glycan structures that included 175 compositions, 27 sulfated glycans, 26 structural isomers, and 64 sialic-acid linkage isomers. Figure 6 summarizes how these compositions, structures, and their isomers are distributed among high-mannose, hybrid, and complex structures and are categorized further by the degree of sialylation. In the figure, we grouped sialic-acid linkage and structural isomers as subsets of the total structures and sulfated compositions as a subset of total compositions.
Figure 6.
Distribution of 219 N-glycan structures, 64 sialic-acid linkage isomers, 26 structural isomers, 175 compositions, and 27 sulfated glycans across high-mannose, hybrid, and complex structures and further categorized by the degree of sialylation for the complex structures. See Table 1 for the methods used to determine each type of N-glycan.
During the course of our investigations, we have learned a great deal about the complementary values of the different analytical techniques (see Table 1). From the methodological viewpoint, the urinary exosomal N-glycome is nearly an ideal sample that represents the richness and vast array of structures, from small paucimannosidic and high-mannose glycans to complex type, all the way to tetra-antennary structures, which exhibit a great degree of isomerism (see Figure 6). Nearly all structurally informative techniques used in this work greatly benefited from fractionation and preconcentration through ion-exchange chromatography and derivatization employed to meet different goals, e.g., APTS labeling for LIF detection and an electrophoretic tag for microfluidic CE; Girard’s reagent T (GT) for CE-MS; sialic-acid linkage-specific derivatization; and permethylation for enhanced sensitivity of some MS-based measurements. In addition, because data from CE-MS analysis of N-glycans are somewhat limited in the literature, LC-MS and MALD-MS analyses substantiated the results from CE-MS measurements. As noted above, the CE-MS experiments benefited from a mass analyzer with higher sensitivity.
The advantage of ion-exchange fractionation prior to microfluidic CE measurements is clearly seen in Figure 1, in which the structures composing the glycan profiles are tentatively assigned by comparing the relative abundances measured through MALDI-MS of methylamidated glycans (see Figures S3 and S4 in Supporting Information). Although MALDI-MS alone cannot effectively determine isomericity of N-glycans, an appropriate separation method combined with ESI-MS can provide the necessary information, as we further demonstrated with CE-MS of methylamidated and GT-derivatized samples in Figure 2. Even though the separating power of the CE capillary is compromised by the necessary sample overload compared to LIF-based detection, the ion-exchange preconcentration reduced the sample overload and allowed meaningful MS measurements and some indication of isomeric resolution. Another approach for resolving closely related structures and further securing MS/MS data for numerous components is LC-MS. Employing a long capillary column packed with 3-μm PGC generated high column efficiencies (around 100,000 theoretical plates).
As shown previously,16 such PGC columns could resolve a number of structural isomers due to the combination of a high column efficiency and selectivity of the column material. The relatively high sample loading capacity of these columns allows samples to be analyzed in their native (underivatized) form, whereas the concentrated separated bands even provided the opportunity to subject them to tandem mass spectrometry (MS/MS). This situation was true for numerous chromatographic peaks, albeit not for all components. Ion-exchange preconcentration prior to LC-MS/MS helped to reach a higher number of mixture constituents (data not shown).16 The combined results from CE-MS and LC-MS/MS yield an unprecedented number of detected and characterized N-glycan components (see Table S1 in the Supporting Information). Some structural assignments in Table S1 were also verified as permethylated glycans, which were fractionated and separated on the basis of their hydrophobicity.
The value of chromatographic separation is further illustrated in Table S2 with LC-MS/MS, where the N-glycans of the same m/z were recorded at different retention times. Here, the fragmentation patterns determined through MS/MS were used to confirm tentatively assigned structures. Isomeric resolution on the highly efficient PGC capillary column is quite favorable for bi-antennary and tri-antennary glycans, but apparently less so for the highly complex tetra-antennary structures. The value of tandem MS is clearly illustrated in Figure S5 with the unequivocal assignment of a bisecting structure. In the absence of authentic (synthesized) glycans, we stress that most structures listed in Tables S1 and S2 still remain tentative.
Glycan profiles derived from urinary exosomes16 are quantitatively (and, often, even qualitatively) different from the blood sera investigated earlier.25,32–33 A particularly notable case is the relatively high number of sulfated structures in the normal urinary exosome isolates. Their various structures are proposed in Table 2, based on the results from both LC-MS runs on the ion-exchange-preconcentrated, native N-glycans and permethylated aqueous extracts analyzed by MALDI-MS. Interestingly, during the partition of permethylated glycans between chloroform/aqueous medium, the sulfated glycans end up in the aqueous phase, as the sulfate charged groups appear to override the hydrophobicity of the remainder of the permethylated molecules. Although some of the structures listed in Table 2 remain tentative, many chromatographic peaks allowed for sufficiently sensitive MS/MS, which yielded characteristic fragment ions, exemplified with two differently sulfated structures in Figure 3. In total, 14 sulfated structures were validated through LC-MS/MS, whereas 20 structures were detected through MALDI-MS. Additional measures are needed to secure unequivocal structural assignments for these components.
Compared to LC-MS/MS and CE-MS, the high-efficiency resolution and LIF detection of microfluidic CE promotes qualitative and quantitative analysis of glycan isomers. Particularly, two complementary approaches, α2–3 sialidase treatment (Figure S9) and SALSA derivatization (Figure 4), were adopted for the identification of sialic acid linkage isomers. Selectively releasing α2–3 linked sialic acids helped determine the isomeric compositions of sialylated N-glycans (Table S3). The relative intensities of sialic acid linkage isomers detected by microfluidic CE and MALDI-MS were calculated and compared (Table S3). Higher ionization efficiencies of smaller N-glycans were observed in the MALDI-MS spectra, which led to inaccurate estimation of the relative abundances of glycan isomers. Whereas the LIF detection of N-glycans with one fluorophore per glycan enables reliable quantitative analysis of different sialic acid linkage isomers.
As an independent approach, SALSA derivatization confirmed the detected sialic acid linkage isomers (Figure 4). Identical isomeric compositions of sialylated N-glycans were detected by both approaches, indicating the reliability of both techniques. For most detected sialylated N-glycans, isomers with all α2–3-linked sialic acid(s) or only one α2–6-linked sialic acid dominate. Furthermore, smaller (mono- and bi-antennary) N-glycan structures were more likely α2–6 sialylated, whereas larger (tri- and tetra-antennary) N-glycan structures were highly α2–3 sialylated. In total, 64 sialic acid isomers were detected from human urinary exosomes.
Conclusions
Investigations of the human exosome glycome are still at very early stages. A thorough characterization of the respective samples is not merely a methodological exercise; there are some substantiated leads on the importance of aberrant glycosylation of certain structures in cancers and other diseases. Among the notable cases, positions of fucosyl substitution and sialyl linkages have been proposed19 to be involved in the proliferation of cancer cells, angiogenesis, and metastasis.21 Yet, these potentially important structural alterations, which may occur only as minor components during “global” glycan profiling studies, could be the most significant. This observation has been pointed out by some of us26 during analytical studies on sera of different patient cohorts with ovarian cancer, where the previously neglected tetra-antennary glycans appear significant. These conclusions were corroborated by an independent group of clinical scientists.34–35 Similar considerations may apply to detection and measurement of sulfated structures and the group of glycans that appear to play some role in connection with cancer.36 A thorough characterization of biological specimens, as is the case with our present investigation, has significance in (a) providing coverage of both major and minor components in highly complex samples; (b) promoting a structure-function understanding as based on glycan structural similarities and differences; and (c) leading potentially to simpler, more robust analytical procedures for determination of diagnostically and prognostically important signatures (based, perhaps, on non-MS approaches) once conspicuous glycans are determined.
Supplementary Material
Acknowledgement.
This work was supported in part by grant NIH R01 GM106084. The authors thank the Indiana University Mass Spectrometry Facility for use of its instruments.
Footnotes
Supporting Information. Subsections of the experimental section, results from dynamic light scattering, design of the microfluidic device, spectra from MALDI-MS and MS/MS, electropherograms from microfluidic CE, and tables of N-glycan structures.
References
- (1).Cheng L; Sharples RA; Scicluna BJ; Hill AF Exosomes Provide a Protective and Enriched Source of Mirna for Biomarker Profiling Compared to Intracellular and Cell-Free Blood. J. Extracell. Vesicles 2014, 3, 23743, 10.3402/jev.v3.23743. [DOI] [PMC free article] [PubMed] [Google Scholar]
- (2).Properzi F; Logozzi M; Fais S Exosomes: The Future of Biomarkers in Medicine. Biomark. Med 2013, 7, 769–778, 10.2217/bmm.13.63. [DOI] [PubMed] [Google Scholar]
- (3).Raposo G; Stoorvogel W Extracellular Vesicles: Exosomes, Microvesicles, and Friends. J. Cell Biol. 2013, 200, 373–383, 10.1083/jcb.201211138. [DOI] [PMC free article] [PubMed] [Google Scholar]
- (4).Whiteside TL Tumor-Derived Exosomes and Their Role in Cancer Progression In Advan. Clin. Chem, Makowski GS, Ed. Elsevier Academic Press Inc: San Diego, 2016; Vol. 74, pp 103–141. [DOI] [PMC free article] [PubMed] [Google Scholar]
- (5).Rolfo C; Castiglia M; Hong D; Alessandro R; Mertens I; Baggerman G; Zwaenepoel K; Gil-Bazo I; Passiglia F; Carreca AP; Taverna S; Vento R; Santini D; Peeters M; Russo A; Pauwels P Liquid Biopsies in Lung Cancer: The New Ambrosia of Researchers (Vol 1846, Pg 539, 2014). Biochim. Biophys. Acta-Rev. Cancer 2015, 1855, 17–17, 10.1016/j.bbcan.2014.11.003. [DOI] [PubMed] [Google Scholar]
- (6).Edgar JR Q&A: What Are Exosomes, Exactly? BMC Biol. 2016, 14, 7, 10.1186/s12915-016-0268-z. [DOI] [PMC free article] [PubMed] [Google Scholar]
- (7).Szczepanski MJ; Szajnik M; Welsh A; Whiteside TL; Boyiadzis M Blast-Derived Microvesicles in Sera from Patients with Acute Myeloid Leukemia Suppress Natural Killer Cell Function Via Membrane-Associated Transforming Growth Factor-Beta 1. Haematol-Hematol. J 2011, 96, 1302–1309, 10.3324/haematol.2010.039743. [DOI] [PMC free article] [PubMed] [Google Scholar]
- (8).Rak J; Guha A Extracellular Vesicles - Vehicles That Spread Cancer Genes. Bioessays 2012, 34, 489–497, 10.1002/bies.201100169. [DOI] [PubMed] [Google Scholar]
- (9).Sun Y; Liu J Potential of Cancer Cell Derived Exosomes in Clinical Application: A Review of Recent Research Advances. Clin. Ther 2014, 36, 863–872, 10.1016/j.clinthera.2014.04.018. [DOI] [PubMed] [Google Scholar]
- (10).Soung YH; Ford S; Zhang V; Chung J Exosomes in Cancer Diagnostics. Cancers 2017, 9, 11, 10.3390/cancers9010008. [DOI] [PMC free article] [PubMed] [Google Scholar]
- (11).Taylor DD; Gercel-Taylor C Microrna Signatures of Tumor-Derived Exosomes as Diagnostic Biomarkers of Ovarian Cancer. Gynecol. Oncol 2008, 110, 13–21, 10.1016/j.ygyno.2008.04.033. [DOI] [PubMed] [Google Scholar]
- (12).Miranda KC; Bond DT; McKee M; Skog J; Paunescu TG; Da Silva N; Brown D; Russo LM Nucleic Acids within Urinary Exosomes/Microvesicles Are Potential Biomarkers for Renal Disease. Kidney Int. 2010, 78, 191–199, 10.1038/ki.2010.106. [DOI] [PMC free article] [PubMed] [Google Scholar]
- (13).Hoorn EJ; Pisitkun T; Zietse R; Gross P; Frokiaer J; Wang NS; Gonzales PA; Star RA; Knepper MA Prospects for Urinary Proteomics: Exosomes as a Source of Urinary Biomarkers. Nephrology 2005, 10, 283–290, 10.1111/j.1440-1797.2005.00387.x. [DOI] [PubMed] [Google Scholar]
- (14).Pisitkun T; Shen RF; Knepper MA Identification and Proteomic Profiling of Exosomes in Human Urine. Proc. Natl. Acad. Sci. U. S. A 2004, 101, 13368–13373, 10.1073/pnas.0403453101. [DOI] [PMC free article] [PubMed] [Google Scholar]
- (15).Staubach S; Schadewaldt P; Wendel U; Nohroudi K; Hanisch FG Differential Glycomics of Epithelial Membrane Glycoproteins from Urinary Exovesicles Reveals Shifts toward Complex-Type N-Glycosylation in Classical Galactosemia. J. Proteome Res. 2012, 11, 906–916, 10.1021/pr200711w. [DOI] [PubMed] [Google Scholar]
- (16).Zou G; Benktander JD; Gizaw ST; Gaunitz S; Novotny MV Comprehensive Analytical Approach toward Glycomic Characterization and Profiling in Urinary Exosomes. Anal. Chem 2017, 89, 5364–5372, 10.1021/acs.analchem.7b00062. [DOI] [PMC free article] [PubMed] [Google Scholar]
- (17).Saraswat M; Joenvaara S; Musante L; Peltoniemi H; Holthofer H; Renkonen R N-Linked (N-) Glycoproteomics of Urimary Exosomes. Mol. Cell. Proteomics 2015, 14, 263–276, 10.1074/mcp.M114.040345. [DOI] [PMC free article] [PubMed] [Google Scholar]
- (18).Varki A; Cummings RD; Esko JD; Freeze HH; Stanley P; Bertozzi CR; Hart GW; Etzler ME, Essentials of Glycobiology. 2nd ed; Cold Spring Harbor Laboratory Press: New York, 2009. [PubMed] [Google Scholar]
- (19).Pinho SS; Reis CA Glycosylation in Cancer: Mechanisms and Clinical Implications. Nat. Rev. Cancer 2015, 15, 540–555, 10.1038/nrc3982. [DOI] [PubMed] [Google Scholar]
- (20).Reis CA; Osorio H; Silva L; Gomes C; David L Alterations in Glycosylation as Biomarkers for Cancer Detection. J. Clin. Pathol 2010, 63, 322–329, 10.1136/jcp.2009.071035. [DOI] [PubMed] [Google Scholar]
- (21).Fuster MM; Esko JD The Sweet and Sour of Cancer: Glycans as Novel Therapeutic Targets. Nat. Rev. Cancer 2005, 5, 526–542, 10.1038/nrc1649. [DOI] [PubMed] [Google Scholar]
- (22).Alvarez ML; Khosroheidari M; Ravi RK; DiStefano JK Comparison of Protein, Microrna, and Mrna Yields Using Different Methods of Urinary Exosome Isolation for the Discovery of Kidney Disease Biomarkers. Kidney Int. 2012, 82, 1024–1032, 10.1038/ki.2012.256. [DOI] [PubMed] [Google Scholar]
- (23).Lise M; Belluco C; Perera SP; Patel R; Thomas P; Ganguly A Clinical Correlations of Alpha 2,6-Sialyltransferase Expression in Colorectal Cancer Patients. Hybridoma 2000, 19, 281–286, 10.1089/027245700429828. [DOI] [PubMed] [Google Scholar]
- (24).Nishikaze T; Tsurnoto H; Sekiya S; Iwamoto S; Miura Y; Tanaka K Differentiation of Sialyl Linkage Isomers by One-Pot Sialic Acid Derivatization for Mass Spectrometry-Based Glycan Profiling. Anal. Chem 2017, 89, 2353–2360, 10.1021/acs.analchem.6b04150. [DOI] [PubMed] [Google Scholar]
- (25).Mitra I; Snyder CM; Zhou XM; Campos MI; Alley WR; Novotny MV; Jacobson SC Structural Characterization of Serum N-Glycans by Methylamidation, Fluorescent Labeling, and Analysis by Microchip Electrophoresis. Anal. Chem 2016, 88, 8965–8971, 10.1021/acs.analchem.6b00882. [DOI] [PMC free article] [PubMed] [Google Scholar]
- (26).Mitra I; Alley WR; Goetz JA; Vasseur JA; Novotny MV; Jacobson SC Comparative Profiling of N-Glycans Isolated from Serum Samples of Ovarian Cancer Patients and Analyzed by Microchip Electrophoresis. J. Proteome Res. 2013, 12, 4490–4496, 10.1021/pr400549e. [DOI] [PMC free article] [PubMed] [Google Scholar]
- (27).Alley WR; Vasseur JA; Goetz JA; Svoboda M; Mann BF; Matei DE; Menning N; Hussein A; Mechref Y; Novotny MV N-Linked Glycan Structures and Their Expressions Change in the Blood Sera of Ovarian Cancer Patients. J. Proteome Res. 2012, 11, 2282–2300, 10.1021/pr201070k. [DOI] [PMC free article] [PubMed] [Google Scholar]
- (28).Zhuang Z; Starkey JA; Mechref Y; Novotny MV; Jacobson SC Electrophoretic Analysis of N-Glycans on Microfluidic Devices. Anal. Chem 2007, 79, 7170–7175, 10.1021/ac071261v. [DOI] [PubMed] [Google Scholar]
- (29).Lei M; Mechref Y; Novotny MV Structural Analysis of Sulfated Glycans by Sequential Double-Permethylation Using Methyl Iodide and Deuteromethyl Iodide. J. Am. Soc. Mass Spectrom. 2009, 20, 1660–1671, 10.1016/j.jasms.2009.05.001. [DOI] [PubMed] [Google Scholar]
- (30).Lei M; Novotny MV; Mechref Y Sequential Enrichment of Sulfated Glycans by Strong Anion-Exchange Chromatography Prior to Mass Spectrometric Measurements. J. Am. Soc. Mass Spectrom. 2010, 21, 348–357, 10.1016/j.jasms.2009.09.017. [DOI] [PubMed] [Google Scholar]
- (31).Kumagai T; Katoh T; Nix DB; Tiemeyer M; Aoki K In-Gel Beta-Elimination and Aqueous-Organic Partition for Improved O- and Sulfoglycomics. Anal. Chem 2013, 85, 8692–8699, 10.1021/ac4015935. [DOI] [PMC free article] [PubMed] [Google Scholar]
- (32).Snyder CM; Alley WR; Campos MI; Svoboda M; Goetz JA; Vasseur JA; Jacobson SC; Novotny MV Complementary Glycomic Analyses of Sera Derived from Colorectal Cancer Patients by Maldi-Tof-Ms and Microchip Electrophoresis. Anal. Chem 2016, 88, 9597–9605, 10.1021/acs.analchem.6b02310. [DOI] [PMC free article] [PubMed] [Google Scholar]
- (33).Snyder CM; Zhou XM; Karty JA; Fonslow BR; Novotny MV; Jacobson SC Capillary Electrophoresis-Mass Spectrometry for Direct Structural Identification of Serum N-Glycans. J. Chromatogr. A 2017, 1523, 127–139, 10.1016/j.chroma.2017.09.009. [DOI] [PMC free article] [PubMed] [Google Scholar]
- (34).Biskup K; Braicu EI; Sehouli J; Fotopoulou C; Tauber R; Berger M; Blanchard V Serum Glycome Profiling: A Biomarker for Diagnosis of Ovarian Cancer. J. Proteome Res. 2013, 12, 4056–4063, 10.1021/pr400405x. [DOI] [PubMed] [Google Scholar]
- (35).Biskup K; Braicu EI; Sehouli J; Tauber R; Blanchard V The Serum Glycome to Discriminate between Early-Stage Epithelial Ovarian Cancer and Benign Ovarian Diseases. Dis. Markers 2014, 10, 10.1155/2014/238197. [DOI] [PMC free article] [PubMed] [Google Scholar]
- (36).Azevedo R; Peixoto A; Gaiteiro C; Fernandes E; Neves M; Lima L; Santos LL; Ferreira JA Over Forty Years of Bladder Cancer Glycobiology: Where Do Glycans Stand Facing Precision Oncology? Oncotarget 2017, 8, 91734–91764, 10.18632/oncotarget.19433. [DOI] [PMC free article] [PubMed] [Google Scholar]
Associated Data
This section collects any data citations, data availability statements, or supplementary materials included in this article.


