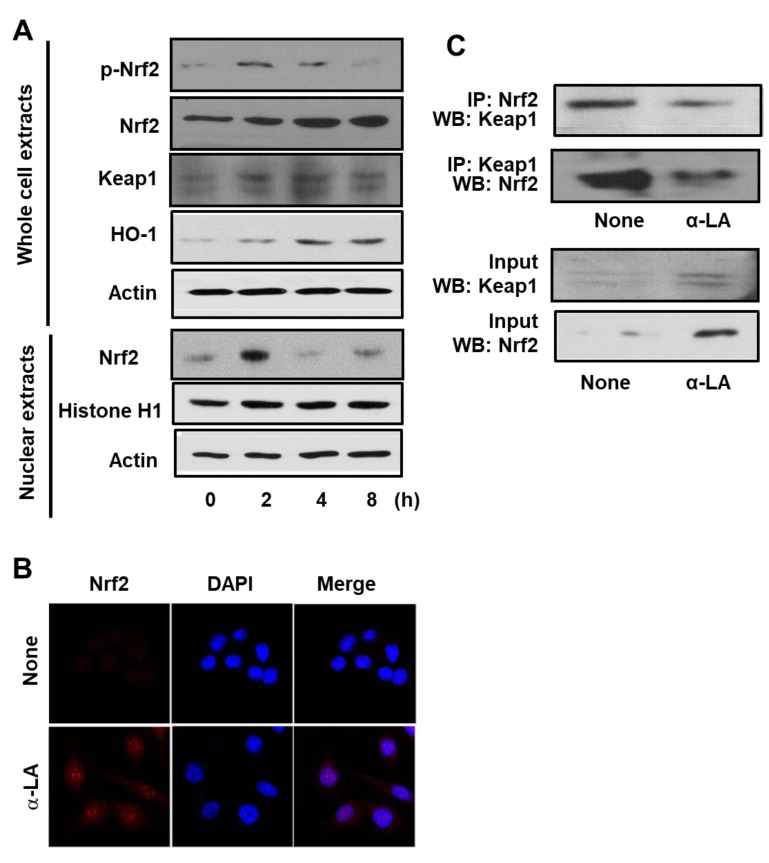
Figure 1.
Determination of the impact of α-LA on the levels of activated Nrf2, KEAP 1-bound Nrf2, KEAP 1, and HO-1 in AGS cells. (A) Western blots of whole-cell extracts (upper panel) or nuclear extracts (bottom panel) with actin serving as the loading control and histone H1 serving as the index for the nuclear extracts. The cells were treated with 5 μM α-LA for the indicated time periods. (B) Confocal microscope images of AGS cells treated with 5 μM α-LA for 2 h followed by immunofluorescence staining of the fixed cells. Nrf2 was visualized using fluorescein rhodamin-conjugated anti-rabbit IgG antibody (red) with DAPI counter staining (blue) of the same field. “None” refers to the cells treated with the vehicle for α-LA (0.5 M ethanol) alone. (C) Western blots of whole-cell extracts (lower panel) and whole-cell extract-derived immunoprecipitates obtained using the anti-Nrf2 and anti-KEAP 1 antibodies for precipitation (IP) and visualization (WB; western blot analysis) as indicated (upper panel). The cells were treated with 5 μM α-LA for 2 h. Input is used as the control for protein expression. “None” refers to the cells treated with the vehicle for α-LA (0.5 M ethanol) only.

