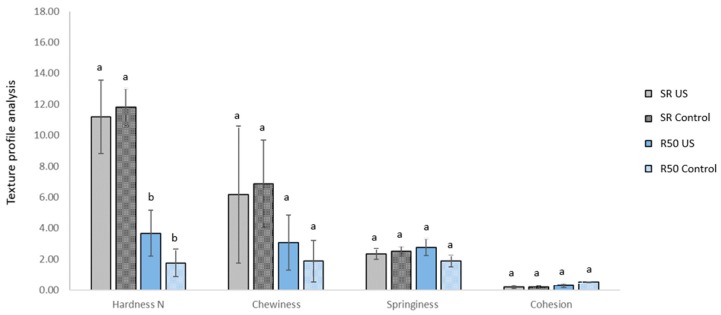
Figure 2.
Texture Profile Analysis (TPA) of samples marinated with a 1:2 substitution of NaCl with KCl (SR) or with a 50% reduction of NaCl (R50). Chicken samples were marinated with a frequency of 130 kHz for 1 h. Values are compared with a chicken sample marinated without ultrasound for 16 h (Control). Values represents means ± standard deviation (SD, N = 4). Different letters represent significant differences at p < 0.05 for each attribute.

