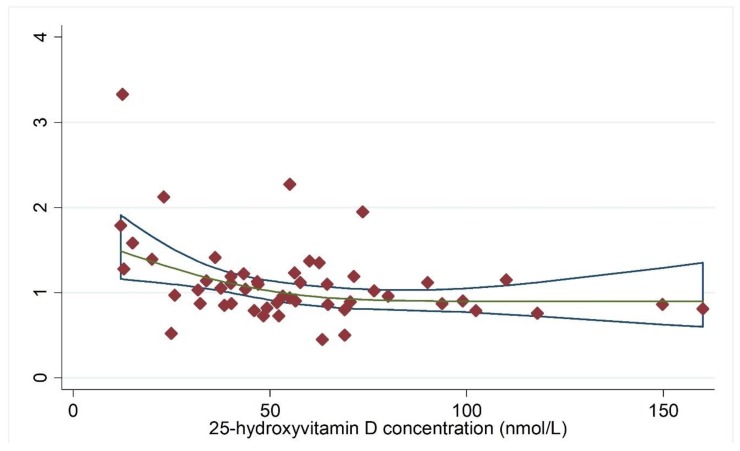
Figure 5.
Dose-response analysis for vitamin D concentration and cancer mortality. Adjusted RRs from each exposure quantile of 25(OH)D concentration in included individual studies were represented by the diamonds, and corresponding intervals (CIs) were represented by the blue trendline. Abbreviations: RR, relative risk. The green line indicated the dose-response linear trend between 25(OH)D concentration and risk of cancer mortality by use of variance-weighted least squares regression of fixed effect model.

