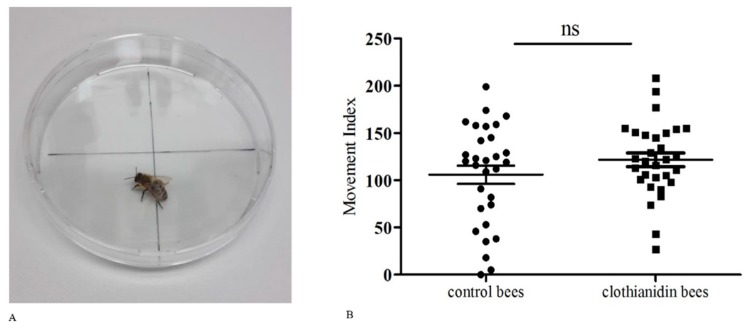
Figure 2.
Movement assay. (A) Experimental setup for the movement assay, in which we observed bee movement between the four sections of a Petri dish. (B) Movement index of control and clothianidin-fed bees expressed as the frequency of crossing the different quadrants, each point representing the movement index of one bee. For statistical analysis we used a paired t-test to test for differences between the groups (p = 0.2745; n = 30 honeybees per group; ns = non-significant). The mean value and the standard error of the mean (SEM) are also shown.

