

 One of chemistry's grand challenges is to find a function for every known metabolite. We explore the opportunity for artificial intelligence to provide rationale interrogation of metabolites to predict their function.
Abstract
Currently, there is no established technique that allows the function of a compound produced by nature to be predicted by looking at its 2-dimensional chemical structure. One of chemistry's grand challenges: to find a function for every known metabolite. We explore the opportunity for Artificial Intelligence to provide rationale interrogation of metabolites to predict their function.
Introduction
The profound and specific biological activity of natural products coupled with their immediately recognizable 2D-structures suggests a code within these structures that we are not as yet aware of. The long-standing challenge is to be able to decode the functional information entangled in the 2D-structures of these metabolites, selected over millions of years by continuous evolution. The function of natural products could be biological, ecological, pharmacological or to influence metabolite production. Almost all of these functions are the result of an interaction with a macromolecule, predominantly proteins.
An indication of the challenge to correlate the function of a natural product with its 2D-structure is provided by natural products isolated after screening against molecular targets. Some examples are given in Fig. 1. Sideroxylonal C (1) from Eucalytpus albens Benth. is an inhibitor of human plasminogen activator type-1 (PAI-1) and resulted from the screening of 21 384 extracts.1 Adociasulfate 1 (2) inhibited the osteoclast vacuolar H+-ATPase proton pump in hen bone-derived membrane vesicles.2 25-Hydroxy-13(24),15,17-cheilanthatrien-19,25-olide (3) was one of four cheilanthane sesterterpenes to inhibit mitogen and stress activated kinase (MSK1).3 Dysinosin A (4) from a marine sponge of the family Dysideidae was found to be a potent inhibitor of the blood coagulation cascade factor VIIa.4,5 Forty thousand (40 000) extracts were screened against Helicobacter pylori aspartate semialdehyde dehydrogenase (ASD) resulting in the identification of petrosamine B (5), as an inhibitor of the enzyme.6 Latifolians A (6) and B were new examples of the 8-benzyl-berberine alkaloid structure class and resulted from the screening of approximately 100 000 extracts against the neuronal specific isoform of the c-Jun N-terminal kinases, JNK3. Both compounds inhibited the kinase.7 Grandisine A (7) is a novel indolizidine alkaloids with human δ-opioid receptor binding affinity.8 Endiandrin A (8) was found to be a potent glucocorticoid receptor (GR) binder.9 Stylissadines A (9) and B, were identified as specific antagonists of the ligand gated cation channel P2X7 receptor.10 The stylissadines were isolated from the Australian marine sponge Stylissa flabellata Ridley & Dendy 1886 and are bisimidazo-pyrano-imidazole bromopyrrole ether alkaloids. Determination of the absolute configuration suggested that a number of related natural products, including palau'amine, should be revised to 12R, 17S, 20S. Isoprenylcysteine carboxyl methyltransferase (Icmt) catalyses the carboxyl methylation of oncogenic proteins and an extract from a Pseudoceratina sp. was identified in a HTS campaign. Spermatinamine (10) is the first natural product inhibitor of isoprenylcysteine carboxyl methyltransferase.11 Lysianadioic acid (11), is a potent inhibitor of carboxypeptidase B (CPB) and is a new arginine analogue containing an unusual dicarboxylic acid.12 Exiguaquinol (12) is a novel pentacyclic hydroquinone from Neopetrosia exigua that inhibits Helicobacter pylori Murl, a glutamate reacemase.13 Clavatadine A (13), a natural product with selective recognition and irreversible inhibition of factor XIa was isolated from a marine sponge, Suberea clavata Pulitzer-Final 1982.14 The first example of screening extracts using native mass spectrometry in an electrospray ionization Fourier transform ion cyclotron resonance mass spectrometer identified 6-(1S-hydroxy-3-methyl-butyl)-7-methoxy-2H-chromen-2-one (14) as the bovine carbonic anhydrase II active compound.15 The resveratrol tetramer (–)-hopeaphenol (15) inhibits type III secretion in the gram-negative pathogens Yersinia pseudotuberculosis and Pseudomonas aeruginosa.16 Euodenine A (16) is a small molecule agonist of human Toll-Like receptor 4 (TLR4) isolated from the leaves of Euodia asteridula.17 Euodenine A is a human-selective agonist that is CD14-independent and requires both TLR4 and MD-2 for full efficacy, and could modulate the Th2 immune response without causing lung damage. Venuloside A (17) from Pittosporum venulosum targets the LAT3 amino acid transporter.18 Achyrodimer F (18) is a tyrosyl-DNA phosphodiesterase I (Tdp1) inhibitor.19
Fig. 1. Natural products that have actions at protein targets. This illustrates the difficulty of predicting function from the chemical structure.

Target based screening results in the identification of many bioactive natural products such as those discussed above (Fig. 1). However, the investment is large, the process is inefficient and results only in ligands for known targets with little or no ability to predict the function of any other natural product.
The problem is even more intense if the natural product is isolated against a cellular target. Some examples are shown in Fig. 2. In this case, target identification is a major difficulty. 1-Methyl isoguanosine (19) was isolated from the aqueous ethanolic extract of the marine sponge Tedania digitata and was later shown to be a non-selective agonist at Adenosine A1 and A2A receptors.20–24 Axinellamines A (20) and Axinellamines B-D are imidazo-azole-imidazole bromopyrroloes isolated from the Australian marine sponge, Axinella sp. They had weak bactericidal activity against the screening organism Helicobacter pylori.25 The axinellamines were later synthesised by Baran et al. in a scalable process to allow wider testing and found to have significant anti-bacterial activity including against both hospital-acquired and community-acquired methicillin-resistant Staphylococcus aureu (MRSA) and Gram-negative bacteria. Iotrochotazine A (21) had cellular effects on EEA1-associated early endosomes together with decreased lysosomal staining on human olfactory neurosphere derived cells (hONS) from Parkinson's disease patients.26 Jaspamycin (22) had the highest deviation from control over the 38 biological parameters in the unbiassed hONS cell phenotypic assay out of the 22 secondary metabolites isolated from Jaspis splendens.27 Subsequent target identification is required for molecules that have cellular activity.
Fig. 2. Natural products that have actions at cellular targets. This illustrates the difficulty of predicting function from the chemical structure.

Fragment-based screening using low molecular weight (MW) natural products gives information on local binding sites within proteins. Our fragment-based publication identified 96 natural product fragments as binding partners of 32 of the putative malarial targets (Fig. 3).28
Fig. 3. Sixteen of 96 low MW natural products that bind to the malaria proteome.28.

We review data that may be analysed by Artificial Intelligence (AI) to answer the grand challenge: to find a function for every known metabolite by providing annotation of natural product interaction with proteins.
Discussion
Six datasets offering a combination of information related to known correlations of natural products to molecular target, structure similarity/dissimilarity, scaffolds and phenotypic cellular activity could be used in AI algorithms (Fig. 4). The objective is to annotate every natural product with its molecular target(s). The six datasets are now discussed individually.
Fig. 4. Proposed AI data integration to predict the function of a natural product based on its chemical structure A. Native MS observation of protein-ligand complexes. B. Network visualization of fragment hits against protein targets. C. Typical SOM of compound diversity. D. 2-ring scaffolds of varioxepine A. E. Natural products direct substituents in 3D space. F. Phenotypic response, hierarchically clustered based on their pairwise uncentred correlation coefficients.

Dataset 1. Molecular target
Molecular targets have been discovered for a number of natural products and a comprehensive literature search can be used to populate this dataset. All known targets would be included against each compound. By way of example this dataset would contain the PDB code 3BG8 for clavatadine A (in complex with Factor XIa).14 Native mass spectrometry can be used to identify protein-ligand complexes. The technology is robust and relies on non-denaturing electrospray-ionization (ESI) to firstly recognize multi-charged proteins in their near-native states. High resolution, high mass accuracy measurements, coupled with soft ionization techniques to preserve the integrity of complexes, allows for the confirmation of protein targets of natural products (Fig. 4A).15,29
Dataset 2. Molecular targets from fragment-based screening
Fragment-based screening uses low MW compounds to identify multiple binding sites within a protein. There are over 20 000 natural products that have MW < 250. We used native mass spectrometry to investigate 62 Plasmodium falciparum proteins as potential targets for antimalarial drugs using a natural product-based fragment library. We discovered 96 low molecular natural products identified as binding partners of 32 of the putative malarial targets. Seventy-nine (79) fragments had direct growth inhibition on Plasmodium falciparum.28 There were 48 selective fragments that bound a single protein and 48 fragments that bound more than one protein.28,30
Fig. 4B shows a typical network, visualized using Cytoscape software.31 Compounds are shown as space-filled representations, rectangular nodes represent proteins. Edge represents interaction between a fragment hit and a protein. Considering hits and proteins as nodes, they are connected to each other based on the binding interaction, to produce a network.
Fragment-based networks gives 4 sets of data (Fig. 5). A fragment binding to a single protein provides a molecular target. A fragment that bound to 2 or more proteins would identify proteins that have common fragment–protein interactions. The native mass spectrometry experiment can be used for competitive binding and identify fragments that can bind at the same site and compete for the same binding site and compounds that can simultaneously bind to the protein to identify non-competitive binding sites (Fig. 5).
Fig. 5. Cartoon of a fragment-based network consisting of two proteins (A and B). Ligand 1 binds to both proteins indicating there is a similar localised binding site. Ligands 1, 2, 3 and 4 bind to protein B. Ligand 2 and ligand 3 bind to the same site and are competitive, the native MS would display 2 protein-ligand complexes. Ligand 2, and ligand 4 bind simultaneously and are non-competitive, the native MS shows the 2 individual protein-ligand complexes and a third protein-ligand complex due to both ligand 2 and ligand 4 simultaneously occupying the protein cavity. A similar situation arises for ligand 1 and ligand 4.

Dataset 3. Structure similarity/dissimilarity
The structural diversity of natural products can be analysed using radial fingerprints encoding the 2D topological atom environment (ECFP_4) using Canvas by Schrodinger (version1.5.518).32,33 This type of fingerprint is one of the most widely used, and represents the environment of atoms in the neighbourhood of each heavy atom in the molecule within a four-bond diameter. The total diversity is then represented by training a 25 × 25 self-organizing map (SOM) (Fig. 4C).34 Each cell represents a cluster of compounds and the distance between cells (i.e. nearby cells are structurally related compounds) is indicated by the shading of the cell borders; darker borders indicate larger distance. Cells are coloured by population, with white for empty cells, and red for cell containing more than 5 compounds. The trained SOM is characterized by a toroidal architecture, which means that the top edge is connected to the lower edge and the left edge with the right edge.35–37
Fig. 6 shows a seed compound (39) and other similar compounds in the cell. Compounds in the four adjacent cells would provide further data input.
Fig. 6. Compound diversity analysis to cluster compounds.

Dataset 4. Scaffolds
To depict a molecule's complexity as completely as possible and remove ambiguities a scaffold networks approach uses the algorithm of Schuffenhauer et al. (Fig. 4D).38 The approach decomposes a complex scaffold in every possible way, which then results in a network for each single molecule, consisting of scaffolds of different ring sizes.39 This allows the exploration of the full scaffold space, such networks can be overlaid and hubs indicate similar properties.39 The authors concluded, that the scaffold network approach should be utilized for the analysis of bioactivity and the alternate scaffold tree approach for the analysis of chemistry within libraries. A software solution is given through scaffold network generator, an open-source command-line utility, which can handle huge datasets.40
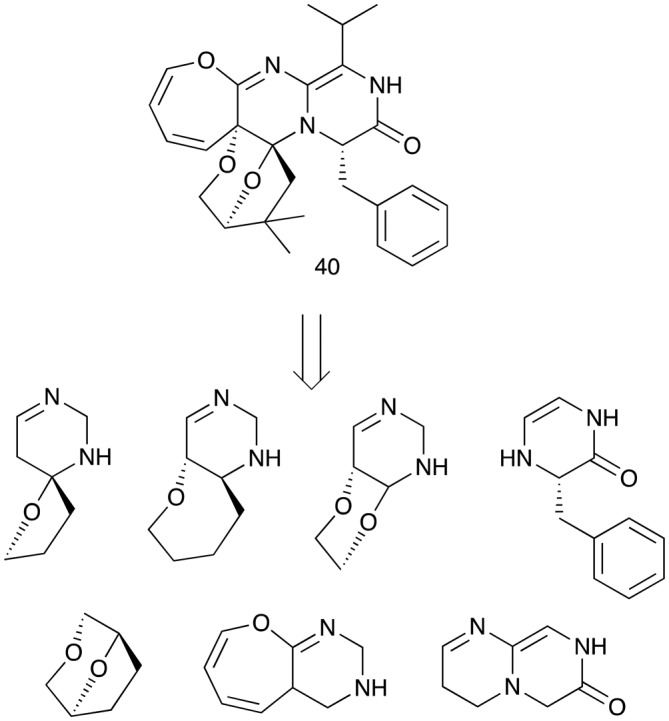
For an illustration of this approach, the scaffold network of varioxepine A (40),41 yields 37 different embedded scaffolds; 5 scaffolds containing 5 rings, 9 scaffolds containing 4 rings, 9 scaffolds containing 3 rings, 7 scaffolds containing 2 rings and 7 consisting of single rings (Fig. 7).42,43 Natural product embedded scaffolds are often 3-dimensional and different to the concentration on flat molecules in other scaffolds used for medicinal chemistry.44
Fig. 7. Embedded two-ring scaffolds arising from a scaffolds network analysis of varioxepine A (40).
Dataset 5. Molecular targets from biosynthetic enzymes
Recently, we have demonstrated that site comparison methodology using flavonoid biosynthetic enzymes as the query could automatically identify structural features common to different flavonoid-binding proteins, allowing the identification of flavonoid targets such as protein kinases.45,46 With the aim of further validating the hypothesis that biosynthetic enzymes and therapeutic targets can contain a similar natural product imprint, we collected a set of 159 X-ray structures representing 38 natural product biosynthetic enzymes by searching the Protein Data Bank. Each enzyme structure was used as a query to screen a repository of approximately 10 000 ligandable sites by active site similarity. We reported a full analysis of the screening results and highlight three retrospective examples where the natural product validates the method, thereby revealing novel structural relationships between natural product biosynthetic enzymes and putative protein targets of the natural product. Natural product scaffolds direct substituents to interact with proteins (Fig. 4E).47 Analysis of biosynthetic enzymes and target proteins, from a prospective view, has provided a list of up to 64 potential novel targets for 25 well characterized natural products. As an example, pentalene (41) produced by the biosynthetic enzyme pentalene synthase correlates with serine/threonine-protein kinase Chk1, chorismate synthase, interleukin-2 (Fig. 8).47
Fig. 8. Structures of pentalene (41), ajmaline (42), protopine (43) and gitoxigenin (44).

Partial data for datasets 1–5 is given in Table 1.
Table 1. Partial data for datasets 1–5.
| Compound | Dataset 1 | Dataset 2 |
Dataset 3 |
Dataset 4 |
Dataset 5 |
||||||||
| 1. Known target | 2. Fragment binding to >1 proteins | 3. Competitive | 4. Non-competitive binding sites | 5. Similar chemical diversity | 6. 4 adjacent cells | 7. 5-ring embedded scaffolds | 8. 4-ring embedded scaffolds | 9. 3-ring embedded scaffolds | 10. 2-ring embedded scaffolds | 11. 1-ring embedded scaffolds | 12. Biosynthetic gene | 13. Predicted therapeutic targets | |
| 13 | 3BG8 | ||||||||||||
| 28 | 2F8M, 3BFK | ||||||||||||
| 29 | 2PLW, 2GZQ | ||||||||||||
| 35 | 3BFK, 5WOF | ||||||||||||
| 36 | 1VYQ, 2PLW, 3BFK, 2QOR | ||||||||||||
| 37 | 2WDT, 2QOR, 2Q0V | ||||||||||||
| 39 | O = C1CC2C(C(C)(O)CC2)CO1 | ||||||||||||
| 39 | O = C1CC2(O)C(C(C)(O)CC2O)CO1 | ||||||||||||
| 39 | O = C1CC2(CO)C(C(C)(O)CC2)CO1 | ||||||||||||
| 39 | O = C1C2 = C(C)C(O)C(O)C2(O)CCO1 | ||||||||||||
| 39 | O = C(C1)OC2(C)C1C(C)(C)C(O)C = C2 | ||||||||||||
| 39 | O = C(C1)OC2(C)C1C(C)(C)C(O)C(C)(O)C2 | ||||||||||||
| 39 | O = C(C1CO)OC2(C)C1CC(C(C)(O)C2) = O | ||||||||||||
| 39 | CC1 = CC(OC12C(O)CC(O)C(CO)O2) = O | ||||||||||||
| 39 | OC1C2(C(C)C = CC(C2O) = O)OC(C1C) = O | ||||||||||||
| 40 | C1 = NCN[C@@]2(CCCO2)C1 | ||||||||||||
| 40 | [C@@H]12C = NCN[C@@H]1CCCCO2 | ||||||||||||
| 40 | [C@@H]12C = NCN[C@@H]1OCCO2 | ||||||||||||
| 40 | O = C1[C@H](CC2 = CC = CC = C2)NC = CN1 | ||||||||||||
| 40 | [C@H]1(O2)COC[C@@H]2CC1 | ||||||||||||
| 40 | C12 = NCNCC1C = CC = CO2 | ||||||||||||
| 40 | O = C1CN2CCC = NC2 = CN1 | ||||||||||||
| 41 | 1PS1, 1HM7, 1HM4 | 1IA8, 1NVQ, 1NVR, 1ZLT, 1ZYS | |||||||||||
| 41 | 1PS1, 1HM7, 1HM4 | 1UMO, 1UMF | |||||||||||
| 41 | 1PS1, 1HM7, 1HM4 | 1ILM, 1ILN, 1IRL, 1 M47, 1 M48, 1 M49 | |||||||||||
Data set 6. Phenotypic cellular activity
Unbiassed phenotypic analysis has been used to examine natural products for a range of cellular effects (Fig. 4F). Cluster analysis was used to group similar responses. The data included compounds with known mechanism of action so that phenotypic data may subsequently lead to the discovery of particular targets.27,48,49 We used the cytological parameters followed by hierarchical clustering and vizualisation as a dendogram.27,48,49 AI can treat each data point separately.
Data for ajmaline (42), protopine (43) and gitoxigenin (44) is given in Table 2.
Table 2. Partial data for dataset 6.
| Compound | 14. Nucleus area (μm2) | 15. Nucleus width (μm) | 16. Nucleus length (μm) | 17. Nucleus morphology ratio width to length | 18. Nucleus roundness | 19. Nucleus marker intensity | 20. Nucleus marker texture index (SER spot 1 px) | 21. Cell area (μm2) | 22. Cell width (μm) | 23. Cell length (μm) | 24. Cell morphology ratio width to length | 25. Cell roundness | 26. Tubulin marker intensity in cytoplasm | 27. Tubulin marker intensity in outer region | 28. Tubulin marker intensity in inner region | 29. Tubulin marker texture index (SER spot 1px) | 30. Mitochondria marker intensity in cytoplasm | 31. Mitochondria marker intensity in outer region | 32. Mitochondria marker intensity in inner region | 33. Mitochondria marker texture index (SER spot 1px) | 34. LC3b marker intensity in cytoplasm | 35. LC3b marker intensity in outer region | 36. LC3b marker intensity in inner region | 37. LC3b marker texture index (SER spot 1px) | 38. Lysosomes marker intensity in cytoplasm | 39. Lysosome marker intensity in outer region | 40. Lysosomes marker intensity in inner region | 41. Lysosomes marker texture index (SER spot 1 px) | 42. Relative EEA1 marker spot signal in cytoplasm | 43. Relative EEA1 marker spot signal in outer region | 44. Relative EEA1 marker spot signal in inner region | 45. Number of EEA1 spots in cytoplasm | 46. Number of EEA1 spots per area of cytoplasm | 47. Number of EEA1 spots in outer region | 48. Number of EEA1 spots per area of outer region | 49. Number of EEA1 spots in inner region | 50. Number of EEA1 spots per area of inner region | 51. EEA1 marker texture (SER spot 1 px) |
| 42 | 0.2 | 0.0 | –0.5 | 0.6 | 0.6 | 0.0 | 0.5 | –0.2 | –0.3 | 0.3 | 0.0 | 0.0 | 0.3 | –0.2 | 0.0 | –0.7 | –0.2 | 0.2 | –0.2 | –0.3 | 0.0 | –0.2 | 0.0 | –0.8 | 1.1 | 1.1 | 1.0 | –0.9 | 0.7 | 0.4 | 0.7 | –0.6 | –0.5 | –0.5 | –0.3 | –0.4 | –0.2 | 0.0 |
| 43 | 0.0 | 0.2 | 0.0 | –0.5 | –0.1 | 0.0 | 1.8 | –1.4 | –1.0 | –0.8 | 0.2 | 0.6 | 1.6 | 0.1 | 1.5 | –0.4 | –0.1 | 0.6 | –0.1 | 0.4 | 1.0 | –0.1 | 1.0 | –1.0 | 1.5 | 1.4 | 1.4 | 0.2 | 1.1 | 1.0 | 0.8 | –0.9 | 0.0 | –0.8 | 0.0 | –0.6 | 0.0 | 0.3 |
| 44 | –1.0 | –1.0 | –0.7 | –1.0 | –1.5 | 0.3 | 2.5 | –1.5 | –1.0 | –1.4 | 1.4 | 1.5 | 2.9 | 0.3 | 2.7 | –1.1 | 0.2 | 1.7 | 0.2 | –1.2 | 2.0 | 0.1 | 1.8 | 0.6 | 1.2 | 1.1 | 1.2 | –0.4 | 0.4 | 0.2 | 0.0 | 0.0 | 0.0 | 0.0 | 0.0 | 0.0 | 0.0 | 0.0 |
Artificial intelligence
Technological advances in artificial intelligence (AI), especially in the field of deep learning, hold the potential to make smart predictions based on explainable knowledge and patterns. Multi-faceted Big Data on the function of natural products offers exciting new opportunities to apply state-of-the-art deep learning advances to pursuing the grand challenge of predicting biological function from the chemical structure of a natural product. AI may tease out meaningful patterns and useful knowledge leading to integrated relationships and logic links between the metabolite structures and functions.
However, significant ground-work in applying this research is still critically needed before real breakthroughs can happen. For example, one open question in AI is how to explain deep learning outcomes from various heterogeneous data sources. Data integration facilitates cross-dataset analyses.50 The opportunity is high given the vast quantity and variety of data.50 There may be a new paradigm for data integration based on Representation Learning developments in Artificial Intelligence, such as Autoencoders, that will provide a new paradigm for data integration.50
The growth of metabolite Big Data creates an opportunity to learn patterns (extracting knowledge) from physical and chemical properties as well as biochemical function of known metabolites. The challenge is in designing and developing sophisticated machine learning algorithms that learn from the known data and generate robust prediction for the function of novel molecules.
The datasets on metabolomes with known ligand-protein binding pairs can be used to train deep learning neural networks to predict new ligand-protein binding pairs. In such a prediction process, machine learning challenges are in developing algorithms for: the recognition of binding pockets in a target, the pocket similarity between different targets, and matching molecules to identified pockets. Successful outcomes of these challenges will lead to the development of software tools for deciphering and predicting protein-metabolite interactions. On the other hand, genomic and proteomic approaches provide hypothesis driven information on molecular targets that can be analysed for pathways. They result, uniformly, in many potential targets.
AI can address two fundamental aspects. (1) Phenotype Prediction: the data creates an opportunity to learn models and mine patterns (extracting knowledge) from the physical and chemical properties and the phenotype function of known metabolites through deep learning and pattern analysis. (2) Metabolite-Protein Interactions: the large datasets currently available on metabolomes with known ligand-protein binding pairs can be used to train deep learning neural networks to predict new ligand-protein binding pairs. The research questions include: how to collect the training data and label the data with correct information? Could a deep learning-based model be developed to predict the specific targets of known metabolites? How can computational models be developed for verifying functions of metabolites? How to define the coupling relationships (via similarity or distance) between different chemical structures? How to evaluate the performance of prediction to reinforce the learning? How to tune the deep learning-based parameters? How to deal with the heterogeneous data sources? How to quantify the data interdependence of chemical structures and metabolite functions? How to build the AI bridge between metabolite structures and functions to make smart predictions?
Native MS allows specific interactions between metabolites and protein targets.15,28,29 Native MS can provide both the data analysis and the tool to confirm the specific ligand-protein complex i.e. the prediction of function to probe the AI predictions.
Conclusions
Is it time? Can AI use a matrix that contains information containing Smiles and PDB Codes and correlations embedded in six starting datasets to meaningful predict function (i.e. the protein target) of natural products.
The predicative value of machine learning for deep extraction of connectivities embedded in genomics and proteomics data is well recognised and utilised.51 For linear information molecules such as nucleic acids and proteins, the primary sequence structure can be readily digitised for computation and AI algorithms. For nonlinear information molecules such as natural products that are not amenable to linear coding, various manifolds of data sets have to be first collected, cross annotated, assembled and then multiplexed to capture, as much as possible, about these metabolites and their interactive partners, before the next set of AI algorithms can be implemented. While the scale and complexity of this deep learning may be unprecedented and daunting, it is the next grand challenge that will push functional chemogenomics and chemoproteomics into a new future. More importantly, the ability to predict function from structure for molecules such as natural products will forge a new paradigm for finding the next generations of precision medicines.
Conflicts of interest
There are no conflicts to declare.
Acknowledgments
The authors acknowledge the support of the Australian Research Council Discovery grant DP160101429.
Biographies

Yunjiang Feng and Miaomiao Liu
Miaomiao Liu (right) obtained dual PhD degrees in 2017 from Griffith University supervised by Ronald J Quinn and the University of Chinese Academic of Sciences supervised by Lixin Zhang. She is now a Research Fellow at the Griffith Institute for Drug Discovery, Griffith University. Her research interests involve the target identification using native mass spectrometry, identification of bioactive natural products using a pheno-target approach and NMR fingerprints.
Yunjiang Feng (left) obtained a Bachelor's degree in Pharmaceutical Chemistry from Peking University (former Beijing Medical University), then a PhD degree in marine natural products chemistry from James Cook University, followed by post-doctoral research in bioactive fungal metabolites in Canterbury University. In 2004, Dr Feng was recruited as a research fellow to Griffith University. She is currently an Associate Professor. Dr Feng current leads a research group at Griffith Institute for Drug Discovery. Her research interests include bioactive natural products and traditional Chinese medicine.

Peter Karuso and Fei Liu
Peter Karuso obtained his BSc(Hon 1) and PhD from the Department of Organic Chemistry at the University of Sydney (W. C. Taylor) and completed postdoctoral fellowships with Dame Patricia Bergquist (University of Auckland), Paul Scheuer (University of Hawaii), Ian Scott and Sir Derek Barton (Texas A&M) and Horst Kessler (Technische Universität München) before returning to Macquarie University in 1990 and is currently Professor of Chemistry. His research interests are in understanding the role and function of natural products in biological systems using “reverse chemical proteomics” to rapidly, and agnostically, link natural products with this protein targets using phage and yeast surface display technologies.
Fei Liu did her undergraduate studies in Chemistry at John Carroll University and her PhD in Organic Chemistry at Yale University. After an NIH postdoctoral fellowship on “unnatural” products from biosynthetic pathways at the Harvard Medical School, she moved from Boston to Sydney in 2004 and is currently Senior Lecturer in the Department of Molecular Sciences at Macquarie University. Her long-term interest in natural product-driven chemical proteomics for basic biological research and drug discovery is being pursued in close collaboration with the Australian Proteome Analysis Facility (APAF) and reverse chemical proteomics discovery platforms at Macquarie.
Esther Kellenberger
Esther Kellenberger obtained a Ph.D. (with Bruno Kieffer) in biophysics from Strasbourg University, France, in 2000. She was a Von Humboldt fellow (with Michael Sattler) at the European Molecular Biology Laboratory, Germany, in 2001. She has since worked in the faculty of Pharmacy, Strasbourg University, where she is Professor of computer-aided drug design. Her research activities are focused on the structure-based discovery of active molecules. She is particularly interested in understanding and modeling molecular recognition (mining of the Protein Data Bank, docking and site comparison methods for virtual screening, function of the chemokine receptor CCR5).

Can Wang
Can Wang received her B.Sc. and M.Sc. degrees in Mathematics from Wuhan University, China, in 2007 and 2009, respectively, and the Ph.D. degree on Computing Sciences from the Advanced Analytics Institute, University of Technology, Sydney, NSW, Australia, in 2013. She worked as a postdoctoral fellow with the Commonwealth Scientific and Industrial Research Organisation (CSIRO), Australia in Hobart, Tasmania from 2014 to 2016. She is currently a lecturer in the Gold Coast campus, Griffith University, Australia. Her current research interests include data analytics, artificial intelligence, machine learning, and big data.

Ron Quinn
Ron Quinn received his B.Sc.(Hons 1) and Ph.D. (with Ken Cavill) from UNSW. After postdoctoral training with Bob Pettit at Arizona State University, Richard Moore and Ted Norton at the University of Hawaii, and Rod Rickards at ANU he joined the Roche Research Institute for Marine Pharmacology in Sydney in 1974. He commenced at Griffith University in 1982. He is currently Professor of Chemistry. His interests focus on biodiscovery for tuberculosis, malaria, and Parkinson's disease; fragment-based drug discovery (using low MW natural products); native state mass spectrometry; NMR metabolomics; medicinal chemistry and artificial intelligence.
References
- Neve J., Leone P. d. A., Carroll A. R., Moni R. W., Paczkowski N. J., Pierens G., Björquist P., Deinum J., Ehnebom J., Inghardt T., Guymer G., Grimshaw P., Quinn R. J. J. Nat. Prod. 1999;62:324–326. doi: 10.1021/np980286+. [DOI] [PubMed] [Google Scholar]
- Kalaitzis J. A., Leone P. d. A., Harris L., Butler M. S., Ngo A., Hooper J. N. A., Quinn R. J. J. Org. Chem. 1999;64:5571–5574. doi: 10.1021/jo990404d. [DOI] [PubMed] [Google Scholar]
- Buchanan M. S., Edser A., King G., Whitmore J., Quinn R. J. J. Nat. Prod. 2001;64:300–303. doi: 10.1021/np0004597. [DOI] [PubMed] [Google Scholar]
- Carroll A. R., Pierens G. K., Fechner G., de Leone P., Ngo A., Simpson M., Hyde E., Hooper J. N. A., Bostroem S.-L., Musil D., Quinn R. J. J. Am. Chem. Soc. 2002;124:13340–13341. doi: 10.1021/ja020814a. [DOI] [PubMed] [Google Scholar]
- Carroll A. R., Buchanan M. S., Edser A., Hyde E., Simpson M., Quinn R. J. J. Nat. Prod. 2004;67:1291–1294. doi: 10.1021/np049968p. [DOI] [PubMed] [Google Scholar]
- Carroll A. R., Ngo A., Quinn R. J., Redburn J., Hooper J. N. A. J. Nat. Prod. 2005;68:804–806. doi: 10.1021/np049595s. [DOI] [PubMed] [Google Scholar]
- Rochfort S. J., Towerzey L., Carroll A. R., King G., Michael A., Pierens G., Rali T., Redburn J., Whitmore J., Quinn R. J. J. Nat. Prod. 2005;68:1080–1082. doi: 10.1021/np049616i. [DOI] [PubMed] [Google Scholar]
- Carroll A. R., Arumugan G., Quinn R. J., Redburn J., Guymer G., Grimshaw P. J. Org. Chem. 2005;70:1889–1892. doi: 10.1021/jo048525n. [DOI] [PubMed] [Google Scholar]
- Davis R. A., Carroll A. R., Duffy S., Avery V. M., Guymer G. P., Forster P. I., Quinn R. J. J. Nat. Prod. 2007;70:1118–1121. doi: 10.1021/np070073x. [DOI] [PubMed] [Google Scholar]
- Buchanan M. S., Carroll A. R., Addepalli R., Avery V. M., Hooper J. N. A., Quinn R. J. J. Org. Chem. 2007;72:2309–2317. doi: 10.1021/jo062007q. [DOI] [PubMed] [Google Scholar]
- Buchanan M. S., Carroll A. R., Fechner G. A., Boyle A., Simpson M. M., Addepalli R., Avery V. M., Hooper J. N. A., Su N., Chenc H., Quinn R. J. Bioorg. Med. Chem. Lett. 2007;17:6860–6863. doi: 10.1016/j.bmcl.2007.10.021. [DOI] [PubMed] [Google Scholar]
- Buchanan M. S., Carroll A. R., Edser A., Sykes M., Fechner G. A., Forster P. I., Guymer G. P., Quinn R. J. Bioorg. Med. Chem. Lett. 2008;18:1495–1497. doi: 10.1016/j.bmcl.2007.12.060. [DOI] [PubMed] [Google Scholar]
- Leone P. d. A., Carroll A. R., Towerzey L., King G., McArdle B. M., Kern G., Fisher S., Hooper J. N. A., Quinn R. J. Org. Lett. 2008;10:2585–2588. doi: 10.1021/ol800898z. [DOI] [PubMed] [Google Scholar]
- Buchanan M. S., Carroll A. R., Wessling D., Jobling M., Avery V. M., Davis R. A., Feng Y., Xue Y., Oster L., Fex T., Deinum J., Hooper J. N. A., Quinn R. J. J. Med. Chem. 2008;51:3583–3587. doi: 10.1021/jm800314b. [DOI] [PubMed] [Google Scholar]
- Vu H., Quinn R. J. J. Biomol. Screening. 2008;13:265–275. doi: 10.1177/1087057108315739. [DOI] [PubMed] [Google Scholar]
- Zetterström C. E., Hasselgren J., Salin O., Davis R. A., Quinn R. J., Sundin C., Elofsson M. PLoS One. 2013;8:e81969. doi: 10.1371/journal.pone.0081969. [DOI] [PMC free article] [PubMed] [Google Scholar]
- Neve J. E., Wijesekera H. P., Duffy S., Jenkins I. D., Ripper J., Teague S. J., Garavelas A., Nikolakopoulos G., Le P. V., Leone P. d. A., Pham N. B., Shelton P., Fraser N., Carroll A. R., Avery V. M., McCrae C., Williams N., Quinn R. J. J. Med. Chem. 2014;57:1252–1275. doi: 10.1021/jm401321v. [DOI] [PubMed] [Google Scholar]
- Grkovic T., Pouwer R. H., Wang Q., Guymer G. P., Holst J., Quinn R. J. J. Nat. Prod. 2015;78:1215–1220. doi: 10.1021/np500968t. [DOI] [PubMed] [Google Scholar]
- Tian L.-W., Feng Y., Tran T. D., Shimizu Y., Pfeifer T., Vu H. T., Quinn R. J. Bioorg. Med. Chem. Lett. 2017;27:4007–4010. doi: 10.1016/j.bmcl.2017.07.062. [DOI] [PubMed] [Google Scholar]
- Quinn R. J., Gregson R. P., Cook A. F., Bartlett R. T. Tetrahedron Lett. 1980;21:567–568. [Google Scholar]
- Davies L. P., Taylor K. M., Gregson R. P., Quinn R. J. Life Sci. 1980;26:1079–1088. doi: 10.1016/0024-3205(80)90254-4. [DOI] [PubMed] [Google Scholar]
- Cook A. F., Bartlett R. T., Gregson R. P., Quinn R. J. J. Org. Chem. 1980;45:4020–4025. [Google Scholar]
- Dooley M. J., Quinn R. J. J. Med. Chem. 1992;35:211–216. doi: 10.1021/jm00080a002. [DOI] [PubMed] [Google Scholar]
- Dooley M. J., Quinn R. J. Bioorg. Med. Chem. Lett. 1992;2:1199–1200. [Google Scholar]
- Urban S., Leone P. d. A., Carroll A. R., Fechner G. A., Smith J., Hooper J. N. A., Quinn R. J. J. Org. Chem. 1999;64:731–735. doi: 10.1021/jo981034g. [DOI] [PubMed] [Google Scholar]
- Grkovic T., Pouwer R. H., Vial M. L., Gambini L., Noél A., Hooper J. N., Wood S. A., Mellick G. D., Quinn R. J. Angew. Chem., Int. Ed. 2014;53:6070–6074. doi: 10.1002/anie.201402239. [DOI] [PMC free article] [PubMed] [Google Scholar]
- Wang D., Feng Y., Murtaza M., Wood S., Mellick G., Hooper J. N. A., Quinn R. J. J. Nat. Prod. 2016;79:353–361. doi: 10.1021/acs.jnatprod.5b00987. [DOI] [PubMed] [Google Scholar]
- Vu H., Pedro L., Mak T., McCormick B., Rowley J., Liu M., Capua A. D., Williams-Noonan B., Pham N. B., Pouwer R., Nguyen B., Andrews K. T., Skinner-Adams T., Kim J., Hol W., Hui R., Crowther G. J., Voorhis W. C. V., Quinn R. J. ACS Infect. Dis. 2018;4:431–444. doi: 10.1021/acsinfecdis.7b00197. [DOI] [PMC free article] [PubMed] [Google Scholar]
- Pedro L., Quinn R. J. Molecules. 2016;21:984. doi: 10.3390/molecules21080984. [DOI] [PMC free article] [PubMed] [Google Scholar]
- Vu H., Roullier C., Campitelli M., Trenholme K. R., Gardiner D. L., Andrews K. T., Skinner-Adams T., Crowther G. J., Van Voorhis W. C., Quinn R. J. ACS Chem. Biol. 2013;8:2654–2659. doi: 10.1021/cb400582b. [DOI] [PubMed] [Google Scholar]
- Shannon P., Markiel A., Ozier O., Baliga N., Wang J., Ramage D., Amin N., Schwikowski B., Ideker T. Genome Res. 2003;13:2498–2504. doi: 10.1101/gr.1239303. [DOI] [PMC free article] [PubMed] [Google Scholar]
- Rogers D., Hahn M. J. Chem. Inf. Model. 2010;50:742–754. doi: 10.1021/ci100050t. [DOI] [PubMed] [Google Scholar]
- Glen R., Bender A., Arnby C., Carlsson L., Boyer S., Smith J. IDrugs. 2006;9:199–204. [PubMed] [Google Scholar]
- Kohonen T. Biol. Cybern. 1982;43:59–69. [Google Scholar]
- Pascolutti M., Campitelli M., Nguyen B., Pham N., Gorse A.-D., Quinn R. J. PLoS One. 2015;10:e0120942. doi: 10.1371/journal.pone.0120942. [DOI] [PMC free article] [PubMed] [Google Scholar]
- Pascolutti M., Quinn R. J. Drug Discovery Today. 2014;19:215–221. doi: 10.1016/j.drudis.2013.10.013. [DOI] [PubMed] [Google Scholar]
- Feng Y., Campitelli M., Davis R. A., Quinn R. J. Mar. Drugs. 2014;12:1169–1184. doi: 10.3390/md12031169. [DOI] [PMC free article] [PubMed] [Google Scholar]
- Schuffenhauer A., Ertl P., Roggo S., Wetzel S., Koch M. A., Waldmann H. J. Chem. Inf. Model. 2007;47:47–58. doi: 10.1021/ci600338x. [DOI] [PubMed] [Google Scholar]
- Varin T., Schuffenhauer A., Ertl P., Renner S. J. Chem. Inf. Model. 2011;51:1528–1538. doi: 10.1021/ci2000924. [DOI] [PubMed] [Google Scholar]
- Matlock M., Zaretzki J., Swamidass S. Bioinformatics. 2013;29:2655–2656. doi: 10.1093/bioinformatics/btt448. [DOI] [PubMed] [Google Scholar]
- Zhang P., Mándi A., Li X.-M., Du F.-Y., Wang J.-N., Li X., Kurtán T., Wang B.-G. Org. Lett. 2014;16:4834–4837. doi: 10.1021/ol502329k. [DOI] [PubMed] [Google Scholar]
- Böttcher S., Di Capua A., Blunt J. W. and Quinn R. J., in Blue Biotechnology: Production and use of marine molecules, ed. S. La Barre and S. S. Bates, Wiley-VCH Verlag GmbH & Co., Weinheim, Germany, 2018, vol. 1, pp. 297–321. [Google Scholar]
- Tajabadi F. M., Campitelli M. R. and Quinn R. J., Springer Science Reviews, 2013, vol. 1, pp. 141–151. [Google Scholar]
- Zdrazil B., Guha R. J. Med. Chem. 2018;61:4688–4703. doi: 10.1021/acs.jmedchem.7b00954. [DOI] [PubMed] [Google Scholar]
- McArdle B. M., Campitelli M. R., Quinn R. J. J. Nat. Prod. 2006;69:14–17. doi: 10.1021/np050229y. [DOI] [PubMed] [Google Scholar]
- Kellenberger E., Hofmann A., Quinn R. J. Nat. Prod. Rep. 2011;28:1483–1492. doi: 10.1039/c1np00026h. [DOI] [PubMed] [Google Scholar]
- Sturm N., Quinn R. J., Kellenberger E. Planta Med. 2018;84:304–310. doi: 10.1055/s-0043-121992. [DOI] [PubMed] [Google Scholar]
- Vial M.-L., Zencak D., Grkovic T., Gorse A.-D., Mackay-Sim A., Mellick G. D., Wood S. A., Quinn R. J. J. Nat. Prod. 2016;79:1982–1989. doi: 10.1021/acs.jnatprod.6b00258. [DOI] [PubMed] [Google Scholar]
- Dashti Y., Vial M. L., Wood S. A., Mellick G. D., Roullier C., Quinn R. J. Tetrahedron. 2015;71:7879–7884. [Google Scholar]
- Vijayan V., Rouillard A. D., Rajpal D. K., Agarwal P. Expert Opin. Drug Discovery. 2019:1–4. doi: 10.1080/17460441.2019.1573811. [DOI] [PubMed] [Google Scholar]
- Camacho D. M., Collins K. M., Powers R. K., Costello J. C., Collins J. J. Cell. 2018;173:1581–1592. doi: 10.1016/j.cell.2018.05.015. [DOI] [PubMed] [Google Scholar]