Abstract
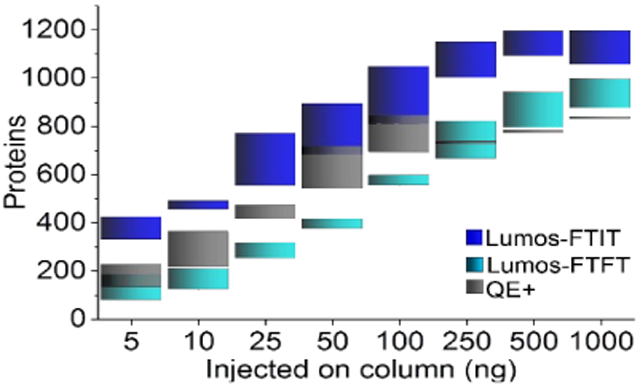
The use of mass spectrometry as a tool to detect proteins of biological interest has become a cornerstone of proteomics. The popularity of mass spectrometry-based methods has increased along with instrument improvements in detection and speed. The Orbitrap Fusion™ Lumos™ mass spectrometer has recently been shown to have better fragmentation and detection than its predecessors. Here, we determined the sensitivity of the Lumos using the NIST monoclonal antibody reference material at various concentrations to detect its peptides in a background of S. cerevisiae whole cell lysate, which was kept at a constant concentration. The data collected by data-dependent acquisition showed that the spiked protein could be detected at 10 pg by an average of 4 peptides in 250 ng of whole cell lysate when the instrument was operated by detecting the peptide masses in the Orbitrap and the fragment masses in the ion trap (FTIT mode). In contrast, when the peptides and fragments were both detected in the Orbitrap on either the Lumos or Q-Exactive Plus (FTFT mode), the lowest concentration of NIST monoclonal antibody detected was 50 pg. The Lumos can detect a single protein at a level 2,500 times lower than the whole cell background and the combination of detecting ions in the Orbitrap and ion trap can improve the identification of low abundance proteins. Furthermore, the total number of proteins identified from decreasing starting amounts of whole cell extracts was determined. The Lumos, when operated in FTIT mode, was able to identify twice as many proteins compared to the Q-Exactive+ at 5 ng of whole cell lysate. Similar numbers of proteins were identified on both platforms at higher concentrations of starting material. Therefore, the Lumos mass spectrometer is especially useful for detecting proteins of low abundance in complex backgrounds or samples that have limited starting material.
Keywords: Orbitrap Lumos, Proteomics, Limit of detection, Sensitivity, Mass spectrometry, Data-dependent acquisition
Graphical Abstract
INTRODUCTION
The field of proteomics, the analysis of proteins and protein networks, has become an integral part of systems and cell biology and the use of mass spectrometry (MS) has gained popularity due to its sensitivity and ability to detect up to thousands of proteins in a complex sample.1, 2 One standard for the identification of proteins and post translational modifications (PTMs) within a proteome is multidimensional protein identification technology (MudPIT) which utilizes online 2-phase orthogonal separation of peptides prior to direct introduction into the mass spectrometer by electrospray ionization.3-6 Improvements in separation science and mass spectrometer performance over the last two decades have yielded to the identification of thousands of proteins from a single sample using reverse phase (RP) separation only.7 The use of RP-only separations allows for the analysis of multiple samples in the same time it would take to do a single MudPIT experiment without loss of information. Additionally, the Orbitrap mass analyzer has been commercially available since 2005 and many advances have been made to the instrument configuration to achieve specific goals in proteomics.8, 9 The newest member of this family is the Orbitrap Fusion™ Lumos™ mass spectrometer (Lumos), which comes equipped with two mass analyzers and three fragmentation types with the ability combine fragmentation schemes. Additionally, it is capable of achieving resolving powers of >450,000 and has an analyzer range up to 6,000 m/z. The ability to adjust the instrument parameters for a specific experiment makes it useful for a variety of samples.
Recent studies on the Orbitrap Fusion™ Lumos™ mass spectrometer (Lumos) include investigating various fragmentation types for additional peptide analysis,10, 11 proteome coverage from human breast cancer cells,12 quantitative protein identification from S. cerevisiae13, and PTM analyses.10, 14 In this study, we aimed to understand the limits of peptide and protein identification of a standard protein digest in a complex matrix background, namely the NIST reference monoclonal antibody (mAb) spiked in S. cerevisiae whole cell lysate using a generic proteomic workflow on the Lumos. The results presented herein compare the performance of the Lumos mass spectrometer operated in two different modes to the Q-Exactive Plus (QE+) (Thermo, Bremen, Germany). The Lumos was used to detect the peptide precursors in the Orbitrap and the peptide fragments in the Orbitrap (Lumos-FTFT) or ion trap (Lumos-FTIT). The data was acquired in triplicates on the Lumos operated in both modes and compared from triplicate datasets collected on a QE+. The sensitivity of the Lumos-FTIT allowed us to detect peptides from the NIST mAb at concentrations down to 10 pg, which in these experiments was 2,500 times less than the background proteome. Additionally, the reproducibility of the LC chromatography and mass spectrometer detection could be determined from the number of proteins identified in the yeast proteome background. Our results show that the variability of detection on the Lumos is low for replicate analyses.15
EXPERIMENTAL PROCEDURES
Materials.
Ammonium acetate, acetonitrile, MS grade water, 2-Chloroacetamide (CAM), and formic acid were purchased from Sigma (Darmstadt, Germany). Tris(2-carboxyethyl)phosphine hydrochloride (TCEP) was obtained from Thermo Fisher Scientific (Waltham, MA). Endoproteinase Lys-C and trypsin were from Promega (Madison, WI). Bulk reverse phase material (5μm Aqua) was purchased from Phenomenex (Torrance, CA). The NIST monoclonal antibody reference material 8671 was purchased from the National Institute of Standards and Testing (Gaithersburg, MD) and diluted for use without further sample preparation.
Yeast Whole Cell Lysate Preparation.
Yeast (S288C) was grown overnight to an OD600=1.5 in YPD media. The cells were pelleted by centrifuging at 6000 × g for 6 minutes at 4 °C. Cells were resuspended in TAP extraction buffer (40 mM HEPES-KOH, pH 7.5, 10% glycerol, 350 mM NaCl, 0.1% Tween-20, 1 mM PMSF, 0.5 mM DTT) and lysed by freezing in liquid nitrogen. Proteins were extracted by breaking the cells using a blender (Waring Commercial). Heparin (Sigma) and salt active nuclease (ArticZymes, Tromso, Norway) were added for 20 minutes at room temperature before proteins were separated from cellular material by centrifuging for 15 minutes at 4000 rpm at 4 °C on a table top centrifuge (Eppendorf 5810-R). The supernatant was reserved, and the cell pellet resuspended in TAP extraction up to 6 times to extract all soluble proteins. The supernatants were pooled and further clarified by centrifuging at 14, 000 rpm for 30 minutes at 4 °C using a tabletop centrifuge (Beckman Coulter Microfuge 22R). Protein content was quantitated using the Pierce BCA Protein Assay (Thermo Fisher Scientific).
Protein Digestion.
Yeast whole cell lysate or the NIST mAb, Humanized IgG1κ Monoclonal Antibody (Refimab Reference material 8671), was denatured by adding 8 M urea and disulfide bonds were reduced with 5 mM TCEP for 30 minutes before modifying the cysteine residues by carbamidomethylation (10 mM CAM, for 30 min in the dark). Endoproteinase Lys-C was added, and proteins digested overnight at 37 °C. Urea was diluted to 2 M with 100 mM Tris-HCl, pH 8.5 before adding trypsin to digest overnight at 37 °C. The digestion reaction was quenched by the addition of formic acid to 5%. Peptides were stored at −20 °C until use.
Peptide Separation.
The NIST monoclonal antibody (NIST mAb) digest was diluted to the final concentration with buffer A (5% acetonitrile (ACN), 0.1% formic acid (FA) in water) and spiked into 250 ng of yeast whole cell lysate, which had been diluted in the buffer A. The samples were injected in triplicate using the auto-sampler on an UltiMate 3000 liquid chromatography system (Thermo Scientific) connected inline to the Q Exactive Plus or Orbitrap Fusion™ Lumos™ Tribrid Mass Spectrometer (Thermo Scientific) fitted with the Nanospray Flex NG ion source. Peptides were trapped on a hand-made 100 μm i.d. fused silica microcapillary packed with 15 cm reverse phase (5 μm Aqua,) and equilibrated with 2% buffer B (80% ACN, 0.1% FA in water) for 15 minutes at a flow rate of 300 nL/min before increasing the concentration of buffer B to 7% over 5 minutes. A linear gradient to 32% buffer B over 122 minutes was used to elute the majority of the peptides before increasing buffer B to 95% over 15 min and holding for an additional 12 minutes. The column was re-equilibrated with 2% buffer B before the next injection.
Mass Spectrometry.
The eluted peptides were ionized for detection by the Orbitrap Fusion™ Lumos™ Tribrid Mass Spectrometer (Lumos) or Q Exactive Plus (QE+) mass spectrometer. Source conditions for both instruments were as follows: voltage, 2.5 kV, transfer tube temperature, 275 °C. Peptides (MS1) were detected in the Orbitrap with the following settings: Lumos resolving power 60,000, QE+ resolving power 70,000; scan range m/z 400-1600; S-Lens RF 55%; Lumos AGC target 4.0 × 10⁵, QE+ AGC target 1.0 × 10⁶; microscans, 1. The top 15 peptides were selected in a data dependent mode for MS/MS fragmentation by CID at 35% NCE (Lumos) or HCD at 27% NCE (QE+) to be detected in the Orbitrap (Lumos resolving power 15,000 or QE+ resolving power 17,500) or ion trap on the Lumos with dynamic exclusion for 30 s with the Lumos AGC target set to 1.0 × 10⁴ and QE+ AGC target at 1.0 × 10⁵.
Data Analysis.
All datasets were searched with the ProLuCID search engine (v. 1.3.3)7 against the S. cerevisiae database downloaded from NCBI updated on May 16, 2017 with the NIST mAb sequence added as well as 160 common contaminants. The database also contained the shuffled protein sequences to estimate false discovery rates (FDRs). The result files from ProLuCID were further processed with DTASelect (v 1.9)16 to correlate peptide level information into protein information. Using in-house developed software, swallow, the peptide spectrum matches were maintained at FDR less than 5% for peptide and protein level matches. The datasets were compared using Contrast16 and quantitated using our in-house software NSAF7 (v 0.0.1).17
Data Accessibility.
The mass spectrometry data have been deposited to the ProteomeXchange Consortium with the identifiers PXD009441 and PXD009548 for the Sc_WCL_NIST and Sc_WCL datasets, respectively. Original data underlying this manuscript may also be accessed after publication from the Stowers Original Data Repository at http://www.stowers.org/research/publications/libpb-1240.
Reviewer account details for Sc_WCL_NIST:
Username: reviewer06921@ebi.ac.uk
Password: WROSyp9L
Reviewer account details for Sc_WCL:
Username: MSV000082296
Password: ML01146
RESULTS AND DISCUSSION
Lower limit of detection of a spiked standard into a complex matrix background
The NIST monoclonal antibody Reference Material 8671 (NIST mAb) was used as the standard protein for the spiked experiments. It was chosen because the molecule has been analyzed by multiple mass spectrometry techniques,18 had an easily accessible protein sequence, was a large protein that would generate many peptides for detection, and should be available for purchase with consistent quality of production. The digested NIST mAb was diluted to varying final concentrations into 250 ng of yeast whole cell lysate. The spiked peptide mixture was detected in data dependent acquisition to determine the lower limit of detection of a single protein of known amount in a complex matrix background. Each sample at each concentration was injected in triplicate (Supplemental Table S1A).
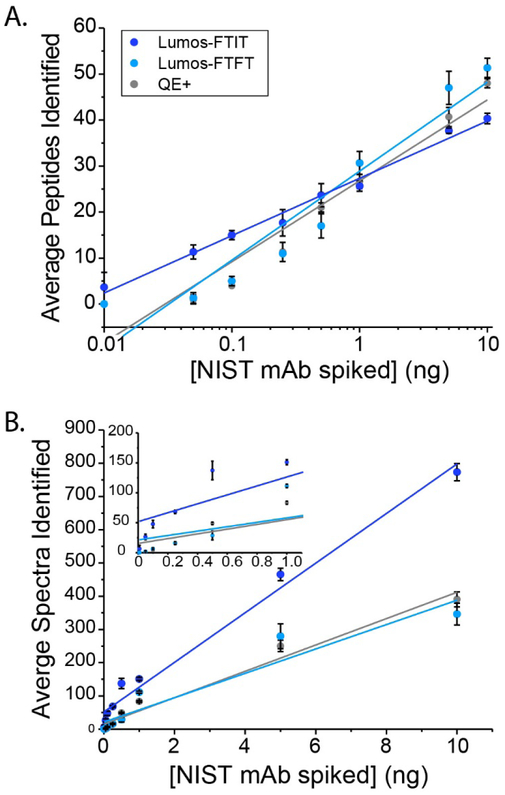
The average numbers of peptides detected from the NIST mAb at each of the tested concentrations followed a logarithmic function (Figure 1A). The number of peptides detected was consistent between the QE+ and the Lumos-FTFT, in which the data was collected in a similar manner, with fewer peptides being detected at lower concentrations but more unique peptides identified as the amount of spiked protein increased (Figure 1A). An average of four peptides from the NIST monoclonal antibody (Figure 1A) were detected at the lowest tested concentration (10 pg = 67.6 amol), only when MS/MS spectra were detected in the ion trap, which scans faster than the Orbitrap. While similar numbers of peptides were detected at 500 pg and 1 ng of spiked NIST mAb, the Lumos-FTIT was more sensitive at lower concentrations than the QE+ and Lumos-FTFT.
Figure 1. Average number of peptides (A) or spectra (B) from the spiked NIST mAb identified in a whole cell background.
The data was collected on the QE+ (gray) and Lumos in FTFT mode (cyan) or FTIT mode (blue). The error bars represent standard deviations (n = 3). The inset graph in (B) enlarges the x-axis from 0 to 1.1 ng to expand the data points for the six lower amounts. The spectral counts were linear across the concentration range, with linear regressions, plotted as lines, with the following equations: y=74.7x + 51.7 for Lumos-FTIT (R2=0.98), y=36.7x + 21.2 (R2=0.90) for the Lumos-FTFT, and y=39.7x + 15.4 (R2=0.97) for QE+.
Furthermore, the average number of spectral counts for the NIST mAb was calculated at each concentration from the three replicate analyses (Figure 1B). The total number of spectral counts for each concentration was graphed against the known concentration of spiked antibody into the whole cell lysate (Figure 1B). The response for all the instruments was linear over the range of concentration analyzed (see Figure 1B inset for lower range). The data from the QE+ (gray) and Lumos-FTFT (cyan) overlaid closely, indicating that there is little difference in sensitivity between these instruments operated similarly. The response from the Lumos-FTIT (blue) had a greater slope and reached higher average spectral counts than the QE+ or the Lumos-FTFT as expected due to the increased MS/MS spectral acquisition speed.
Proteins with concentrations up to 2,500 times lower than the total background proteome can be confidently detected by multiple peptides and spectra in a data-dependent manner. At 10 pg of spiked NIST mAb, there were four peptides identified on average matched to seven spectra. These results indicate that for proteins of low abundance in a whole cell lysate background, the best sensitivity is obtained when the mass spectrometer collects MS1 in the Orbitrap and the MS/MS in the ion trap. For proteins of higher abundance, the scan speed of the MS/MS becomes less important for detection.
Sequence coverage of the NIST mAb
The peptides detected at various concentrations were monitored to determine the sequence coverage of the NIST mAb in a complex matrix background. The NIST mAb served as a good spiked-in protein because the intact dimer of light and heavy chains is disrupted during sample preparation generating two independent proteins chains of different lengths. Furthermore, the two light and two heavy chains that compose the intact mAb are identical in nature creating less variability in the analysis.
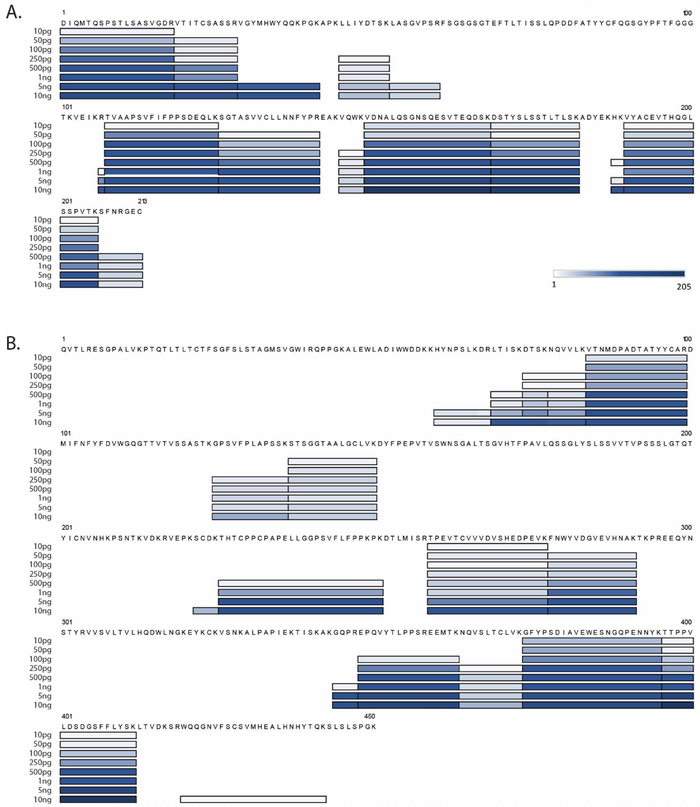
The sequence covered for the light or heavy chains has been plotted along the protein sequence at the various concentrations analyzed on the Lumos-FTIT (Figure 2 and Supplemental Table S1B). As expected, the sequence coverage of the monoclonal antibody increased as the concentration increased. When detected on the Lumos-FTIT, the light chain increased from 25.1% to 73.2% from 10 pg to 10 ng of monoclonal antibody spiked, respectively. Similarly, the heavy chain sequence coverage increased from 12.5% to 43.8% across the order of magnitude concentration difference. These values have a strong correlation with the number of peptides identified from each sample (Figure 1A). Therefore, if higher protein sequence coverage is desirable, more protein will need to be present in the sample, dependent on the properties of the protein such as length of tryptic peptides, protein length, and the potential for post-translational modifications.
Figure 2. Quantitative sequence coverage from peptides identified for the NIST mAb light chain (A) and heavy chain (B) analyzed at various concentrations on the Lumos-FTIT.
The bars are shaded based on the average number of spectra detected as shown on the color-scale in (A).
Sensitivity assessment using decreasing amounts of whole cell extracts
Yeast whole cell lysate (WCL) proteins were detected by data-dependent acquisition concurrently with the NIST mAb. The spectral counts, peptides, and proteins were assessed to determine the consistency of the detection with complex samples. The total protein amount for the whole cell lysate was 250 ng based on the protein assay performed prior to digestion. The total number of proteins detected was highest on the Lumos-FTIT (average 1202), followed by the QE+ (average 725), and then the Lumos-FTFT (average 672). Spectral counts and peptides identified were also quantitated across the replicate runs (Supplemental Table S1C). The relative standard deviation for these measurements ranges from 6.4-12.3% when the Lumos was operated in the FTIT mode, which is lower than or similar to errors previously reported on Orbitrap instruments.19
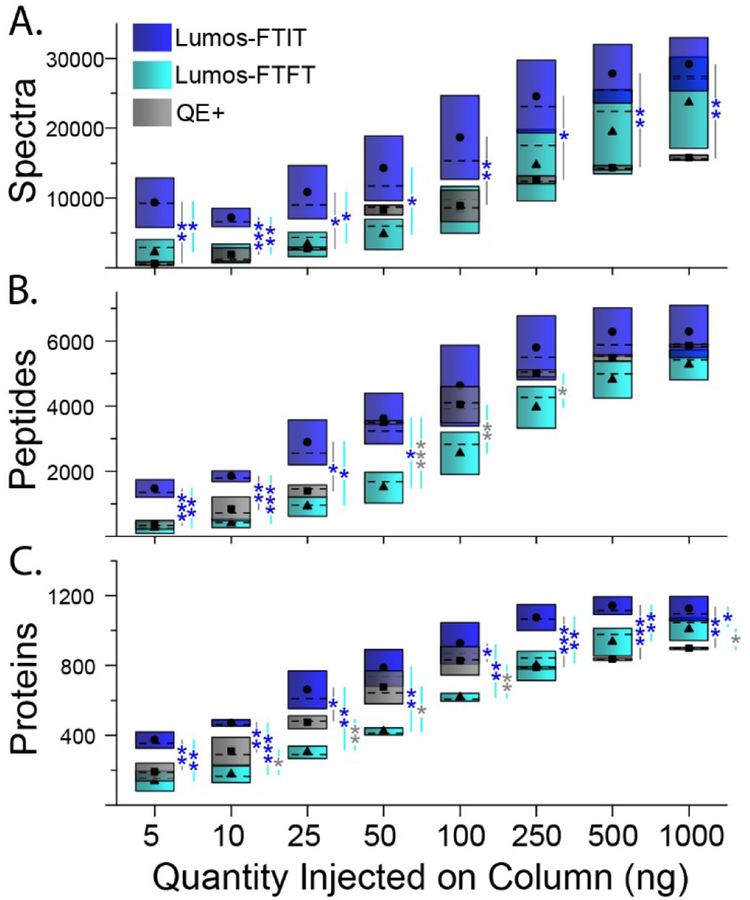
Previous studies using a HeLa digest analyzed on the Lumos mass spectrometer have reported the number of peptides and proteins identified by reverse phase elution.10 Espadas et. al. observed an increase in detected proteins of approximately 26% when the digest concentration was increased from 100 ng to 1000 ng.10 We observed similar increases in protein identification when increasing the concentration of yeast whole cell lysate (Figure 3 and Supplemental Table S2A). We further decreased the concentration of starting whole cell lysate to determine the number of proteins that could be identified from as low as 5 ng of whole cell lysate analyzed. The number of spectra, peptides, and proteins identified showed a logarithmic trend from 5 ng to 1000 ng injected on column with the Lumos operated in FTIT mode (Figure 3A-C and Supplemental Table S2B). A t-test was performed across the technical replicates to determine significant differences in spectra, peptides, and proteins counts measured on the three platforms (Figure 3A-C and Supplemental Table S2B). Overall, for all tested protein amounts, the spectra and proteins counts observed for the Lumos-FTIT were statistically greater than the ones measured on the other two instruments (blue asterisks in Figure 3; Supplemental Table S2B). The main differences in peptide counts between the platforms were observed in the lower range of protein amounts (50 ng and below). There were no significant differences in the spectral counts obtained on the Lumos in FTFT mode compared to the QE+ and few differences in their peptides and proteins numbers (gray asterisks in Figure 3), in agreement with their similar mode of MS acquisition. Compared to the Lumos in FTFT mode or the QE+, the Lumos operated in FTIT mode showed the greatest sensitivity with the largest number of spectra, peptides, and proteins identified at the lowest concentration. Similar to previous reports, we observed decreases in spectra, peptides, and proteins identified when MS/MS spectra were detected in the Orbitrap compared to the ion trap.10 These results are consistent with more spectra, peptides, and proteins identified with faster scan speeds in the ion trap compared to the Orbitrap.
Figure 3. Descriptive statistics of the number of spectra, peptides, and proteins identified from varying amounts of yeast whole cell lysate.
Different amounts of digested yeast whole cell lysates were injected on RPLC columns and analyzed on the Lumos in either FTIT (dark blue) or FTFT (light blue) modes or on the QE+ (gray). The black symbols within the colored boxes show the averaged values for the spectra (A), peptides (B) and proteins (C), median values are the dashed horizontal black line within the boxes, while the boxes upper and lower boundaries represent the standard deviation. At each of the analyzed amounts, the significance results of a t-test (Supplemental Table S2B) are shown at three levels where *, **, and *** represent p-values lower or equal to 0.05, 0.01, and 0.002, respectively. All analyses were performed in triplicate, except the QE+ data at 10ng and 100ng (n=6).
The coefficients of variation (%CV) decreased as the concentration of whole cell lysate increased (Supplemental Table S2B). However, the large standard deviations observed within the dataset collected on the Lumos appeared to be due to day to day variability as both Lumos datasets were collected in two batches separated by several weeks and on different RP microcapillary columns (Supplemental Table S2C). On the other hand, the QE+ dataset was more reproducible with lower % CV at all analyzed amounts. This agreed with the fact that the QE+ data was acquired continuously, except for two protein amounts (10 and 100 ng) that were collected in two batches (Supplemental Table S2C). When the %CV was recalculated from data acquired within the same batches, substantially better reproducibility was obtained with %CV smaller than 30% for protein amounts greater than 5 ng (Supplemental Table S2C). The %CV was overall the lowest for the number of identified proteins and decreased to less than 1%, on average, from 500 ng of proteins analyzed on all three platforms (Supplemental Table S2B).
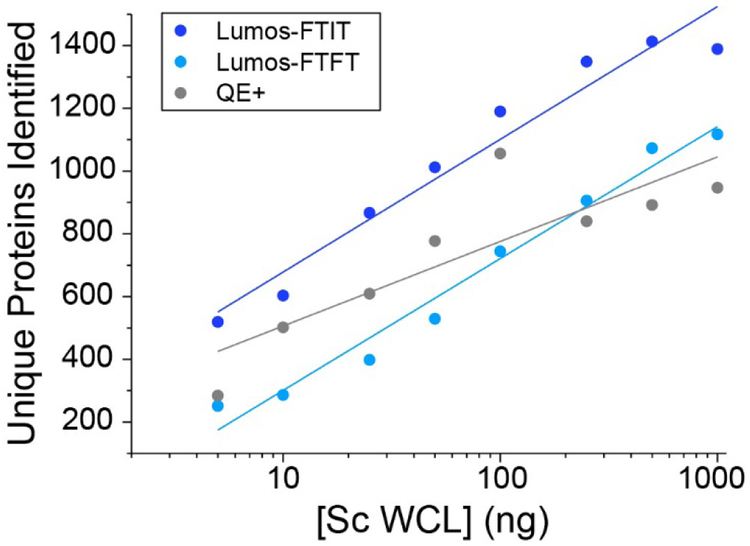
The total number of unique proteins identified was also calculated by merging the technical replicates (Figure 4 and Supplemental Table S2D). The Lumos operated in FTIT mode seemed to reach a plateau at 500 ng of total proteins loaded with no significant changes in peptide/spectra matches and protein identifications at 1000 ng (Figure 4 and Supplemental Table S2D). For direct comparison purposes, liquid chromatography conditions and mass spectrometry settings were kept consistent across the three platforms tested in this study. Notably the same dynamic exclusion (DE) duration (30 sec), repeat counts (1), and number of MS2 scan events (15) were used for all three platforms. However, DE duration can significantly affect the number of matched spectra and identified proteins in a proteomics experiment and should be adjusted to take into account chromatographic peak width and mass spectrometry parameters.20 Optimizing the LC conditions21 and MS parameters for each platform, such as decreasing the DE duration for the faster scanning Lumos-FTIT, would likely increase performance.
Figure 4. Total number of unique proteins identified from varying amounts of yeast whole cell lysate.
Total unique protein counts were combined from the technical replicates for each instrument settings.
CONCLUSIONS
Here, we have shown that the Lumos is able to detect peptides at least 2,500 times lower than the background proteome and that the instrument detection is reproducible across many replicate injections. The ability to detect proteins of low abundance without enrichment has been an ongoing goal of the proteomics field. Therefore, with the advancement of mass spectrometer scan speed and detector sensitivity these goals are becoming achievable. The flexibility of this instrument platform to perform various fragmentation techniques, as well as various mass analyzers to detect the peptides renders it appropriate for multiple types of protein analysis, depending on the goals of the experiments.
Supplementary Material
ACKNOWLEDGMENT
The authors would like to thank Yan Hao for preparing the yeast whole cell lysate for the experiments performed.
Funding Sources
This work was supported by the Stowers Institute for Medical Research and the National Institute of General Medical Sciences of the National Institutes of Health under Award Number RO1GM112639 to MPW. The content is solely the responsibility of the authors and does not necessarily represent the official views of the National Institutes of Health.
ABBREVIATIONS
- NIST
National Institute of Standards and Technology
- mAb
monoclonal antibody
- WCL
whole cell lysate
- QE+
Q-Exactive Plus
- FT
Fourier-Transform
- IT
Ion Trap
- MudPIT
Multidimensional Protein Identification Technology
- RP
reverse phase
- LC
liquid chromatography
- DE
dynamic exclusion
Footnotes
Supporting Information.
The following files are available free of charge at http://pubs.acs.org. Table S1 (excel workbook): (A) Proteins detected from 250 ng of Saccharomyces cerevisiae whole cell extracts spiked with varying amounts of NIST mAb and analyzed by RPLC-MS/MS on three different mass spectrometry platforms; (B) Sequence coverage for the light chain (LC) and heavy chain (HC) of the NIST monoclonal antibody in yeast whole cell lysate background; (C) Average detection of proteins from 250 ng of yeast whole cell lysate. Table S2 (excel workbook): (A) Proteins detected from varying amounts of Saccharomyces cerevisiae whole cell extracts analyzed by RPLC-MS/MS on three different mass spectrometry platforms; (B) Descriptive statistics of the numbers of spectra, peptides, and proteins detected from varying amounts of yeast whole cell digests analyzed by RPLC-MS/MS on three different mass spectrometry platforms; (C) Acquisition sequence of yeast whole cell digests datasets; (D) Total number of unique proteins identified from varying amounts of whole cell lysate.
REFERENCES
- 1.Han X; Aslanian A; Yates JR 3rd, Mass spectrometry for proteomics. Curr Opin Chem Biol 2008, 12, (5), 483–90. [DOI] [PMC free article] [PubMed] [Google Scholar]
- 2.Aebersold R; Mann M, Mass spectrometry-based proteomics. Nature 2003, 422, (6928), 198–207. [DOI] [PubMed] [Google Scholar]
- 3.Washburn MP; Wolters D; Yates JR 3rd, Large-scale analysis of the yeast proteome by multidimensional protein identification technology. Nat Biotechnol 2001, 19, (3), 242–7. [DOI] [PubMed] [Google Scholar]
- 4.Wolters DA; Washburn MP; Yates JR 3rd, An automated multidimensional protein identification technology for shotgun proteomics. Anal Chem 2001, 73, (23), 5683–90. [DOI] [PubMed] [Google Scholar]
- 5.Link AJ; Eng J; Schieltz DM; Carmack E; Mize GJ; Morris DR; Garvik BM; Yates JR 3rd, Direct analysis of protein complexes using mass spectrometry. Nat Biotechnol 1999, 17, (7), 676–82. [DOI] [PubMed] [Google Scholar]
- 6.Link AJ; Washburn MP, Analysis of protein composition using multidimensional chromatography and mass spectrometry. Curr Protoc Protein Sci 2014, 78, 23 1 1–25. [DOI] [PubMed] [Google Scholar]
- 7.Xu T; Park SK; Venable JD; Wohlschlegel JA; Diedrich JK; Cociorva D; Lu B; Liao L; Hewel J; Han X; Wong CCL; Fonslow B; Delahunty C; Gao Y; Shah H; Yates JR 3rd, ProLuCID: An improved SEQUEST-like algorithm with enhanced sensitivity and specificity. J Proteomics 2015, 129, 16–24. [DOI] [PMC free article] [PubMed] [Google Scholar]
- 8.Eliuk S; Makarov A, Evolution of Orbitrap Mass Spectrometry Instrumentation. Annu Rev Anal Chem (Palo Alto Calif) 2015, 8, 61–80. [DOI] [PubMed] [Google Scholar]
- 9.Perry RH; Cooks RG; Noll RJ, Orbitrap mass spectrometry: instrumentation, ion motion and applications. Mass Spectrom Rev 2008, 27, (6), 661–99. [DOI] [PubMed] [Google Scholar]
- 10.Espadas G; Borras E; Chiva C; Sabido E, Evaluation of different peptide fragmentation types and mass analyzers in data-dependent methods using an Orbitrap Fusion Lumos Tribrid mass spectrometer. Proteomics 2017, 17, (9). [DOI] [PubMed] [Google Scholar]
- 11.Riley NM; Westphall MS; Hebert AS; Coon JJ, Implementation of Activated Ion Electron Transfer Dissociation on a Quadrupole-Orbitrap-Linear Ion Trap Hybrid Mass Spectrometer. Anal Chem 2017, 89, (12), 6358–6366. [DOI] [PMC free article] [PubMed] [Google Scholar]
- 12.Davis S; Charles PD; He L; Mowlds P; Kessler BM; Fischer R, Expanding Proteome Coverage with CHarge Ordered Parallel Ion aNalysis (CHOPIN) Combined with Broad Specificity Proteolysis. J Proteome Res 2017, 16, (3), 1288–1299. [DOI] [PMC free article] [PubMed] [Google Scholar]
- 13.Paulo JA; O'Connell JD; Everley RA; O'Brien J; Gygi MA; Gygi SP, Quantitative mass spectrometry-based multiplexing compares the abundance of 5000 S. cerevisiae proteins across 10 carbon sources. J Proteomics 2016, 148, 85–93. [DOI] [PMC free article] [PubMed] [Google Scholar]
- 14.Totten SM; Feasley CL; Bermudez A; Pitteri SJ, Parallel Comparison of N-Linked Glycopeptide Enrichment Techniques Reveals Extensive Glycoproteomic Analysis of Plasma Enabled by SAX-ERLIC. J Proteome Res 2017, 16, (3), 1249–1260. [DOI] [PubMed] [Google Scholar]
- 15.Piehowski PD; Petyuk VA; Orton DJ; Xie F; Moore RJ; Ramirez-Restrepo M; Engel A; Lieberman AP; Albin RL; Camp DG; Smith RD; Myers AJ, Sources of technical variability in quantitative LC-MS proteomics: human brain tissue sample analysis. J Proteome Res 2013, 12, (5), 2128–37. [DOI] [PMC free article] [PubMed] [Google Scholar]
- 16.Tabb DL; McDonald WH; Yates JR 3rd, DTASelect and Contrast: tools for assembling and comparing protein identifications from shotgun proteomics. J Proteome Res 2002, 1, (1), 21–6. [DOI] [PMC free article] [PubMed] [Google Scholar]
- 17.Zhang Y; Wen Z; Washburn MP; Florens L, Refinements to label free proteome quantitation: how to deal with peptides shared by multiple proteins. Anal Chem 2010, 82, (6), 2272–81. [DOI] [PubMed] [Google Scholar]
- 18.Schiel JE; Davis DL; Borisov O, State-of-the-art and emerging technologies for therapeutic monoclonal antibody characterization. American Chemical Society: Washington, DC, 2014; p volumes cm. [Google Scholar]
- 19.Krey JF; Wilmarth PA; Shin JB; Klimek J; Sherman NE; Jeffery ED; Choi D; David LL; Barr-Gillespie PG, Accurate label-free protein quantitation with high- and low-resolution mass spectrometers. J Proteome Res 2014, 13, (2), 1034–1044. [DOI] [PMC free article] [PubMed] [Google Scholar]
- 20.Zhang Y; Wen Z; Washburn MP; Florens L, Effect of dynamic exclusion duration on spectral count based quantitative proteomics. Anal Chem 2009, 81, (15), 6317–26. [DOI] [PubMed] [Google Scholar]
- 21.Zhu Y; Zhao R; Piehowski PD; Moore RJ; Lim S; Orphan VJ; Pasa-Tolic L; Qian WJ; Smith RD; Kelly RT, Subnanogram proteomics: impact of LC column selection, MS instrumentation and data analysis strategy on proteome coverage for trace samples. Int J Mass Spectrom 2018, 427, 4–10. [DOI] [PMC free article] [PubMed] [Google Scholar]
Associated Data
This section collects any data citations, data availability statements, or supplementary materials included in this article.
Supplementary Materials
Data Availability Statement
The mass spectrometry data have been deposited to the ProteomeXchange Consortium with the identifiers PXD009441 and PXD009548 for the Sc_WCL_NIST and Sc_WCL datasets, respectively. Original data underlying this manuscript may also be accessed after publication from the Stowers Original Data Repository at http://www.stowers.org/research/publications/libpb-1240.
Reviewer account details for Sc_WCL_NIST:
Username: reviewer06921@ebi.ac.uk
Password: WROSyp9L
Reviewer account details for Sc_WCL:
Username: MSV000082296
Password: ML01146


