Abstract
Time-of-flight (TOF) PET data provide an effective means for attenuation correction (AC) when no (or incomplete or inaccurate) attenuation information is available. Since MR scanners provide little information on photon attenuation of different tissue types, AC in hybrid PET/MR scanners has always been challenging. In this contribution, we aim at validating the activity reconstructions of the maximum-likelihood ordered-subsets activity and attenuation (OSAA) reconstruction algorithm on a patient brain data set. We present a quantitative comparison of joint reconstructions with the current clinical gold standard—ordered-subsets expectation maximization—using CT-based AC in PET/CT, as well as the current state of the art in PET/MR, that is, zero time echo (ZTE)–based AC. Methods: The TOF PET emission data were initially used in a preprocessing stage to estimate crystal maps of efficiencies, timing offsets, and timing resolutions. Applying these additional corrections during reconstructions, OSAA, ZTE-based, and the vendor-provided atlas-based AC techniques were analyzed and compared with CT-based AC. In our initial study, we used the CT-based estimate of the expected scatter and later used the ZTE-based and OSAA attenuation estimates to compute the expected scatter contribution of the data during reconstructions. In all reconstructions, a maximum-likelihood scaling of the single-scatter simulation estimate to the emission data was used for scatter correction. The reconstruction results were analyzed in the 86 segmented regions of interest of the Hammers atlas. Results: Our quantitative analysis showed that, in practice, a tracer activity difference of +0.5% (±2.1%) and +0.1% (±2.3%) could be expected for the state-of-the-art ZTE-based and OSAA AC methods, respectively, in PET/MR compared with the clinical gold standard in PET/CT. Conclusion: Joint activity and attenuation estimation methods can provide an effective solution to the challenging AC problem for brain studies in hybrid TOF PET/MR scanners. With an accurate TOF-based (timing offsets and timing resolutions) calibration, and similar to the results of the state-of-the-art method in PET/MR, regional errors of joint TOF PET reconstructions are within a few percentage points.
Keywords: quantitative analysis, attenuation correction, joint reconstruction, time-of-flight PET
Correction of PET data for photon attenuation is necessary for quantitative reconstruction of the tracer distribution. This correction is typically done by means of a well-aligned and energy-adjusted CT image. Since MR images provide little information on the electron density (closely related to linear attenuation) of different tissue types, the problem of attenuation correction (AC) remains challenging in the current state-of-the-art PET/MR scanners. It was shown that when time-of-flight (TOF) information is available, the attenuation sinogram can be uniquely estimated from the emission data up to a global constant, which translates into a related shape- and position-dependent additive term in the attenuation reconstruction (1,2). This finding has renewed interest in the topic of joint reconstructions of activity and attenuation from emission data, in TOF PET scanners (3–5) as well as in non-TOF PET scanners (6).
Among the methods that have been proposed to determine the global constant in joint estimation are those that incorporate a tissue-intensity prior, which enforces reconstruction of certain tissue attenuation types or values. However, the application of a tissue-intensity prior requires careful consideration because the prior should preferably not hamper the implicit alignment of the joint activity and attenuation reconstructions, solve the missing scale using knowledge of a generic tissue type, and allow patient-specific attenuation values. Furthermore, a convex prior is preferred, to avoid the creation of (possibly additional) local maxima. Nevertheless, the problem of joint activity and attenuation estimation from TOF PET data is not guaranteed to be jointly convex.
To introduce joint reconstruction methods into routine clinical practice, comprehensive validation studies on big patient data sets are necessary. With a focus on comparative studies on the brain, the joint reconstruction method was found to introduce increased bias in the tracer activity reconstructions when compared with an atlas-based AC approach in a collection of 18F-FDG brain scans (3). Contrary to this finding, the accuracy of a different class of joint-estimation methods was analyzed on a population of patient brain scans by Bal et al. (7), who reported that the joint-estimation images were comparable to the gold standard maximum-likelihood expectation maximization reconstructions with CT-based AC. However, this required a plane-dependent scaling to the activity reconstructions. In both studies, the expected scatter estimate of the emission measurements is assumed to be known, and the studies do not tackle the “chicken or egg” problem of the expected scatter and attenuation estimate in joint reconstructions.
In this work, we propose to add a unimodal intensity prior favoring expected soft-tissue attenuation values within an MR-derived soft-tissue mask, similar to the prior proposed by Ahn et al. (4). In the generation of the soft-tissue mask, we exclude pixels close to the soft-tissue boundaries, to ensure that the (implicit) alignment of these boundaries is produced by the joint reconstruction framework and not by the tissue segmentation. Since soft-tissue can be identified in most MR images with relative ease and the soft-tissue photon attenuation is roughly similar between patients, we propose to add only a unimodal soft-tissue–intensity prior. Because the attenuation and activity are determined up to a constant (1,2), imposing the correct attenuation value within a soft-tissue region is enough to ensure a quantitative tracer distribution. Because of the convexity of this prior, it would not adversely affect convergence. Beyond the MR-based soft-tissue mask, the joint-estimation algorithm is then free to estimate patient-specific attenuation values of structures such as cortical bone, air cavities, and implants. Furthermore, we investigate the combined problem of the expected scatter and attenuation estimation. Avoiding the scatter correction, at first we find a biased activity and attenuation pair that best explains the emission measurements. After this, the expected scatter and attenuation estimates are refined progressively in an interleaved manner.
MATERIALS AND METHODS
Data Acquisition
Emission data from a total of 34 brain 18F-FDG patient scans (collected between October 13, 2016, and June 15, 2017) in a dementia study at our institute were acquired using the GE Healthcare Signa PET/MR scanner with a coincidence timing resolution of 390 ps (8). The local institutional review board approved this study, and informed consent was obtained from all subjects. The zero time echo (ZTE) data were acquired using a standard head coil (8-channel HR brain; GE Healthcare) and the following MR sequence: 3-dimensional radial acquisition, flip angle of 0.8, image volume of 110 × 110 × 116 with an isotropic voxel size of 2.4 mm3, 4 averages with a bandwidth of 62.5 kHz, and a total acquisition time of 42 s (9). Before PET/MR acquisition, CT images were obtained using the Siemens Biograph HiRez PET/CT scanner. Patients (weight, 76.9 ± 21.4 kg) were injected with 147.1 ± 20.3 MBq of 18F-FDG and scanned for 20 min roughly an hour after injection (62 min 7 s ± 14 min 46 s). The GE Healthcare PET Reconstruction Toolbox (MP24) was used to preprocess the raw emission data and to estimate the expected scatter contribution.
Preprocessing
Quantitative reconstruction of the tracer activity distribution in joint estimation methods requires accurate data corrections during reconstructions and accurate calibration of the scanner. As reported previously (10–12), ordered-subsets activity and attenuation (OSAA) and ordered-subsets expectation maximization (OSEM) converge to different solutions when the scanner calibrations or the scatter estimates suffer from inaccuracies. To mitigate inaccuracies due to crystal calibration effects, we used the emission data to estimate maps of crystal efficiencies (XE), crystal timing offsets (XTO), and crystal timing resolutions (XTR) (11,12), assuming perfect knowledge of the attenuation and scatter corrections. During data collection, the scanner was calibrated multiple times.
The vendor scatter estimation software was used to produce a scatter estimate, given a particular emission sinogram and attenuation map (based on CT, ZTE (13), or OSAA (2)). Then, an OSEM reconstruction was computed with joint estimation of a global scatter scale factor, as proposed by Salvo et al. (14), and the scatter was scaled accordingly in the further processing.
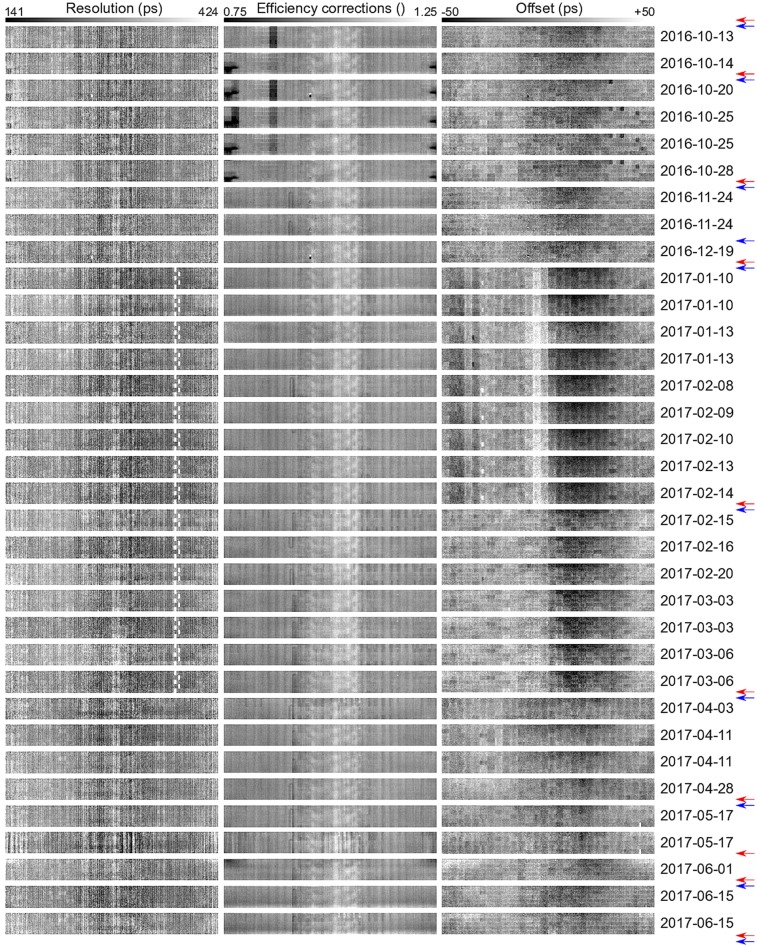
To ensure optimal calibration for each study, the crystal maps were estimated from the patient emission scans themselves. A chronologic view of the crystal maps is shown in Figure 1, which confirms that the scanner is stable between subsequent calibrations.
FIGURE 1.
Crystal map of XTR (left), XE (center), and XTO (right) estimated from emission data. Maps are shown in chronologic (top to bottom) order. Red and blue arrows determine timing and efficiency calibrations on PET/MR scanner, respectively.
Studies
Two scenarios were realized for this study. In the first, joint reconstructions were compared with the gold standard reconstructions with the best practically obtainable estimate of the expected scatter contribution in the emission data, that is, the CT-based estimate of the scatter. In addition to this comparison, activity reconstructions using an atlas-based (vendor-provided) and a ZTE-based attenuation (13,15) correction were also compared with the gold standard reconstruction. The ZTE-based attenuation was computed with a research tool provided by GE Healthcare (version 1.6.2), which is featured in the MP 26 software release of the Signa PET/MR. The second scenario involves the comparison of activity reconstructions when the expected scatter was estimated using the corresponding ZTE-based and joint attenuation images. In the latter case, 3 global iterations, each consisting of a joint reconstruction and a scatter estimation, were applied. A schematic of the studies is depicted in Supplemental Figure 1 (supplemental materials are available at http://jnm.snmjournals.org).
Standard Reconstructions
OSEM activity reconstructions were obtained with 3 iterations and 28 subsets using the CT-based attenuation (after a rigid alignment, using an in-house registration package, obtained by maximizing the normalized mutual information of the CT images to the Dixon in-phase MR sequence images) and the ZTE-based and vendor-provided atlas-based AC factors. The activity images were reconstructed without point-spread function modeling in a 210 × 210 pixel grid of 3.125-mm width transaxially and 89 planes of 2.78-mm width axially. The hardware (i.e., bed and head-coil) attenuation images were read from a template and combined with each of the attenuation images. The OSEM reconstructions using CT-based AC factors were applied as the gold standard.
Joint Reconstructions
The OSAA reconstruction algorithm (2) was used to quantitatively reconstruct the tracer activity distribution and the attenuation image. An MR-based soft-tissue–favoring intensity prior (restricted to a soft-tissue mask) was incorporated in OSAA. The algorithm was initialized with a uniform disk of activity and uniform tissue attenuation in the patient support. This patient body contour was obtained by thresholding the in-phase MR sequence images and the PET emission measurements. The known hardware attenuation images were manually added during reconstruction. To avoid attenuation build-up in the background (i.e., outside the regions with nonnegligible tracer uptake), a trick was used to encourage zero attenuation along lines of zero activity. For such lines, the measured and forward-projected counts were both set to a predefined small positive value, such that the attenuation was (gently) driven to zero in each attenuation update step (16). OSAA reconstructions were then obtained after 3 iterations and 28 subsets (updating the activity once and the attenuation twice in each iteration) using an in-house implementation of the projector. After the OSAA activity and attenuation estimation, the activity image is discarded. “Standard” activity images are then produced by standard OSEM reconstructions (3 iterations of 28 subsets) using the OSAA attenuation estimate to minimize possible differences in the convergence level compared with the gold-standard reconstruction. In the following, we will still use the term OSAA activity images to denote these standard OSEM images obtained using the OSAA attenuation estimate.
MR Prior Design
A soft-tissue mask was generated by thresholding the ZTE MR-based attenuation estimate (15,17,18) to discard air and bone. The mask was then eroded (with a spheric structure with the voxels within a radius of 2 voxels from the central element set to 1) to limit the effects of the intensity prior close to soft-tissue boundaries. A gaussian distribution with a mean expected soft-tissue attenuation of 0.099 cm−1 was used as our soft-tissue–intensity prior, which results in the application of a quadratic penalty to the likelihood. Although the prior was constructed from the ZTE volume, we believe that a similar volume could be estimated from other MR sequences.
Image Analysis
The activity reconstructions (with no postreconstruction smoothing) are compared and evaluated in 86 segmented regions of interest (ROIs) defined by the Hammers atlas (19) and segmented using PMOD, version 3.8 (PMOD Technologies LCC). In our comparative analysis, the mean difference between 2 activity reconstructions, X and Y, was computed in all the segmented ROIs as
where X is considered the reference method. The mean and, in brackets, the SD are reported throughout the text.
RESULTS
Preprocessing
Figure 1 shows the crystal maps in chronologic order estimated in the preprocessing stage. The XTR seem to have a stable structure; however, for acquisitions between January 10, 2017, and March 6, 2017, the time stamps of some crystals were generated by a secondary and less accurate timing mechanism, resulting in a poorer timing resolution for those crystals. This problem was eliminated by (the maintenance before) the calibration of March 28, 2017. During the acquisitions between October 14, 2016, and October 28, 2018, the imaging protocol was to use a flexible mirror on the patient head-coil. Since this extra attenuation was not accounted for in the AC factors, that attenuation was partly modeled by assigning a poorer efficiency to the crystals closest to the mirror (dark region at the crystal map extremes). Apart from this and a slightly less sensitive unit (which was replaced before the October 25, 2016, acquisition), the XE maps also seem to be stable in our data set. However, the XTO map does not seem to be as stable as the other 2 crystal maps; it has a structure that seems to vary between time calibrations on the scanner. Interestingly, there seems to be a strong influence from the less accurate crystal timings (acquisitions between January 10, 2017, and March 6, 2017) on the XTO maps.
For reconstructions in which each of the crystal map corrections was omitted (Supplemental Figs. 2 and 3), we found that correction of XTO had the most noticeable effect on the joint activity and attenuation reconstructions. The XTO problem observed here had been caused by strong assumptions about the phantom positioning during calibration. This problem has recently been solved by making the vendor calibration software insensitive to changes in the exact position of the phantom in the MP 26 software release of the Signa PET/MR.
Qualitative Assessment
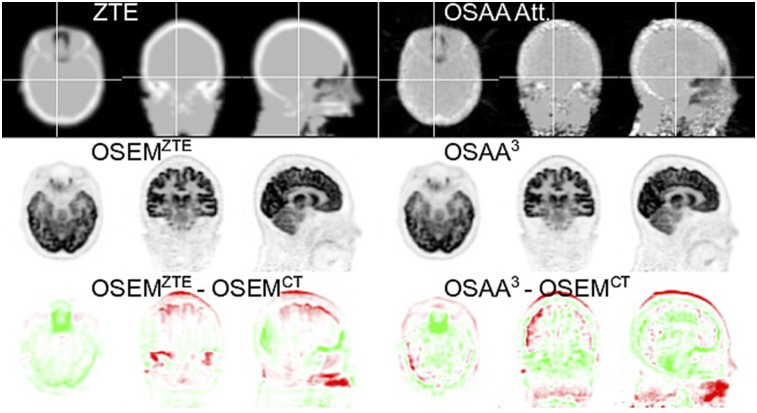
Figure 2 shows OSEM and OSAA activity reconstructions as well as the attenuation images used or estimated for a patient data set for the first reconstruction scenario (i.e., scatter correction using the CT-based expected scatter estimate). Visual inspection of the activity reconstructions seems to show more bias for the atlas-based OSEM reconstruction than for the ZTE-based (also reported previously (18)) and OSAA reconstructions. Furthermore, close inspection of the CT and atlas images reveals missing attenuation near highly attenuating dental implants, which are better recovered in the OSAA attenuation reconstruction and hence are probably better accounted for in the OSAA activity reconstruction. In the OSAA attenuation reconstruction, we observe that the ear canal and surrounding hard bone look remarkably similar to the CT-based attenuation image.
FIGURE 2.
Transaxial, coronal, and sagittal views of attenuation (top), activity (middle), and activity difference from gold standard reconstruction (bottom). CT-based estimate of expected scatter was used during reconstruction. Axial field of view was smaller for CT than for PET/MR; hence, missing planes (neck region) were filled with MR-based attenuation estimate.
Figure 3 shows activity reconstructions when the scatter estimate is computed from the ZTE-based and OSAA attenuation estimates (second scenario). For OSAA, the initial reconstruction was obtained without scatter. This activity reconstruction together with its corresponding attenuation image (not shown here) was used to simulate an expected scatter estimate. The joint reconstruction of activity and attenuation of OSAA were interleaved with the scatter simulation algorithm and iterated 3 times (the intermediate OSAA activity difference images are shown in Supplemental Fig. 4). In the final reconstruction (Fig. 3), visually there does not seem to be a significant difference between activity reconstructions in which the ZTE-based or the OSAA attenuation estimates were used for the expected scatter computation, compared with activity reconstruction with the CT-based expected scatter estimates (Fig. 2).
FIGURE 3.
Transaxial, coronal, and sagittal views of attenuation (top), activity (middle), and activity difference from gold standard reconstruction (bottom). ZTE-based and OSAA attenuation was used to estimate expected scatter. 3 = third iteration.
Quantitative Assessment
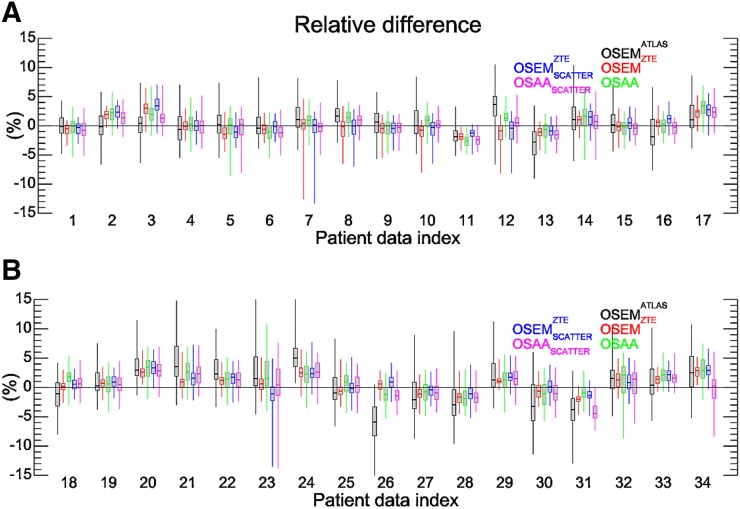
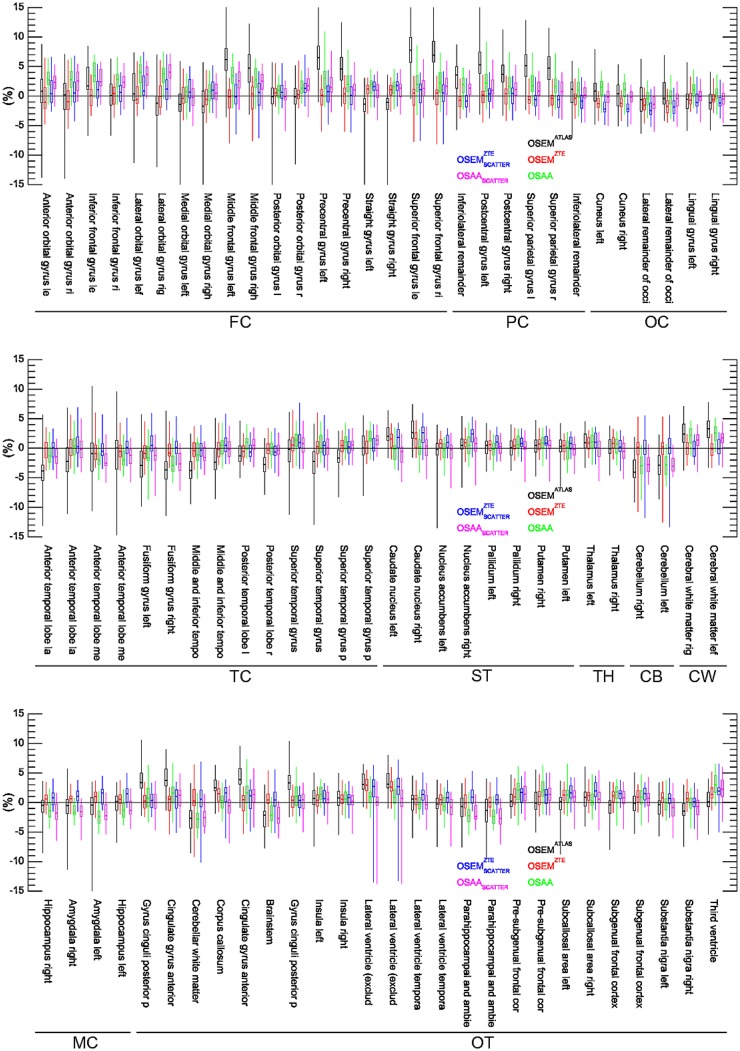
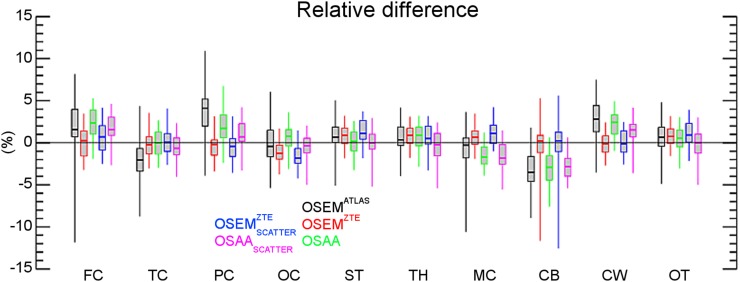
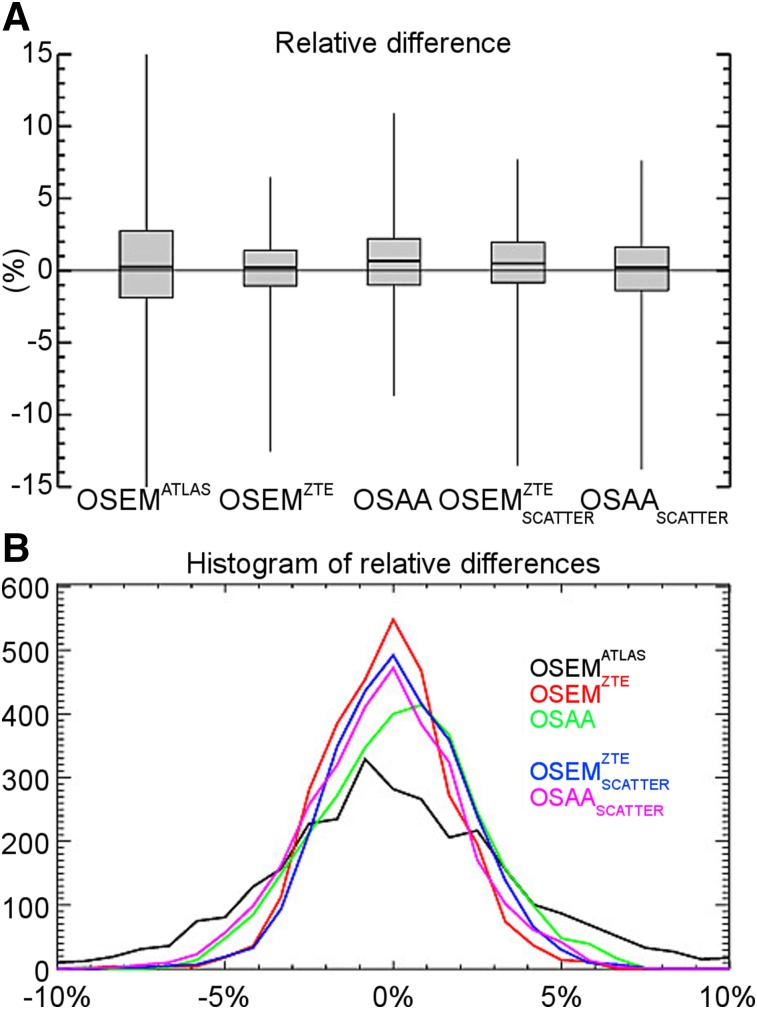
Figures 4, 5, and 6 show box plots of relative differences in all the activity reconstructions in our studies for all patients, the 86 segmented ROIs, and a further classification of the ROIs into 10 different classes in our patient data sets, respectively. The subscript scatter is used to denote the results when the scatter estimate was computed using the ZTE-based and the OSAA as opposed to the CT-based AC. Figure 7 shows the box plots of averages over both ROIs and data sets. For the reconstructions that used the CT-based scatter estimate, all 3 activity reconstructions, that is, with the (vendor-provided) atlas-based, ZTE-based, and OSAA AC, achieved a reasonably low bias of +0.4%, +0.2%, and +0.6%, respectively. However, the methods had varying accuracy levels over all ROIs, with an SD from the mean of 2.7%, 0.8%, and 1.6%, respectively. This variance was also reflected in the range of ROI differences, that is, 50.8% (from −33.2 to +17.6), 19.1% (from −12.6 to +6.5), and 19.6% (from −8.7 to +10.9), respectively.
FIGURE 4.
Box plot of relative differences for the 86 ROIs of the Hammers atlas per patient. (A) Results of patients 1–17. (B) Results of patients 18–34.
FIGURE 5.
Box plot of relative differences for the 86 ROIs of the Hammers atlas averaged over all patient data sets. FC = frontal cortex; PC = parietal cortex; OC = occipital cortex; TC = temporal cortex; ST = striatum; TH = thalamus; CB = cerebellum; CW = cerebral white matter; MC = medial temporal cortex; OT = other.
FIGURE 6.
Box plot of relative differences for 10 classified regions from the 86 ROIs of the Hammers atlas averaged over all patient data sets. FC = frontal cortex; TC = temporal cortex; PC = parietal cortex; OC = occipital cortex; ST = striatum; TH = thalamus; MC = medial temporal cortex; CB = cerebellum; CW = cerebral white matter; OT = other.
FIGURE 7.
(A) Box plot of relative differences averaged over all ROIs and all patient data sets. (B) Histogram of relative differences from gold standard for all ROIs and all patient data sets.
When the ZTE-based and OSAA attenuation estimates were used for the expected scatter estimation in addition to AC, a similar behavior was observed between the reconstructions. The relative difference (over all ROIs and data sets) in the estimated activity distribution produced a bias of +0.5% and +0.1% with an SD of 2.1% and 2.3% for the ZTE-based and OSAA AC reconstructions. Both activity reconstructions had a similar range of ROI differences: 21.2% (from −13.5 to 7.7) and 21.4% (from −13.8 to +7.6), respectively.
Figure 7B shows a histogram of the relative ROI differences of all the regions and all data sets. As discussed above, the 2 cases that could be used in clinical practice when no CT is available (ZTE-based and OSAA AC and expected scatter estimation) seem to perform similarly.
DISCUSSION
The AC problem is more challenging in hybrid PET/MR scanners than in hybrid PET/CT scanners. TOF measurements in PET provide added information on the attenuation, which can be used to mitigate some of the related problems. With an accurate estimate of the expected amount of scatter in the emission measurements, joint reconstruction methods can provide only a scaled reconstruction of the tracer activity distribution. Hence, extra constraining is required for a quantitatively accurate reconstruction of the activity distribution. The most intuitive approach is to constrain the reconstructed attenuation, as was also done in this work.
The OSAA reconstruction algorithm was incorporated with an intensity prior that favored expected soft-tissue attenuation values in an MR-determined tissue mask. The unimodal soft-tissue–intensity prior (a mean of 0.099 cm−1) was enough to correct for the additional degree of freedom (a single scale) in joint reconstructions. The soft-tissue class was selected as the tissue prior of choice not only because it can be segmented from MR images with relative ease but also because of its generic attenuation value across patient populations. During reconstructions, the algorithm was then free to assign any attenuation value to regions with bone, air cavity, dental implant, or other material. The soft-tissue prior mask was eroded to avoid problems related to PET and MR data alignment, and although the ZTE sequence was used to determine this mask, we think that other MR sequences could also be used instead. However, the background trick played a crucial role in limiting the buildup of attenuation in regions outside the activity distribution support. The reconstruction of attenuation outside the patient is not problematic in itself; even with these nonrealistic attenuating structures in the background, the corresponding attenuation sinogram will still be accurate up to a scale factor. But since this background attenuation actually models part of the true object attenuation, that object attenuation must be decreased accordingly to obtain the correct scale factor. Consequently, with nonzero attenuation in the background, imposing tissue attenuation on soft-tissue regions will overestimate the tracer activity distribution. Therefore, the use of prior knowledge of attenuation values in the object must be combined with a regularization that encourages background attenuation to be zero.
An essential requirement for quantitative joint reconstructions is the knowledge of (and hence correction for) the expected amount of scatter in the measured emission data. In this work, we investigated scenarios in which perfect knowledge of the expected scatter (using CT-based scatter estimate) was available, and we compared the reconstructions to a scenario in which this information was not available. With an interleaved updating of the OSAA joint reconstructions and the expected scatter estimate, we showed that accurate tracer activity distributions can be reconstructed. The results were comparable to the state-of-the-art ZTE-based AC in PET/MR.
We have previously observed that joint reconstruction methods converge to a solution other than conventional reconstruction with CT-based attenuation if modeling errors are present (10–12). In a preprocessing stage, we computed crystal map corrections to the systems’ XTO and XTR as well as XE. We have observed before (10–12) that these corrections can influence the reconstructions to different extents. In our patient brain data set, the additional correction for the XTO had the greatest impact on the accuracy of the OSAA activity and attenuation reconstructions (Supplemental Figs. 2 and 3), which visually seemed to be stable between timing calibrations. In our implementation, we observed roughly a 2-fold increase in the processing time in reconstructions with the additional estimation (and correction) for the XE, XTO, and XTR maps.
This study was focused on the analysis of AC methods for TOF PET brain scans. With a similar accuracy to the ZTE-based AC method, we believe that OSAA-based AC can be considered a method of choice, especially when the ZTE MR sequence is not available or is subject to inaccuracies, such as because of metal implants. Our ongoing work is aimed at analyzing joint reconstructions of OSAA on whole-body patient scans for TOF PET/MR.
CONCLUSION
In this contribution, we aimed at the quantitative analysis and validation of joint activity and attenuation reconstructions from TOF PET emission data in brain imaging. Our study demonstrates that the joint activity and attenuation reconstructions from TOF PET provide accurate tracer distribution reconstructions, comparable to the state of the art in PET/MR, that is, ZTE-based AC, as well as the current clinical gold standard, CT-based AC. For OSAA, the expected scatter contribution of the data and the joint reconstructions were updated and refined in an interleaved manner. Contrary to previous findings, we find that with accurate data corrections and scanner calibrations, activity reconstructions can be obtained with close to zero bias and with up to a few percent SD.
DISCLOSURE
This work was supported in part by Research Foundation Flanders (FWO) project G.0275.14N. Ahmadreza Rezaei and Stefanie Willekens are supported by FWO postdoctoral projects, 12T7118N and 12W1418N, respectively. Georg Schramm is supported by NIH under grant NIH P41 EB017183. Gaspar Delso is an employee of GE Healthcare, Cambridge, U.K. Ahmadreza Rezaei, Georg Schramm, Koen Van Laere, and Johan Nuyts have received travel grants from GE Healthcare for attending workshops. Georg Schramm and Koen Van Laere have received travel grants for presenting PET/MR results at GE Healthcare user meetings. KU Leuven received a research collaboration grant from GE Healthcare. No other potential conflict of interest relevant to this article was reported.
Supplementary Material
Acknowledgments
We thank Floris Jansen, Sangtae Ahn, Timothy Deller, and Kristen Wangerin from GE Healthcare for their help and support. We also thank Michel Koole and Nathalie Mertens from the department of Nuclear Medicine and Molecular Imaging, UZ Leuven, for technical help.
KEY POINTS
QUESTION: How does the quantitative accuracy of joint activity and attenuation reconstructions of brain compare with the state-of-the-art activity reconstructions using the ZTE-based AC in TOF PET brain studies?
PERTINENT FINDINGS: Joint activity and attenuation reconstructions provide accurate tracer distribution reconstructions, comparable to the state of the art in PET/MR, that is, ZTE-based AC, as well as the current clinical gold standard, CT-based AC.
IMPLICATIONS FOR PATIENT CARE: In PET/MR studies, when the ZTE MR sequence is not available or is subject to inaccuracies, joint reconstruction methods can be considered the reconstruction method of choice.
REFERENCES
- 1.Defrise M, Rezaei A, Nuyts J. Time-of-flight PET data determine the attenuation sinogram up to a constant. Phys Med Biol. 2012;57:885–899. [DOI] [PubMed] [Google Scholar]
- 2.Rezaei A, Defrise M, Bal G, et al. Simultaneous reconstruction of activity and attenuation in time-of-flight PET. IEEE Trans Med Imaging. 2012;31:2224–2233. [DOI] [PubMed] [Google Scholar]
- 3.Mehranian A, Arabi H, Zaidi H. Quantitative analysis of MRI-guided attenuation correction techniques in time-of-flight brain PET/MRI. Neuroimage. 2016;130:123–133. [DOI] [PubMed] [Google Scholar]
- 4.Ahn S, Cheng L, Shanbhag DD, et al. Joint estimation of activity and attenuation for PET using pragmatic MR-based prior: application to clinical TOF PET/MR whole-body data for FDG and non-FDG tracers. Phys Med Biol. 2018;63:045006. [DOI] [PubMed] [Google Scholar]
- 5.Rezaei A, Deroose CM, Vahle T, Boada F, Nuyts J. Joint reconstruction of activity and attenuation in time-of-flight PET: a quantitative analysis. J Nucl Med. 2018;59:1630–1635. [DOI] [PMC free article] [PubMed] [Google Scholar]
- 6.Ladefoged CN, Law I, Anazodo U, et al. A multi-centre evaluation of eleven clinically feasible brain PET/MRI attenuation correction techniques using a large cohort of patients. Neuroimage. 2017;147:346–359. [DOI] [PMC free article] [PubMed] [Google Scholar]
- 7.Bal H, Panin VY, Platsch G, et al. Evaluation of MLACF based calculated attenuation brain PET imaging for FDG patient studies. Phys Med Biol. 2017;62:2542–2558. [DOI] [PubMed] [Google Scholar]
- 8.Grant AM, Deller TW, Khalighi MM, Maramraju SH, Delso G, Levin CS. NEMA NU 2-2012 performance studies for the SiPM-based ToF-PET component of the GE SIGNA PET/MR system. Med Phys. 2016;43:2334–2343. [DOI] [PubMed] [Google Scholar]
- 9.Wiesinger F, Bylund M, Yang J, et al. Zero TE-based pseudo-CT image conversion in the head and its application in PET/MR attenuation correction and MR-guided radiation therapy planning. Magn Reson Med. 2018;80:1440–1451. [DOI] [PubMed] [Google Scholar]
- 10.Nuyts J, Rezaei A, Defrise M. The validation problem of joint emission/transmission reconstruction from TOF-PET projections. IEEE Trans Radiat Plasma Med Sci. 2018;2:273–278. [Google Scholar]
- 11.Rezaei A, Schramm G, Laere KV, Nuyts J. Data driven time alignment for TOF-PET. In: 2017 IEEE Nuclear Science Symposium and Medical Imaging Conference (NSS/MIC). Piscataway, NJ: IEEE; 2017. [Google Scholar]
- 12.Rezaei A, Schramm G, Laere KV, Nuyts J. Estimation of crystal timings in TOF-PET. In: 2018 IEEE Nuclear Science Symposium and Medical Imaging Conference (NSS/MIC). Piscataway, NJ: IEEE; 2018. [Google Scholar]
- 13.Delso G, Kemp B, Kaushik S, Wiesinger F, Sekine T. Improving PET/MR brain quantitation with template-enhanced ZTE. Neuroimage. 2018;181:403–413. [DOI] [PubMed] [Google Scholar]
- 14.Salvo K, Panin VY, Rothfuss H, Defrise M. ML estimation of the scatter scaling in TOF PET. In: 2015 Fully Three-Dimensional Image Reconstruction in Radiology and Nuclear Medicine Proceedings. Piscataway, NJ: IEEE; 2015. [Google Scholar]
- 15.Sekine T, ter Voert EEGW, Warnock G, et al. Clinical evaluation of zero-echo-time attenuation correction for brain 18F-FDG PET/MRI: comparison with atlas attenuation correction. J Nucl Med. 2016;57:1927–1932. [DOI] [PubMed] [Google Scholar]
- 16.Nuyts J, Dupont P, Stroobants S, Benninck R, Mortelmans L, Suetens P. Simultaneous maximum a posteriori reconstruction of attenuation and activity distributions from emission sinograms. IEEE Trans Med Imaging. 1999;18:393–403. [DOI] [PubMed] [Google Scholar]
- 17.Wiesinger F, Sacolick LI, Menini A, et al. Zero TEMR bone imaging in the head. Magn Reson Med. 2016;75:107–114. [DOI] [PubMed] [Google Scholar]
- 18.Schramm G, Koole M, Willekens SMA, et al. Regional accuracy of ZTE-based attenuation correction in static and dynamic brain PET/MR. ArXiv Phys. 2018. [Google Scholar]
- 19.Hammers A, Allom R, Koepp MJ, et al. Three-dimensional maximum probability atlas of the human brain, with particular reference to the temporal lobe. Hum Brain Mapp. 2003;19:224–247. [DOI] [PMC free article] [PubMed] [Google Scholar]
Associated Data
This section collects any data citations, data availability statements, or supplementary materials included in this article.


