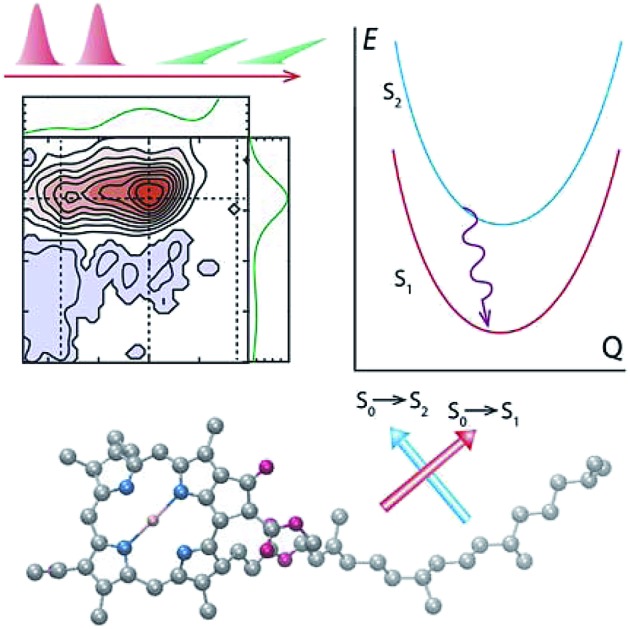
 Using polarized 2D spectroscopy and state-of-the-art TDDFT calculations to uncover the vibronic structure of primary photosynthetic pigments and its effect on ultrafast photoexcited dynamics.
Abstract
Bacteriochlorophyll a (Bchl a) and chlorophyll a (Chl a) play important roles as light absorbers in photosynthetic antennae and participate in the initial charge-separation steps in photosynthetic reaction centers. Despite decades of study, questions remain about the interplay of electronic and vibrational states within the Q-band and its effect on the photoexcited dynamics. Here we report results of polarized two-dimensional electronic spectroscopic measurements, performed on penta-coordinated Bchl a and Chl a and their interpretation based on state-of-the-art time-dependent density functional theory calculations and vibrational mode analysis for spectral shapes. We find that the Q-band of Bchl a is comprised of two independent bands, that are assigned following the Gouterman model to Qx and Qy states with orthogonal transition dipole moments. However, we measure the angle to be ∼75°, a finding that is confirmed by ab initio calculations. The internal conversion rate constant from Qx to Qy is found to be 11 ps–1. Unlike Bchl a, the Q-band of Chl a contains three distinct peaks with different polarizations. Ab initio calculations trace these features back to a spectral overlap between two electronic transitions and their vibrational replicas. The smaller energy gap and the mixing of vibronic states result in faster internal conversion rate constants of 38–50 ps–1. We analyze the spectra of penta-coordinated Bchl a and Chl a to highlight the interplay between low-lying vibronic states and their relationship to photoinduced relaxation. Our findings shed new light on the photoexcited dynamics in photosynthetic systems where these chromophores are primary pigments.
Introduction
Bacteriochlorophyll a (Bchl a) and chlorophyll a (Chl a) are primary pigments found in many photosynthetic systems.1–3 Both pigments play important roles as light-absorbers in photosynthetic antennae and participate in the initial charge-separation steps in photosynthetic reaction centers. Because of their importance, both Bchl a and Chl a have been widely studied4–36 to assess their bio-functional roles and to aid in the design of artificial light-harvesting systems. Of particular interest has been the Q-band absorption that is involved in the energy/charge-transfer processes. The Q-band absorption is described well by the four-orbital Gouterman model.4,7 In this model, following Hückel theory and configuration interaction and accounting for the symmetry of the porphyrin molecule, the lowest unoccupied orbital, eg (LUMO), is twofold degenerate, and the two highest occupied molecular orbitals, a1u (HOMO) and a2u (HOMO–1), are nearly degenerate. Strong interactions between related transitions give rise to the lower energetic Q band and the higher energetic B band, with transition dipole moments (TDMs) within the molecular plane. Symmetry breaking through partial hydrogenation as in Chl a lifts the degeneracy resulting in a splitting of the Q band into two perpendicularly polarized transitions, the blue-shifted Qx and the red-shifted Qy. Further hydrogenation as in Bchl a enhances these trends.37 See illustration of these pigments in Fig. 1.
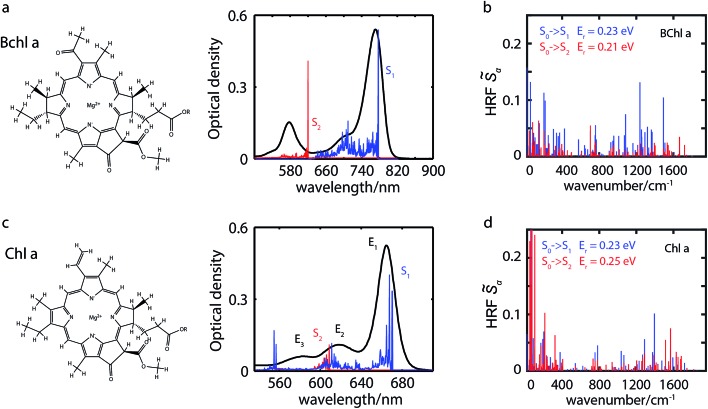
Fig. 1. Molecular structures and absorption spectra (experiment: black lines; calculation: red and blue) of penta-coordinated Bchl a in acetone (a) and Chl a in isopropanol (c). Calculated absorption stick spectra of the vibronic S1 (blue) and S2 (red) excitations are based on Huang–Rhys factors of penta-coordinated Bchl a (b) and Chl a (d), respectively. While low-frequency modes contribute primarily to line broadening, high-frequency modes between 1200 and 1500 cm–1 give rise to vibrational replicas of the fundamental line. In Bchl a vibronic excited states are well-separated between the S1 and S2 excitations, whereas in Chl a a superposition of the S2 fundamental line with S1 overtones is observed.
While the relatively simple Gouterman model can explain the spectra qualitatively, a more comprehensive treatment is required for a quantitative understanding of spectroscopic studies.9,12,25,29,38–42 For example, spectroscopic measurements showed that the polarizations of the Qx and Qy transitions are not orthogonal.8,9,11,36,41,42 The model also fails to quantitatively describe the magnetic circular dichroism (MCD) spectrum.12,29,39,40 A number of studies9,25,29,35,36,38,43 have proposed that vibronic couplings are responsible for such shortcomings of the model.
To resolve these controversies, we use polarized two-dimensional electronic spectroscopy (P-2DES) to investigate the electronic structure and photoexcited dynamics underlying the Q-band of penta-coordinated Bchl a and Chl a. (P-)2DES is particularly suited for this aim and its capability has been demonstrated in many systems including photosynthetic complexes,44–48 organic photovoltaic materials49,50 and quantum dots.51–53 P-2DES has proven to be a sensitive tool for discriminating between different transitions based on their polarizations.54–58 P-2DES also has the advantage over steady-state polarization spectroscopy since it does not require that samples be studied at low temperatures or in viscous solvents. Thus, this approach enables us to study penta-coordinated Bchl a and Chl a, both of which tend to become hexa-coordinated at low temperatures.13,25,29,38,59 Although relatively rarely studied, penta-coordinated Bchl a and Chl a play important roles in many photosystems.59
As spectral features are heavily congested particularly in Chl a, we turn to ab initio calculations to aid in the interpretation of our experimental results. To account for solvent effects on electronically excited states which have been observed in various studies,29,60,61 we employ a recently developed dielectric screening approach based on screened range-separated hybrid (SRSH) functionals and the polarizable continuum model (PCM). This SRSH-PCM approach has been shown to provide quantitatively more accurate orbital energies in the condensed phase than those by simpler RSH-PCM combinations.62 Recent benchmarking of using SRSH-PCM in time-dependent density functional theory (TDDFT) calculations of excited states also presented success in addressing condensed phase effects,63 in particular for the study of related pigments.64
To elucidate the origin of spectral differences and to quantify the limitations of the Gouterman model, we calculate the excited states in both penta- and hexa-coordinated compounds. Through combined studies of P-2DES with TDDFT, a deeper understanding of the electronic structure and relaxation mechanisms underlying the Q band in both Bchl a and Chl a is obtained.
Results and discussion
Absorption spectra of Bchl a and Chl a
The experimental and simulated absorption spectra of penta-coordinated Bchl a and Chl a are displayed in Fig. 1a and c, respectively. The absorption spectrum of Bchl a exhibits two well-separated bands with peak positions at 578 nm and 770 nm. According to the Gouterman model,4,65 these two bands are assigned to the Qx and Qy transitions, respectively. The absorption spectrum of Chl a has a dominant peak at 665 nm and two shoulders at 620 and 588 nm. The peak at 665 nm is assigned to the Qy transition according to previous studies.4,29 However, the assignment of the Qx peak is controversial.5,7,12,29,38,66 It has been proposed to be either of the shorter wavelength peaks in different models.4,7,25,29,35 Because of the dilemma in the peak assignments of Chl a, we will use En to represent the transition from the ground electronic state to the electronic or vibronic state causing the nth observed spectral peak. Calculated adiabatic electronic states are labeled consecutively Si, where S0 represents the electronic ground state.
Calculated electronic excitation energies
We calculate electronically excited state energies of Bchl a and Chl a with a varying number of ligands. Results obtained from the RSH functional ωB97X-D and the SRSH-PCM approach based on the ωPBE functional are listed in Table 1. The calculations for both functionals are performed using the same molecular geometries obtained from ωB97X-D-based optimization. B3LYP-based structures are discussed in Section S8 and S9 of the ESI† for comparison. In both cases, vertical excitation energies are overestimated with respect to the experimental values of the fundamental line. The overestimation might be related to the vibrational reorganization energy. The SRSH-PCM-based minimum-to-minimum energy differences between ground and excited states show excellent agreement with experiment for penta-coordinated Bchl a with 1.64 eV (S1) and 2.04 eV (S2) and reasonable agreement for Chl a with 2.00 eV (S1) and 2.19 eV (S2), respectively. Excitation energy gaps, ΔE, are in both cases in very good agreement with experimental values and confirm the suggested peak assignment. The E2 – E1 energy gaps of 0.54 eV in Bchl a, Fig. 1a, and of 0.14 eV in Chl a, Fig. 1c, are well reproduced by the calculated S2–S1 values of 0.40 eV and 0.17 eV, respectively. The ωB97X-D calculations, on the other hand, predict a larger energy gap in Chl a than in Bchl a. These findings illustrate the superiority of the SRSH-PCM approach over the unscreened RSH-PCM alternative. We will therefore restrict further analysis to the SRSH-PCM results.
Table 1. Calculated electronic excitation energies and experimental absorption energies for the tetra-, penta-, and hexa-coordinated Chl a and Bchl a, respectively. Absorption energies of the hexa-coordinated Chl a (in pyridine) are taken from ref. 25, and of Bchl a (in dimethylformamide) from ref. 59.
| Coordination |
RSH-PCM ωB97X-D |
SRSH-PCM ωPBE |
Experiment |
||||||
| 4 | 5 | 6 | 4 | 5 | 6 | 5 | 6 | ||
| Chl a | S1 [eV] | 2.12 | 2.11 | 2.11 | 2.15 | 2.13 | 2.14 | 1.86 (665 nm) | 1.85 (ref. 25) (671 nm) |
| S2 [eV] | 2.57 | 2.52 | 2.45 | 2.36 | 2.30 | 2.23 | 2.00 (620 nm) | 1.93 (ref. 25) (640 nm) | |
| ΔE [eV] | 0.45 | 0.41 | 0.34 | 0.21 | 0.17 | 0.09 | 0.14 | 0.08 | |
| Bchl a | S1 [eV] | 2.08 | 2.07 | 2.15 | 1.83 | 1.84 | 1.87 | 1.61 (770 nm) | 1.61 (ref. 59) (771 nm) |
| S2 [eV] | 2.37 | 2.29 | 2.26 | 2.31 | 2.24 | 2.19 | 2.15 (578 nm) | 2.03 (ref. 59) (610 nm) | |
| ΔE [eV] | 0.29 | 0.22 | 0.11 | 0.48 | 0.40 | 0.32 | 0.54 | 0.42 | |
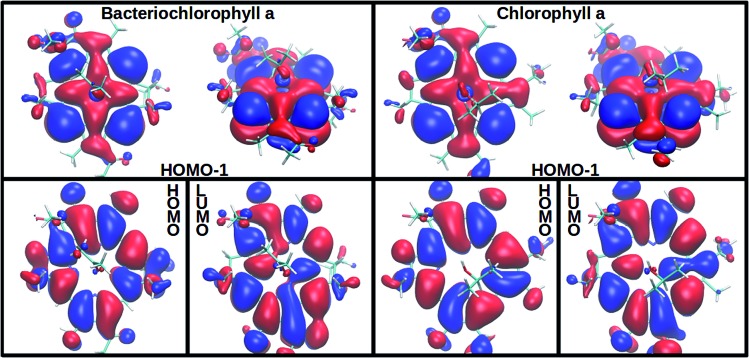
In agreement with experimentally observed trends,60 the increased coordination as reported in Table 1 is found to decrease the S2 excitation energy. This trend can be traced back to the underlying molecular orbitals. In both molecules, the S1 state is formed by a HOMO–LUMO transition with a coefficient of more than 0.95. The S2 state consists primarily of a (HOMO–1)–LUMO transition (>0.90). The dominant orbital transitions of the S1 and S2 states correspond to the ones constituting the Qy and Qx excitation according to the Gouterman model.4,7 We will therefore associate the S1 (S2) state with Qy (Qx) in the following. Fig. 2 shows the three relevant orbitals of the penta-coordinated Bchl a (left) and Chl a (right). Importantly, only the HOMO–1 accumulates significant electron density in the immediate proximity of the central Mg ion. Its energy is thus significantly more destabilized by ligation than the HOMO and LUMO energies. Orbitals and orbital energies are listed in Fig. S5–S10 and Tables S2–S5 in the ESI.†
Fig. 2. Among the three frontier orbitals forming the S1 (HOMO → LUMO) and the s2 (HOMO–1 → LUMO) state of the penta-coordinated compounds, Bchl a (left) and Chl a (right), only the HOMO–1 shows significant electron density at the central Mg ion. Its destabilization through ligation thus reduces the S2 excitation energy (see Table 1).
Vibrational structure
To elucidate the role of nuclear degrees of freedom, vibrational normal modes are calculated at the optimized ground-state geometry of the penta-coordinated molecules. Displacement vectors to geometries of excited state minima are projected onto the set of normal modes to obtain the Huang–Rhys factors67,68 (HRFs) S[combining tilde]αi, which are shown in Fig. 1b and d. For the first excited Bchl a state, a particularly large HRF is found at 1239 cm–1, corresponding to 0.15 eV (see Fig. 1c, blue lines). This supports the interpretation of the shoulder at ∼700 nm in Fig. 1a as the first vibrational replica of the S1 (Qy) excitation. The same mode is activated in the S2 (Qx) excitation alongside higher frequency modes (red lines). However, the HRFs are about 5 times smaller and the shoulder is thus less prominent in the Qx absorption band. In Chl a (Fig. 1d), large HRFs for both excitations, S1 and S2, are found at 1395 cm–1 (0.17 eV) and 1568 cm–1 (0.19 eV), respectively, which is close to the S2–S1 excitation energy gap. Neglecting a potential mixing of electronic states (see discussion below), these findings indicate that the first vibrational replica of the Qy excitation, Qy1, overlaps with the Qx fundamental line, Qx0, resulting in the E2 absorption line. Consequently, the second overtone Qy2 overlaps with the first overtone Qx1, giving rise to the third absorption line E3 (see Fig. 1c). While these assignments are energetically in excellent agreement with spectra of both compounds, Bchl a and Chl a, the relative intensities between fundamental lines and overtones are not accurately described by a single active mode. In particular for Chl a, the observed high intensity of the E3 line relative to the E2 signal cannot be explained by the slightly smaller HRF found in the S2 state. To investigate if this deviation could be due to the remaining modes, spectra σi(E) (Fig. 1a and c) were calculated as follows:69
 |
1 |
where the oscillator strengths, ΩS1,S0 = 0.47, ΩS2,S0 = 0.18 for Bchl a and ΩS1,S0 = 0.39, ΩS2,S0 = 0.07 for Chl a, are assumed to be constant within the Condon approximation. The Franck–Condon factors,  , are determined from the HRFs of all vibrational modes and their occupancy mαn in the nth vibronic state. States with excitation energies
  of up to two vibrational energy quanta
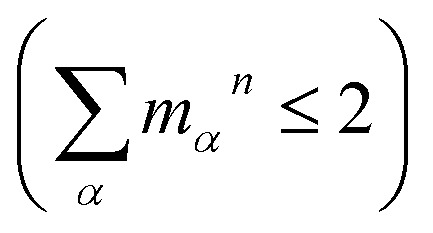 are considered. Energy differences are calculated between the minima of the electronic ground state and the excited states: Ex,S1 = 1.64 eV and Ex,S2 = 2.04 eV in Bchl a and Ex,S1 = 2.00 eV and Ex,S2 = 2.18 eV for Chl a. The absorption spectra are reproduced using a Gaussian function (f(E)) with a full width at half maximum energy of εFWHM = 1 meV giving rise to the spectra in Fig. 1a and c. The spectra are normalized to the E1 peak intensity and shifted by 0.045 eV for Bchl a and by 0.150 eV for Chl a to account for the overestimation of calculated excitation energies. The relative intensities between the Qy and Qx fundamental lines and between these lines and higher vibrational states are in good agreement with the absorption spectra. However, if broadening effects are considered (εFWHM = 40 meV, see in Fig. 3e and 4e), the vibrational replicas obtain significantly higher intensities than observed in the experiment. This deviation cannot be explained by a potential overestimation of reorganization energies Er, whose correction would yield insufficient intensity in the E3 peak. We therefore expect either a violation of underlying assumptions, such as the harmonic approximation and the Condon approximation, or vibronic coupling between electronic states altering the predicted intensities.
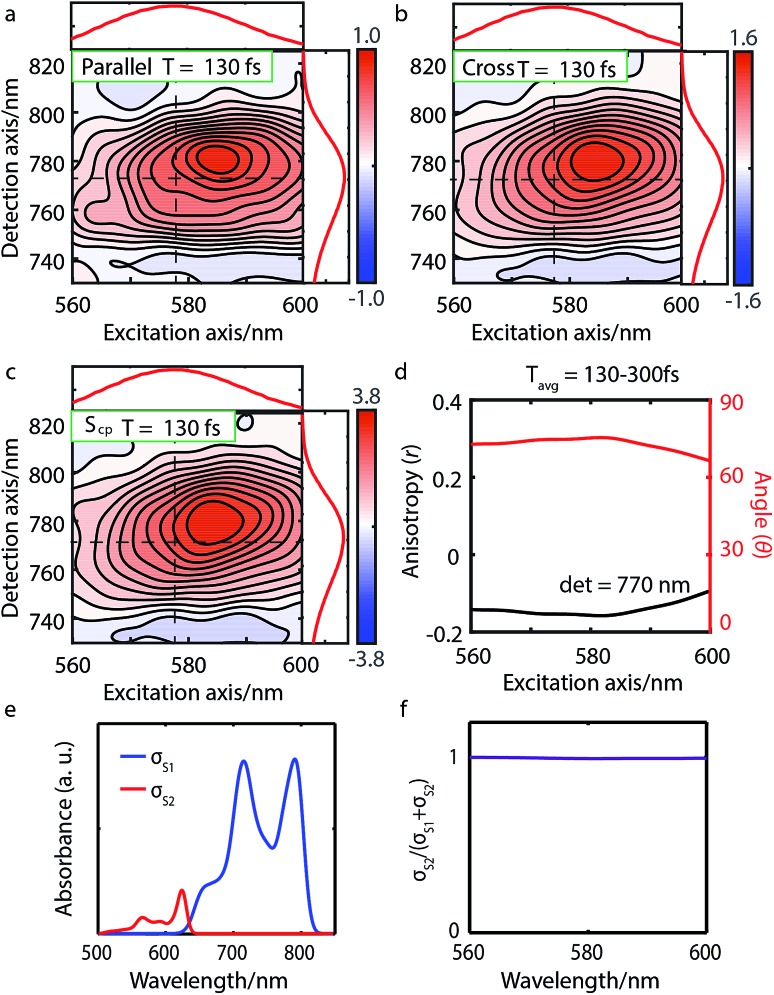
Fig. 3. Parallel-polarized (a), cross-polarized (b), and cross-peak specific 2DES absorptive spectra (c) of Bchl a at t = 130 fs (contour interval = 0.1). Dashed lines and the absorption spectra alongside 2DES are used to illustrate the peak positions. (d) The spectral cut of anisotropy r along the excitation axis with detection wavelength at 770 nm and the calculated angle θ between the Qx and Qy TDMs. (e) Calculated linear absorption spectra σS1, σS2 based on eqn (1), broadened by a 40 meV Gaussian function. (f) The S2 contribution σS2 to the total intensity σS1 + σS2 shows no overlap between S1 and S2 excitations and thus no wavelength dependence.
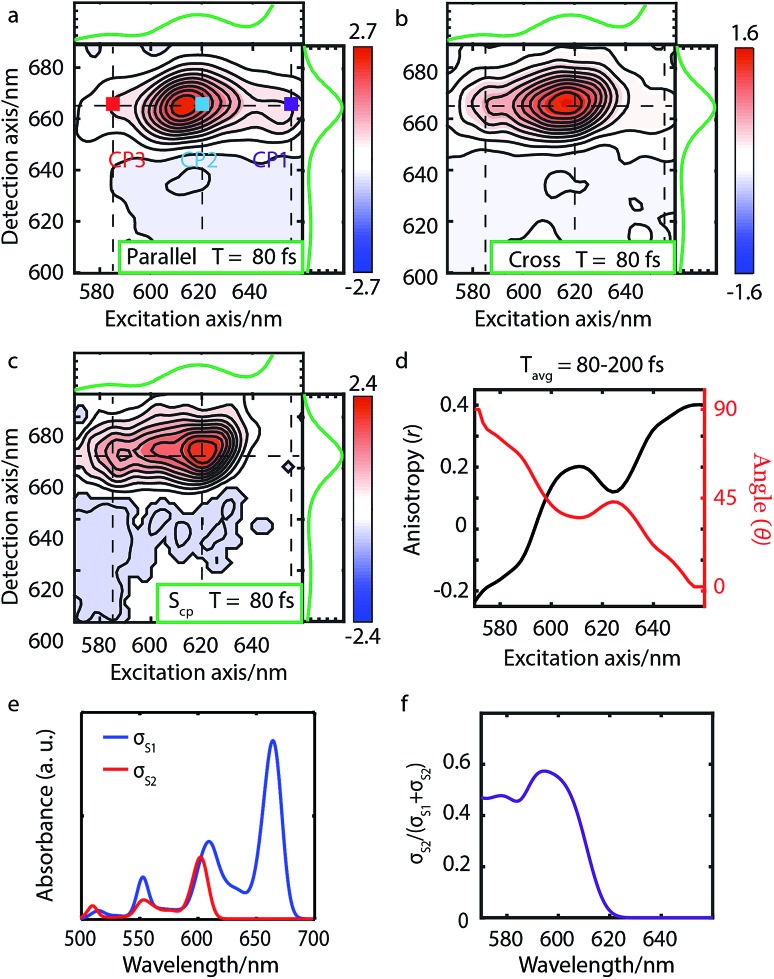
Fig. 4. Parallel-polarized (a), cross-polarized (b) polarized and cross-peak specific (c) 2DES absorptive spectra of Chl a at 80 fs (contour interval = 0.1). Dashed lines and the absorption spectra alongside 2DES are used to illustrate the peak positions. (d) The anisotropy r and the angle θ calculated from the measured spectra Sp and Sc. (e) The calculated linear absorption spectra σS1 and σS2 based on eqn (1), broadened by a 40 meV Gaussian function, show an overlap between the S2 fundamental line and the S1 vibrational replica. (f) The S2 contribution σS2 to the total intensity σS1 + σS2 shows the same wavelength dependence as the calculated angle θ in panel d.
Polarized-2DES and anisotropy
We performed 2DES measurements with two polarization schemes – p-polarized pump, p-polarized probe (Sp) and s-polarized pump, p-polarized probe (Sc). The corresponding 2DES absorptive spectra of the Bchl a at 130 fs are shown in Fig. 3a and b. Both spectra exhibit one broadband cross peak with excitation wavelength at 578 nm and detection wavelength at 780 nm. The peak position is slightly shifted from the absorption spectrum owing to the amplitude modulation induced by the laser pulse spectra. The presence of the cross peak suggests that the Qx and Qy transitions share a common ground state.
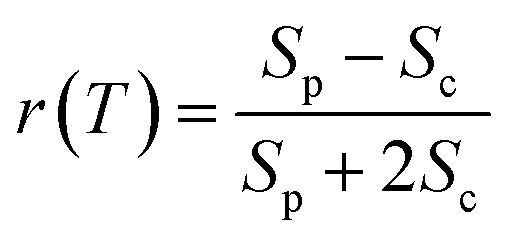
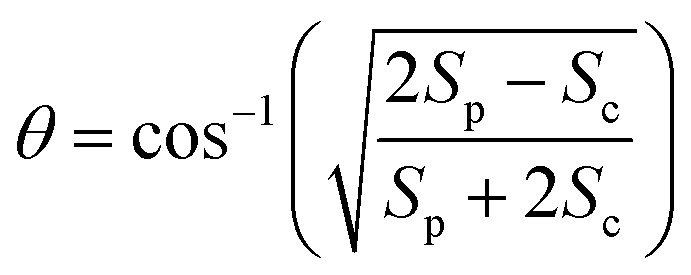
To verify that the Qx and Qy transitions have different polarizations, we calculated the so-called ‘cross-peak specific spectrum’55,57 using the formula Scp = 3Sc – Sp, which removes the signals from pathways involving only parallel transition dipole moments (TDMs) and highlights ones from pathways with non-parallel TDMs. The Scp spectrum at 130 fs is displayed in Fig. 3c. Scp exhibits a cross peak at the same position as the parallel- and cross-polarized 2DES. This observation is qualitatively consistent with the Gouterman model4 which predicts that these two transitions are perpendicularly polarized. To quantitatively evaluate the polarizations of the TDMs, we calculated anisotropy (r) and the angle (θ) between the E1 and E2 transitions using the following formula:54,70
 |
2 |
 |
3 |
We note potential interferences of ground state bleaching (GSB), stimulated emission (SE) and excited-state absorption (ESA) may alter the interpretation of anisotropy and angle calculation. However, this is not the case in the current study for several reasons. First, after internal conversion has completed, GSB and SE signals at the cross peak come from the same transition dipole moment (i.e. Qy) and would have the same anisotropy under the Condon approximation. This argument is supported by the observation that the anisotropy remains almost constant from 125–500 fs (see Fig. S4a†). We also note that previous publications10,71 have claimed that ESA might be hidden underneath the GSB signals and can potentially change the anisotropy.19 However, two groups18,72 measured the anisotropy at the Qy peak upon excitation of the Qy transition and respectively reported a value of about 0.4. These results suggest that either the extinction coefficient of ESA is small or that the ESA transition has the same polarization as Qy. In both cases, eqn (3) is valid to estimate the angle between Qx and Qy. This argument is verified in ESI Section 5† by performing the angle calculation at the condition where a weak ESA is considered. In addition, molecular rotational dynamics occurs on the picosecond timescale and can therefore be neglected in the following analysis. However, we want to stress that the TDM orientation can in principle change on shorter timescales through photo-induced nuclear reorganization. Experimental and theoretical investigations of such non-Condon effects in Bchl a and Chl a are currently underway in our groups and will be published elsewhere.
Since the anisotropic signal is relatively weak and remains unchanged after internal conversion, the spectrum averaged over T = 130–300 fs is used in the calculation. A spectral cut of the θ and r results along the excitation axis is shown in Fig. 3d. We find that the anisotropy shows an almost constant value of ∼–0.15 through the whole excitation band, which confirms that the Q-band is composed of only two electronic transitions. Using eqn (3) we find the angle between the Qx and Qy TDMs to be ∼75°. This result is in excellent agreement with the SRSH-PCM TDDFT calculations which yield an angle of 77.6° between the S1 and S2 TDMs. To the best of our knowledge, no earlier experimental studies have been reported to evaluate the angle between the Qx and Qy transitions for penta-coordinated Bchl a. However, some relevant studies5,11,73 support our finding that the Qx and Qy angle can deviate from the 90° angle expected from the Gouterman model. For example, the Goedheer5 and Ebrey11 groups, respectively measured polarized fluorescence excitation spectra of Bchl a with unknown coordination status in cyclohexanol and castor oil, and found the angle between Qx and Qy to be ∼68–72°. Christoffersen et al.73 performed semi-empirical calculations on Bchl a and reported an angle of ∼70° between the Qx and Qy transition. Thus, our measurement of a 75° angle between the Qx and Qy TDMs for penta-coordinated Bchl a and our calculated value of 77.6° are reasonably consistent with previous reports.5,11,73
We present the parallel-polarized, cross-polarized and cross-peak specific 2DES absorptive spectra of Chl a at 80 fs in Fig. 4a–c, respectively. The former two 2D spectra show three peaks with excitation wavelength at 650 (CP1), 620 (CP2) and 588 (CP3) nm and detection wavelength at 665 nm. However, only CP2 and CP3 remain in the Scp spectra, suggesting that CP1 is the vibrational overtone of the E1 transition while CP2 and CP3 may originate from different electronic/vibronic transitions.
To elucidate the peak origins of CP2 and CP3, we evaluated anisotropy r and the angles θ of the excitation bands with respect to the E1 transition. Similar to Bchl a, the anisotropy remains constant after 80 fs when internal conversion is complete (see Fig. S4c†). To calculate the angles, we considered the potential interference between GSB, SE and ESA at the cross peaks. As discussed above, GSB and SE have the same anisotropy after internal conversion. Several measurements15,17,74 including transient absorption and Z-scan spectroscopy have shown that the extinction coefficient of ESA at the Qy peak is less than 5%, making eqn (3) valid for estimating the angle between TDMs (see S5 and Fig. S4d†). A spectral cut along the excitation axis with detection wavelength at 665 nm is shown in Fig. 4d. As with Bchl a, we employ a time-averaged spectrum from 80–200 fs for the measurement because of the low signal amplitude. Unlike Bchl a, we find that both the anisotropy and angles exhibit a strong wavelength dependence. At CP2 and CP3 peaks, the angles of the TDMs with respect to the E1 transition are found to be ∼45° and 60°, respectively.
The wavelength-dependent anisotropy in the Q-band has also been reported in previous studies.8,9,19,42 Polarized fluorescence excitation spectra9,42 showed that for hexa-coordinated Chl a, the angle between the E1 and E2 signal is ∼56°. By using linear dichroism and polarized fluorescence spectra, Bauman et al.8 reported that the angle between the E1 and E3 polarization is ∼90° for Chl a with an unknown coordination status in a liquid crystal. Lin et al.19 measured pump-probe anisotropy of hexa-coordinated Chl a in ethanol under excitation at 580, 620, 660 nm and showed that the anisotropy values have a strong excitation wavelength dependence. All these results suggest that the polarizations in the Q-band have strong wavelength dependence. However, to the best of our knowledge, no anisotropy spectrum for the whole Q-band of penta-coordinated Chl a has been reported. Here, we present a complete anisotropic map, providing a benchmark for theoretical simulations.
To interpret the polarization behavior in the Q band of Chl a, we turn to TDDFT calculations. The calculated angles between adiabatic electronic states are 79.7° for tetra-, 75.0° for the penta-, and 73.8° for the hexa-coordinated Chl a, respectively. The dependence on the degree of axial ligation, which is not present in Bchl a, can be traced back to a stronger contribution of the LUMO+1 to the S2 state in Chl a (∼0.4) than in Bchl a (∼0.2), which is not considered to contribute to the Q band in the Gouterman model. However, the calculated angle of 75° for penta-coordinated Chl a deviates significantly from the θ values obtained from experiment (i.e., 45° for CP2 and 60° for CP3). We ascribe the smaller angles to varying degrees of the overlap of S1 and S2 spectral features. Fig. 4e shows the simulated absorption spectra σi for each electronic state, i = 1, 2, calculated from HRFs, eqn (1), considering vibronic states of up to two vibrational quanta and a Gaussian line broadening of 40 meV. The blue curve in Fig. 4f reflects the S2 contribution to the total signal and is thus a measure of the spectral overlap. At wavelengths around 640 nm (CP1), only vibrational states within the S1 electronic state can be found which are of the same polarization as the E1 transition and therefore vanish in the Scp spectrum, resulting in a relative angle of 0°. As intensities of S2 transitions appear at shorter wavelengths, Scp increases and so does seemingly the angle θ evaluated by eqn (3). The wavelength dependence of the spectral overlap (panel f) strongly resembles the one of the angle θ (panel d). We therefore interpret θ not as relative TDM angle, but as a composition of 0° contributions from the Qy transition and an unknown angle ≥60° from the Qx contribution, resulting in an effective intermediate value. CP2 can thus be interpreted as a superposition of the Qx0 fundamental line and the Qy1 vibrational replica, whereas CP3 stems from the Qx1 and Qy2 overtones.
We note that there have been suggestions that vibronic coupling plays an important role in the electronic structure of the Q band of Chl a.9,25,29,38 Recently, such vibronic coupling was evaluated in the model calculations by Reimers et al.29 These authors simulated the absorption and MCD spectra of Chl a and found that no satisfactory fit could be obtained within the Condon approximation without including vibronic coupling. In the limit of intermediate/strong coupling, vibronic coupling mixes electronic transitions and gives rise to a set of vibronic transitions with different polarizations. This alternative picture could also qualitatively explain our experimental observations. Our TDDFT calculations are not in contradiction with the vibronic coupling model since the calculated excited states show a strong nuclear-coordinate dependence.
Our findings that the vibrational replica of the S0 → S1 transition and the S0 → S2 transition are degenerate in Chl a suggests that vibronic states can mix via weak electronic/vibronic coupling. However, such an effect is weakened in Bchl a because of the large energy gap. This raises interesting questions about the importance of electronic/vibronic coupling for the photoexcited dynamics. Both Bchl a and Chl a pigments play key roles in energy transfer in photosynthetic antennae and charge separation in photosynthetic reaction centers, motivating a detailed understanding of their electronic structure. The Q-bands are of particular importance; in photosynthetic antennae the Q-band states lie at the bottom of the energy funnel that feeds excitation into the reaction centers. Within the reaction centers, the excitation of the Q-band states directly precedes primary charge separation. Despite many studies,2,75,76 debates remain about the site energies, coupling strength among pigments and the delocalization of the excitonic states in both photosynthetic antenna and reaction centers. Previous studies suggest that44,57,77–79 excitonic delocalization may play important roles in energy/charge transfer and coherent dynamics. Our measurements that inform about the vibronic structure of Bchl a and Chl a provide important inputs for models of photosynthetic energy transfer and charge separation. In the following, we investigate internal conversion processes and study the way in which electronic/vibronic coupling affects the Q-band structure.
Internal conversion
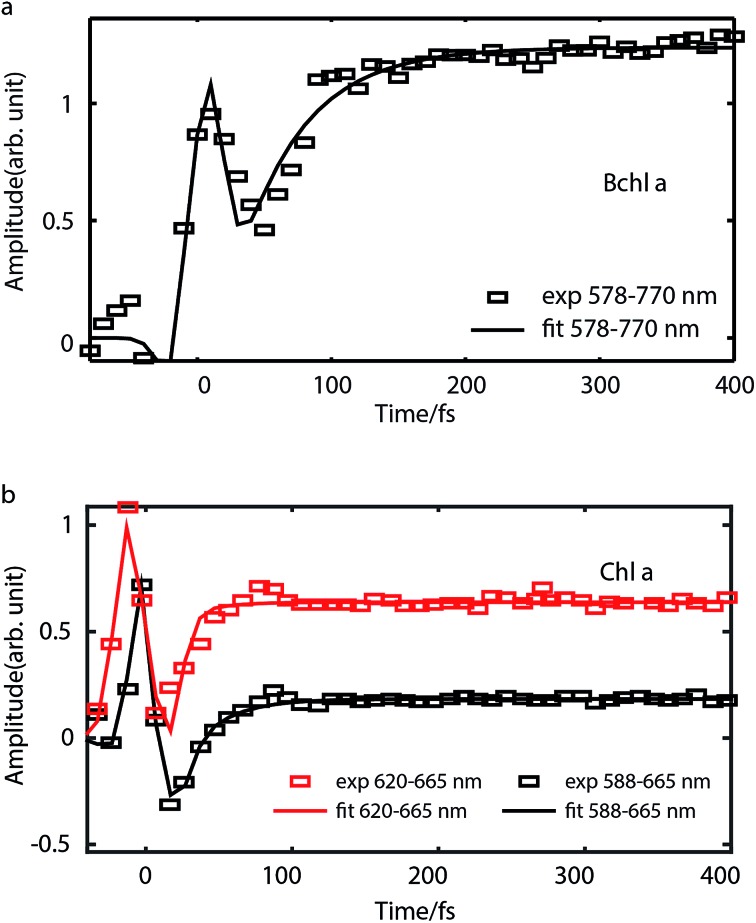
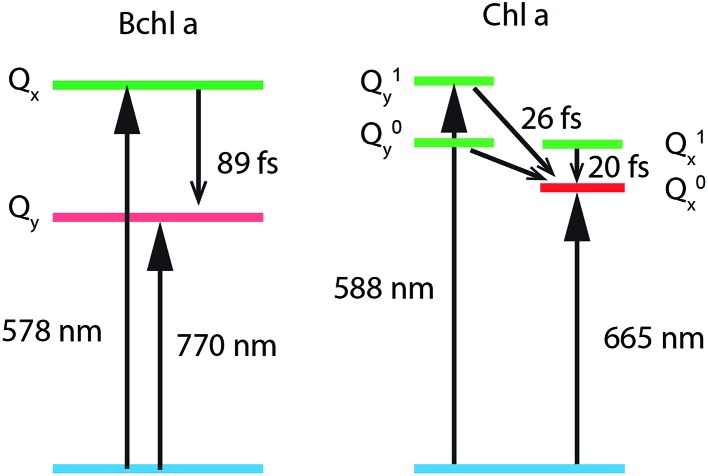
To study internal conversion, we reconstruct the signal under the magic angle condition using parallel- and cross-polarized spectra. Fig. 5a and b display time traces and the exponential fits of cross peaks for Bchl a and Chl a, respectively. These time traces showed a strong solvent response (or coherent artifact) in the first 50 fs. To account for the coherent artifact and obtain better estimates of the internal-conversion rates, we applied an additional term derived by Ernsting80 in the fitting function (as shown in the Section S3 of ESI†). The fitting results are summarized in the Table S1.† We find that for Bchl a, internal conversion from the Qx state to the Qy state has a rate of 11 ps–1, whereas for Chl a, internal conversions from E2 to E1 and E3 to E1, have rates of 50 ps–1 and 38 ps–1, respectively (Fig. 6).
Fig. 5. Time traces (scattered plots) and their fits (solid curves) corresponding to internal conversion of Bchl a (a) and Chl a (b) in magic-angle condition. For Bchl a, time trace of cross peak with excitation at 578 nm and detection at 770 nm is plotted. For Chl a, time traces of cross peaks with excitation at 620 nm and 588 nm are shown.
Fig. 6. Energy-level diagrams and internal conversion timescales of relevant vibronic states of Bchl a and Chl a.
Internal conversion in the Q-band of Bchl a and Chl a have been studied previously.25,29,38 Freiberg et al. estimated internal conversion rates from the linewidth of absorption spectra and fluorescence line narrowing and found the rates to be ∼30 ps–1(or (33 fs)–1) for hexa-coordinated Bchl a29,38 and 31–62 ps–1(or (16–32 fs)–1) for hexa-coordinated Chl a at 4 K.25 The faster rates obtained and the failure to distinguish the rates from two pigments in these experiments may be owing to an underestimation of inhomogeneous broadening. Pump-probe spectroscopy showed19,20,27,31,81 that for both Bchl a and Chl a, internal conversion occurs within 100 fs, which reaches the time-resolution limit of these measurements. Recently, high time-resolution 2DES have been performed to study the photoexcited dynamics of hexa-coordinated Chl a.28,32,34 However, these measurements primarily focused on the dynamics within the Qy band. Collini et al.34 recorded rephasing spectra of hexa-coordinated Chl a using parallel-polarized pump and probe pulses with spectra spanning from 625–690 nm and observed a 170 fs component attributed to vibrational relaxation within the S1 band. They further suggested that internal conversion from S2 to the high-lying vibrational state of S1 can be as fast as 40 fs. Here we have employed polarization-dependent 2DES over a broad spectral range to obtain internal conversion rates of both Bchl a and Chl a. Our observation of fast internal conversion rates in Chl a is also consistent with Collini's work.
To estimate the effective electronic coupling strength, we use a fully quantum-mechanical Fermi's Golden Rule rate expression for internal conversion and substitute the rate by the inverse of the measured lifetime τIC:68,82,83
 |
4 |
where ΔE is the difference between the optimized potential energies of the S1 and S2 state (Bchl a: 0.40 eV, Chl a: 0.17 eV), {S[combining tilde]α} are the HRFs for the S1 → S2 displacement, and nα is the phonon density at room temperature for a vibrational mode with frequency ωα. We found the effective electronic coupling values to be 53 meV in Bchl a and 45 meV in Chl a, respectively, corresponding to the weak-to-intermediate coupling regime.84 However, such weak coupling is strong enough to mix the vibronic states in Chl a where the vibronic replica of Qy is degenerate with Qx during internal conversion. Recently, Reimers et al. proposed that similar mixing of Qx and Qy transitions can also be induced by vibronic coupling29 and plays an important role during internal conversion. Further experiments are required to quantitatively determine the effect of Qx and Qy mixing on the photoexcited dynamics.
Experimental
Sample preparation
Chl a from spinach and Bchl a from Rhodopseudomonas sphaeroides, isopropanol (≥99.99%) and acetone (≥99.99%) with HPLC Plus grade were purchased from Sigma Aldrich and used as received. The solvents were purged with N2 gas for 5 minutes before use. Chl a isopropanol solutions and Bchl a acetone solutions were prepared under N2 atmosphere and solutions were stored and sealed in a 200 μm pathlength cuvette for the spectroscopic measurements. Cuvettes were sealed with vacuum grease or epoxy. The absorption spectra of samples were measured before and immediately after ultrafast spectroscopic measurements and no photodegradation was observed.
Spectroscopic measurements
2DES spectra were measured by using a hybrid diffractive-optics and pulse shaper setup as described previously.47,85,86 Briefly, a regenerative amplifier (Spectra Physics Spitfire Pro) seeded by a Ti:sapphire oscillator (MaiTai SP from Spectra Physics) is used as the laser source. The 4 mJ, 800 nm, 40 fs, 500 Hz output from the amplifier is split and feeds two home-built two-stage non-collinear optical parametric amplifiers (NOPAs)87 and one collinear optical parametric amplifier (OPA).88 One NOPA is used as the pump beam and tuned to excite the Qx band of either Bchl a or Chl a. The other NOPA and OPA is used as the probe for Chl a and Bchl a, respectively. The pump beam is sent through a precompensating grism and then into an acousto-optic pulse shaper (Dazzler, Fastlite) where a compressed pulse pair with a programmable time delay (t1) is generated. The probe beam from the NOPA is compressed by another grism. The pump and probe NOPA are compressed to 13 and 15 fs using the SPEAR method89 and MIIPS,90 respectively. The NOPA probe pulse duration is estimated by fitting the coherent artifact from transient grating measurements of cresyl violet. The OPA probe pulse is sent to a commercial liquid crystal spatial phase modulator (femtoJock from Biophotonics solution, Inc) and compressed to 10 fs. The pump and probe pulses are directed to a diffractive-optic imaging system to generate the third-order 2DES signal, which is detected by a CCD camera (Princeton instrument). During the experiments, t1 is scanned using the Dazzler from 0 to 400 fs with time steps of 10 fs. The pump-probe delay (T) is controlled by an optical delay line (DDS220, Thorlabs Inc.) and scanned from –60 to 500 fs. A six phase-cycling scheme is used as described previously to remove scattering and background signals.85 A shutter added in the probe arm removed residual scattering from the pump. In the experiments, the pulse energy of pump and probe pulses were ∼20 nJ and 12 nJ, respectively and the beam waists for both pump and probe were ∼200 μm. To control the polarizations, a waveplate and a wiregrid polarizer (Thorlabs, Inc.) are used in the pump arm between the Dazzler and the diffractive optic. A wiregrid polarizer, a waveplate and another wiregrid polarizer are added in sequence in the probe arm. The parallel- and cross-polarized 2DES are collected by changing the polarization of the pump beam. We performed tests and verified that there was no spectral shift of the pump beams when changing the polarizations. The pump power during the parallel- and cross-polarized 2DES is adjusted to be constant at the sample position by using the combination of the waveplate and the polarizer. The data are analyzed using home-written Matlab scripts. All experiments have been performed for at least three times to ensure reproducibility.
Calculations
Electronic structure calculations were performed with the Q-Chem software package, version 4.4,91 using our novel TDDFT framework combined within a PCM. Unless explicitly stated otherwise, the conductor-like polarizable continuum model (C-PCM)92–94 was employed throughout this analysis, simulating the isopropanol (static dielectric constant ε0 = 20.18, optical dielectric constant ε∞ = 1.90) and acetone (ε0 = 21.01, ε∞ = 1.85 (ref. 95)) solvents of Chl a and Bchl a, respectively. For both molecules the phytyl-containing side groups were removed to reduce computational costs, since they have no impact on spectral properties.61,96,97 Either zero, one, or two solvent molecules were added explicitly, giving rise to an unligated (tetra-), monoaxially ligated (penta-), or biaxially ligated (hexa-coordinated) central Mg ion, respectively.98,99 The split-valence double-zeta basis set 6-31++G(d,p)100 was used for all calculations.
We used the dispersion-corrected range-separated hybrid101 (RSH) functional ωB97X-D for geometry optimizations in the electronic ground and excited states and for normal mode calculations. Excitation energies were additionally calculated with the recently developed PCM-optimally-tuned screened range-separated hybrid approach (SRSH-PCM)62 using the ωPBE functional. In this approach, the exchange–correlation energy is of the following form102
| ESRSHxc = (1 – α)ESR,GGA,xγ + αESR,F,xγ + [1 – (α + β)]ELR,GGA,xγ + (α + β)ELR,F,xγ + EGGA,c | 5 |
where SR and LR indicate short and long range components, mixing the exact Fock exchange (F) with the approximate generalized gradient (GGA) exchange (x) and correlation (c) contribution. The parameters α and β determine the weights of the individual components, and γ is the range-separation parameter.101 By setting α + β = 1/ε0, electron coulombic interactions are effectively screened by 1/ε0 thereby achieving consistency with the self-consistent reaction field implementing the PCM.
The functional parameters were determined as follows: first, the range separation parameter γ was determined in the gas phase (i.e. without C-PCM and with α + β = 1, where α = 0.2 as widely employed102). In the tuning process differences were minimized between the ionization potential and the HOMO energy of the neutrally charged molecule and of the anion. A similar non-empirical tuning procedure was then employed with PCM, where α tuning involves resetting β to 1/ε0 – α to ensure the LR screening of the exact exchange by 1/ε0. At these PCM tuning calculations γ was fixed at the isolated molecule value. This procedure achieves consistent treatment of the dielectric screening between the PCM and the DFT calculations and has been found to avoid the problematic collapse of the range-separation parameter in dielectric medium tuning.103 The SRSH-PCM was recently shown to compare well with ionization energies measured in thin-film environments.62 Very recently we used the same protocol to explain the fine spectral splitting of the central pigments in bacterial reaction center64 and to calculate solvated charge-transfer state's energies.63 A related approach, where the α and β tuning was performed without the C-PCM environment, was recently successfully applied to calculate spectral properties.104
Conclusions
To conclude, we performed P-2DES to investigate the electronic structure of the Q-band and its internal conversion processes in penta-coordinated Bchl a and Chl a. We find that the Q-band of Bchl a is composed of distinct Qx and Qy transitions with an angle of ∼75° and no significant perturbation due to vibronic coupling. Excitation energy differences and relative transition dipole moments were in excellent agreement with TDDFT calculations. The same protocol failed to reproduce relative angles measured in Chl a, where the spectral signals exhibit a strong wavelength dependence. Simulated spectra based on the HRFs indicate that deviations are consistent with a spectral overlap between overtones of the Qx and Qy transitions. Furthermore, we also took advantage of the high time resolution of 2DES to determine the internal conversion rates in Bchl a and Chl a. We find that Bchl a has a rate of 11 ps–1, slower than that of Chl a which was found to be 38–50 ps–1. The faster internal conversion in Chl a may stem from the mixing of Qx and Qy vibronic states and a smaller energy gap than is found in BChl a. Our results shed light on the electronic structure of Bchl a and Chl a, which is important for improving our understanding of the energy transfer and charge separation processes in photosynthetic antennae and reaction centers.
Conflicts of interest
There are no conflicts to declare.
Supplementary Material
Acknowledgments
Y. S., E. M. and J. P. O. acknowledge support from the Office of Basic Energy Sciences, the U.S. Department of Energy, under Grant Number DE-SC0016384. Y. S. and J. P. O. also acknowledge support from the Institute for Complex Adaptive Matter (ICAM). Y. S. acknowledges the support of the Natural Sciences and Engineering Council of Canada (NSERC) for a Postdoctoral Fellowship. A. S. is grateful for support by an ICAM fellowship, awarded by Kent State University and University of Michigan ICAM branches. B. D. D. is grateful for support by NSF via Grant CHE-1362504. E. G. is grateful for support by NSF via Grants CHE-1464477 and CHE-1800325. B. D. D. and E. G. are grateful for support by DOE via Award DE-SC0016501. The computational resources and services were provided by Advanced Research Computing at the University of Michigan, Ann Arbor. The authors thank Dewey Holten, Chris Kirmaier and David Bocian for sharing their B3LYP theoretical calculations.
Footnotes
†Electronic supplementary information (ESI) available. See DOI: 10.1039/c9sc02329a
References
- Blankenship R. E., in Molecular Mechanisms of Photosynthesis, Blackwell Science Ltd, 2008, pp. 42–60, 10.1002/9780470758472.ch4. [DOI] [Google Scholar]
- Golbeck J. and van der Est A., The Biophysics of photosynthesis, Springer-Verlag, New York, 1 edn, 2014. [Google Scholar]
- Morel A., Senge M. O., Wiehe A., Ryppa C. and Shioi Y., Chlorophylls and Bacteriochlorophylls, Springer Netherlands, 1 edn, 2006. [Google Scholar]
- Gouterman M. J. Mol. Spectrosc. 1961;6:138–163. [Google Scholar]
- Goedheer J. C., in The Chlorophylls, ed. L. P. Vernon and G. R. Seely, Academic Press, 1966, pp. 147–184, 10.1016/B978-1-4832-3289-8.50012-6. [DOI] [Google Scholar]
- Goedheer J. C. Nature. 1955;176:928–929. doi: 10.1038/176928a0. [DOI] [PubMed] [Google Scholar]
- Weiss C. J. Mol. Spectrosc. 1972;44:37–80. [Google Scholar]
- Bauman D., Wrobel D. Biophys. Chem. 1980;12:83–91. doi: 10.1016/0301-4622(80)80042-1. [DOI] [PubMed] [Google Scholar]
- Avarmaa R. A., Rebane K. K. Spectrochim. Acta, Part A. 1985;41:1365–1380. [Google Scholar]
- Savikhin S., Struve W. S. Biophys. J. 1994;67:2002–2007. doi: 10.1016/S0006-3495(94)80683-6. [DOI] [PMC free article] [PubMed] [Google Scholar]
- Ebrey T. G., Clayton R. K. Photochem. Photobiol. 1969;10:109–117. doi: 10.1111/j.1751-1097.1969.tb07227.x. [DOI] [PubMed] [Google Scholar]
- Houssier C., Sauer K. J. Am. Chem. Soc. 1970;92:779–791. [Google Scholar]
- Evans T. A., Katz J. J. Biochim. Biophys. Acta, Bioenerg. 1975;396:414–426. doi: 10.1016/0005-2728(75)90147-4. [DOI] [PubMed] [Google Scholar]
- Petke J. D., Maggiora G. M., Shipman L., Christoffersen R. E. Photochem. Photobiol. 1979;30:203–223. [Google Scholar]
- Martinsson P., Oksanen J. A. I., Hilgendorft M., Åkesson E., Hynninen P. and Sundström V., in Photosynthesis: mechanisms and effects, Springer Netherlands, Dordrecht, 1998, vol. I, pp. 457–460. [Google Scholar]
- Sundholm D. Chem. Phys. Lett. 1999;302:480–484. [Google Scholar]
- Martinsson P., Oksanen J. a. I., Hilgendorff M., Hynninen P. H., Sundström V., Åkesson E. Chem. Phys. Lett. 1999;309:386–394. [Google Scholar]
- Martinsson P., Sundström V., Åkesson E. FEBS Lett. 2000;465:107–109. doi: 10.1016/s0014-5793(99)01725-1. [DOI] [PubMed] [Google Scholar]
- Shiu Y. J., Shi Y., Hayashi M., Su C., Han K. L., Lin S. H. Chem. Phys. Lett. 2003;378:202–210. [Google Scholar]
- Shi Y., Liu J.-Y., Han K.-L. Chem. Phys. Lett. 2005;410:260–263. [Google Scholar]
- Dong L. Q., Niu K., Cong S. L. Chem. Phys. Lett. 2006;432:286–290. [Google Scholar]
- Linnanto J., Korppi-Tommola J. Phys. Chem. Chem. Phys. 2006;8:663–687. doi: 10.1039/b513086g. [DOI] [PubMed] [Google Scholar]
- Dong L. Q., Niu K., Cong S. L. Chem. Phys. Lett. 2007;440:150–154. [Google Scholar]
- Linke M., Lauer A., von Haimberger T., Zacarias A., Heyne K. J. Am. Chem. Soc. 2008;130:14904–14905. doi: 10.1021/ja804096s. [DOI] [PubMed] [Google Scholar]
- Rätsep M., Linnanto J., Freiberg A. J. Chem. Phys. 2009;130:194501. doi: 10.1063/1.3125183. [DOI] [PubMed] [Google Scholar]
- Fransted K. a., Caram J. R., Hayes D., Engel G. S. J. Chem. Phys. 2012;137:125101. doi: 10.1063/1.4752107. [DOI] [PubMed] [Google Scholar]
- Kosumi D., Nakagawa K., Sakai S., Nagaoka Y., Maruta S., Sugisaki M., Dewa T., Nango M., Hashimoto H. J. Chem. Phys. 2013;139:034311. doi: 10.1063/1.4813526. [DOI] [PubMed] [Google Scholar]
- Wells K. L., Zhang Z., Rouxel J. R., Tan H.-s. J. Phys. Chem. B. 2013;117:2294–2299. doi: 10.1021/jp310154y. [DOI] [PubMed] [Google Scholar]
- Reimers J. R., Cai Z.-L., Kobayashi R., Rätsep M., Freiberg A., Krausz E. Sci. Rep. 2013;3:2761. doi: 10.1038/srep02761. [DOI] [PMC free article] [PubMed] [Google Scholar]
- Higashi M., Kosugi T., Hayashi S., Saito S. J. Phys. Chem. B. 2014;118:10906–10918. doi: 10.1021/jp507259g. [DOI] [PubMed] [Google Scholar]
- Bricker W. P., Shenai P. M., Ghosh A., Liu Z., Enriquez M. G. M., Lambrev P. H., Tan H.-S., Lo C. S., Tretiak S., Fernandez-Alberti S., Zhao Y. Sci. Rep. 2015;5:13625. doi: 10.1038/srep13625. [DOI] [PMC free article] [PubMed] [Google Scholar]
- Moca R., Meech S. R., Heisler I. a. J. Phys. Chem. B. 2015;119:8623–8630. doi: 10.1021/acs.jpcb.5b04339. [DOI] [PubMed] [Google Scholar]
- Lewis N. H. C., Fleming G. R. J. Phys. Chem. Lett. 2016;7:831–837. doi: 10.1021/acs.jpclett.6b00037. [DOI] [PubMed] [Google Scholar]
- Meneghin E., Leonardo C., Volpato A., Bolzonello L., Collini E. Sci. Rep. 2017;7:11389. doi: 10.1038/s41598-017-11621-2. [DOI] [PMC free article] [PubMed] [Google Scholar]
- Reimers J. R., Biczysko M., Bruce D., Coker D. F., Frankcombe T. J., Hashimoto H., Hauer J., Jankowiak R., Kramer T., Linnanto J., Mamedov F., Müh F., Rätsep M., Renger T., Styring S., Wan J., Wang Z., Wang-Otomo Z.-Y., Weng Y.-X., Yang C., Zhang J.-P., Freiberg A., Krausz E. Biochim. Biophys. Acta, Bioenerg. 2016;1857:1627–1640. doi: 10.1016/j.bbabio.2016.06.010. [DOI] [PubMed] [Google Scholar]
- Song P. S. Annu. Rep. Prog. Chem., Sect. B: Org. Chem. 1977;74:18. [Google Scholar]
- Senge M. O., Ryan A. A., Letchford K. A., MacGowan S. A., Mielke T. Symmetry. 2014;6:781–843. [Google Scholar]
- Rätsep M., Cai Z.-l., Reimers J. R., Freiberg A. J. Chem. Phys. 2011;134:024506. doi: 10.1063/1.3518685. [DOI] [PubMed] [Google Scholar]
- Umetsu M., Wang Z.-Y., Kobayashi M., Nozawa T. Biochim. Biophys. Acta, Bioenerg. 1999;1410:19–31. doi: 10.1016/s0005-2728(98)00170-4. [DOI] [PubMed] [Google Scholar]
- Umetsu M., Wang Z.-y., Yoza K., Kobayashi M., Nozawa T. Biochim. Biophys. Acta, Bioenerg. 2000;1457:106–117. doi: 10.1016/s0005-2728(00)00070-0. [DOI] [PubMed] [Google Scholar]
- Pearlstein R. M., Hemenger R. P. Proc. Natl. Acad. Sci. U. S. A. 1978;75:4920–4924. doi: 10.1073/pnas.75.10.4920. [DOI] [PMC free article] [PubMed] [Google Scholar]
- Rebane K. K., Avarmaa R. A. Chem. Phys. 1982;68:191–200. [Google Scholar]
- Leiger K., Linnanto J. M., Freiberg A. J. Phys. Chem. Lett. 2017;8:4231–4235. doi: 10.1021/acs.jpclett.7b01704. [DOI] [PubMed] [Google Scholar]
- Brixner T., Stenger J., Vaswani H. M., Cho M., Blankenship R. E., Fleming G. R. Nature. 2005;434:625–628. doi: 10.1038/nature03429. [DOI] [PubMed] [Google Scholar]
- Engel G. S., Calhoun T. R., Read E. L., Ahn T. K., Mancal T., Cheng Y. C., Blankenship R. E., Fleming G. R. Nature. 2007;446:782–786. doi: 10.1038/nature05678. [DOI] [PubMed] [Google Scholar]
- Ostroumov E. E., Mulvaney R. M., Cogdell R. J., Scholes G. D. Science. 2013;340:52–56. doi: 10.1126/science.1230106. [DOI] [PubMed] [Google Scholar]
- Fuller F. D., Pan J., Gelzinis A., Butkus V., Senlik S. S., Wilcox D. E., Yocum C. F., Valkunas L., Abramavicius D., Ogilvie J. P. Nat. Chem. 2014;6:706–711. doi: 10.1038/nchem.2005. [DOI] [PubMed] [Google Scholar]
- Collini E., Wong C. Y., Wilk K. E., Curmi P. M. G., Brumer P., Scholes G. D. Nature. 2010;463:644–U669. doi: 10.1038/nature08811. [DOI] [PubMed] [Google Scholar]
- Collini E., Scholes G. D. Science. 2009;323:369–373. doi: 10.1126/science.1164016. [DOI] [PubMed] [Google Scholar]
- Song Y., Clafton S. N., Pensack R. D., Kee T. W., Scholes G. D. Nat. Commun. 2014;5:4933. doi: 10.1038/ncomms5933. [DOI] [PubMed] [Google Scholar]
- Stone K. W., Turner D. B., Gundogdu K., Cundiff S. T., Nelson K. A. Acc. Chem. Res. 2009;42:1452–1461. doi: 10.1021/ar900122k. [DOI] [PubMed] [Google Scholar]
- Turner D. B., Hassan Y., Scholes G. D. Nano Lett. 2012;12:880–886. doi: 10.1021/nl2039502. [DOI] [PubMed] [Google Scholar]
- Cundiff S. T., Zhang T. H., Bristow A. D., Karaiskaj D., Dai X. C. Acc. Chem. Res. 2009;42:1423–1432. doi: 10.1021/ar9000636. [DOI] [PubMed] [Google Scholar]
- Hochstrasser R. M. Chem. Phys. 2001;266:273–284. [Google Scholar]
- Read E. L., Engel G. S., Calhoun T. R., Mancal T., Ahn T. K., Blankenship R. E., Fleming G. R. Proc. Natl. Acad. Sci. U. S. A. 2007;104:14203–14208. doi: 10.1073/pnas.0701201104. [DOI] [PMC free article] [PubMed] [Google Scholar]
- Read E. L., Schlau-Cohen G. S., Engel G. S., Wen J., Blankenship R. E., Fleming G. R. Biophys. J. 2008;95:847–856. doi: 10.1529/biophysj.107.128199. [DOI] [PMC free article] [PubMed] [Google Scholar]
- Thyrhaug E., žídek K., Dostál J., Bína D., Zigmantas D. J. Phys. Chem. Lett. 2016;7:1653–1660. doi: 10.1021/acs.jpclett.6b00534. [DOI] [PubMed] [Google Scholar]
- Mehlenbacher R. D., McDonough T. J., Kearns N. M., Shea M. J., Joo Y., Gopalan P., Arnold M. S., Zanni M. T. J. Phys. Chem. C. 2016;120:17069–17080. [Google Scholar]
- Fiedor L., Kania A., Mysliwa-Kurdziel B., Orzel L., Stochel G. Biochim. Biophys. Acta. 2008;1777:1491–1500. doi: 10.1016/j.bbabio.2008.09.005. [DOI] [PubMed] [Google Scholar]
- Fiedor L., Stasiek M., Mysliwa-Kurdziel B., Strzalka K. Photosynth. Res. 2003;78:47–57. doi: 10.1023/A:1026042005536. [DOI] [PubMed] [Google Scholar]
- König C., Neugebauer J. ChemPhysChem. 2012;13:386–425. doi: 10.1002/cphc.201100408. [DOI] [PubMed] [Google Scholar]
- Bhandari S., Cheung M. S., Geva E., Kronik L., Dunietz B. D. J. Chem. Theory Comput. 2018;14:6287–6294. doi: 10.1021/acs.jctc.8b00876. [DOI] [PubMed] [Google Scholar]
- Bhandari S., Dunietz B. D. J. Chem. Theory Comput. 2019 doi: 10.1021/acs.jctc.9b00480. [DOI] [PubMed] [Google Scholar]
- Aksu H., Schubert A., Geva E. and Dunietz B. D., 2019, submitted. [DOI] [PubMed]
- Gouterman M., Stryer L. J. Chem. Phys. 1962;37:2260–2266. [Google Scholar]
- Shipman L. L., Cotton T. M., Norris J. R., Katz J. J. J. Am. Chem. Soc. 1976;98:8222–8230. doi: 10.1021/ja00441a056. [DOI] [PubMed] [Google Scholar]
- Huang K., Rhys A. Proc. R. Soc. London, Ser. A. 1950;204:406–423. [Google Scholar]
- Nitzan A., Chemical Dynamics in Condensed Phases: Relaxation, TransferChemical Dynamics in Condensed Phases: Relaxation, Transfer and Reactions in Condensed Molecular Systemsand Reactions in Condensed Molecular Systems, OUP, Oxford, 2006. [Google Scholar]
- de Jong M., Seijo L., Meijerink A., Rabouw F. T. Phys. Chem. Chem. Phys. 2015;17:16959–16969. doi: 10.1039/c5cp02093j. [DOI] [PubMed] [Google Scholar]
- Hamm P. and Zanni M., Concepts and Methods of 2D Infrared Spectroscopy, Cambridge University Press, Cambridge, 2011. [Google Scholar]
- Becker M., Nagarajan V., Parson W. W. J. Am. Chem. Soc. 1991;113:6840–6848. [Google Scholar]
- Savikhin S., van Amerongen H., Kwa S. L., van Grondelle R., Struve W. S. Biophys. J. 1994;66:1597–1603. doi: 10.1016/S0006-3495(94)80951-8. [DOI] [PMC free article] [PubMed] [Google Scholar]
- Petke J. D., Maggiora G. M., Shipman L. L., Christoffersen R. E. Photochem. Photobiol. 1980;32:399–414. [Google Scholar]
- Leupold D., Mory S., Konig R., Hoffmann P., Hieke B. Chem. Phys. Lett. 1977;45:567–571. [Google Scholar]
- Blankenship R. E., in Molecular Mechanisms of Photosynthesis, Blackwell Science Ltd, 2008, pp. 61–94, 10.1002/9780470758472.ch5. [DOI] [Google Scholar]
- Blankenship R. E., in Molecular Mechanisms of Photosynthesis, Blackwell Science Ltd, 2008, pp. 95–123, 10.1002/9780470758472.ch6. [DOI] [Google Scholar]
- Maiuri M., Ostroumov E. E., Saer R. G., Blankenship R. E., Scholes G. D. Nat. Chem. 2018;10:177–183. doi: 10.1038/nchem.2910. [DOI] [PubMed] [Google Scholar]
- Gelzinis A., Abramavicius D., Ogilvie J. P., Valkunas L. J. Chem. Phys. 2017;147:115102. doi: 10.1063/1.4997527. [DOI] [PubMed] [Google Scholar]
- Gelzinis A., Valkunas L., Fuller F. D., Ogilvie J. P., Mukamel S., Abramavicius D. New J. Phys. 2013;15:075013. [Google Scholar]
- Kovalenko S. A., Dobryakov A. L., Ruthmann J., Ernsting N. P. Phys. Rev. A: At., Mol., Opt. Phys. 1999;59:2369–2384. [Google Scholar]
- Visser H. M., Somsen O. J., van Mourik F., Lin S., van Stokkum I. H., van Grondelle R. Biophys. J. 1995;69:1083–1099. doi: 10.1016/S0006-3495(95)79982-9. [DOI] [PMC free article] [PubMed] [Google Scholar]
- Lee M. H., Dunietz B. D., Geva E. J. Phys. Chem. C. 2013;117:23391–23401. [Google Scholar]
- Jortner J. J. Chem. Phys. 1976;64:4860–4867. [Google Scholar]
- Simpson W. T., Peterson D. L. J. Chem. Phys. 1957;26:588–593. [Google Scholar]
- Fuller F. D., Wilcox D. E., Ogilvie J. P. Opt. Express. 2014;22:1018–1027. doi: 10.1364/OE.22.001018. [DOI] [PubMed] [Google Scholar]
- Song Y., Konar A., Sechrist R., Roy V. P., Duan R., Dziurgot J., Policht V., Matutes Y. A., Kubarych K. J., Ogilvie J. P. Rev. Sci. Instrum. 2019;90:013108. doi: 10.1063/1.5055244. [DOI] [PubMed] [Google Scholar]
- Wilhelm T., Piel J., Riedle E. Opt. Lett. 1997;22:1494–1496. doi: 10.1364/ol.22.001494. [DOI] [PubMed] [Google Scholar]
- Siddiqui A. M., Cirmi G., Brida D., Kartner F. X., Cerullo G. Opt. Lett. 2009;34:3592–3594. doi: 10.1364/OL.34.003592. [DOI] [PubMed] [Google Scholar]
- Wilcox D. E., Ogilvie J. P. J. Opt. Soc. Am. B. 2014;31:1544–1554. [Google Scholar]
- Hou B., Easter J. H., Nees J. A., He Z., Thomas A. G., Krushelnick K. Opt. Lett. 2012;37:1385–1387. doi: 10.1364/OL.37.001385. [DOI] [PubMed] [Google Scholar]
- Shao Y., Gan Z., Epifanovsky E., Gilbert A. T. B., Wormit M., Kussmann J., Lange A. W., Behn A., Deng J., Feng X., Ghosh D., Goldey M., Horn P. R., Jacobson L. D., Kaliman I., Khaliullin R. Z., Kus T., Landau A., Liu J., Proynov E. I., Rhee Y. M., Richard R. M., Rohrdanz M. A., Steele R. P., Sundstrom E. J., Woodcock III H. L., Zimmerman P. M., Zuev D., Albrecht B., Alguire E., Austin B., Beran G. J. O., Bernard Y. A., Berquist E., Brandhorst K., Bravaya K. B., Brown S. T., Casanova D., Chang C.-M., Chen Y., Chien S. H., Closser K. D., Crittenden D. L., Diedenhofen M., DiStasio Jr R. A., Do H., Dutoi A. D., Edgar R. G., Fatehi S., Fusti-Molnar L., Ghysels A., Golubeva-Zadorozhnaya A., Gomes J., Hanson-Heine M. W. D., Harbach P. H. P., Hauser A. W., Hohenstein E. G., Holden Z. C., Jagau T.-C., Ji H., Kaduk B., Khistyaev K., Kim J., Kim J., King R. A., Klunzinger P., Kosenkov D., Kowalczyk T., Krauter C. M., Lao K. U., Laurent A. D., Lawler K. V., Levchenko S. V., Lin C. Y., Liu F., Livshits E., Lochan R. C., Luenser A., Manohar P., Manzer S. F., Mao S.-P., Mardirossian N., Marenich A. V., Maurer S. A., Mayhall N. J., Neuscamman E., Oana C. M., Olivares-Amaya R., O'Neill D. P., Parkhill J. A., Perrine T. M., Peverati R., Prociuk A., Rehn D. R., Rosta E., Russ N. J., Sharada S. M., Sharma S., Small D. W., Sodt A., Stein T., Stück D., Su Y.-C., Thom A. J. W., Tsuchimochi T., Vanovschi V., Vogt L., Vydrov O., Wang T., Watson M. A., Wenzel J., White A., Williams C. F., Yang J., Yeganeh S., Yost S. R., You Z.-Q., Zhang I. Y., Zhang X., Zhao Y., Brooks B. R., Chan G. K. L., Chipman D. M., Cramer C. J., Goddard III W. A., Gordon M. S., Hehre W. J., Klamt A., Schaefer III H. F., Schmidt M. W., Sherrill C. D., Truhlar D. G., Warshel A., Xu X., Aspuru-Guzik A., Baer R., Bell A. T., Besley N. A., Chai J.-D., Dreuw A., Dunietz B. D., Furlani T. R., Gwaltney S. R., Hsu C.-P., Jung Y., Kong J., Lambrecht D. S., Liang W., Ochsenfeld C., Rassolov V. A., Slipchenko L. V., Subotnik J. E., Voorhis T. V., Herbert J. M., Krylov A. I., Gill P. M. W., Head-Gordon M. Mol. Phys. 2015;113:184–215. [Google Scholar]
- Truong T. N., Stefanovich E. V. Chem. Phys.Chem. Phys. Lett.Lett. 1995;240:253–260. [Google Scholar]
- Barone V., Cossi M. J. Phys. Chem. A. 1998;102:1995–2001. [Google Scholar]
- Tomasi J., Mennucci B., Cammi R. Chem. Rev. 2005;105:2999–3094. doi: 10.1021/cr9904009. [DOI] [PubMed] [Google Scholar]
- Rumble J., CRC Handbook of Chemistry and Physics, CRC Press LLC, 98th edn, 2017. [Google Scholar]
- Fiedor L., Stasiek M., Myśliwa-Kurdziel B., Strzałka K. Photosynth. Res. 2003;78:47–57. doi: 10.1023/A:1026042005536. [DOI] [PubMed] [Google Scholar]
- Hedayatifar L., Irani E., Mazarei M., Rasti S., Azar Y. T., Rezakhani A. T., Mashaghi A., Shayeganfar F., Anvari M., Heydari T., Tabar A. R., Nafari N., Vesaghi M. A., Asgari R., Rahimi Tabar M. R. RSC Adv. 2016;6:109778–109785. [Google Scholar]
- Karki K., Roccatano D. J. Chem. Theory Comput. 2011;7:1131–1140. doi: 10.1021/ct1004627. [DOI] [PubMed] [Google Scholar]
- Saito K., Suzuki T., Ishikita H. J. Photochem. Photobiol., A. 2018;358:422–431. [Google Scholar]
- Ditchfield R., Hehre W. J., Pople J. A. J. Chem. Phys. 1971;54:724–728. [Google Scholar]
- Baer R., Neuhauser D. Phys. Rev. Lett. 2005;94:043002. doi: 10.1103/PhysRevLett.94.043002. [DOI] [PubMed] [Google Scholar]
- Refaely-Abramson S., Jain M., Sharifzadeh S., Neaton J. B., Kronik L. Phys. Rev. B: Condens. Matter Mater. Phys. 2015;92:081204. [Google Scholar]
- Kronik L., Kümmel S. Adv. Mater. 2017:1706560. doi: 10.1002/adma.201706560. [DOI] [PubMed] [Google Scholar]
- Manna A. K., Refaely-Abramson S., Reilly A. M., Tkatchenko A., Neaton J. B., Kronik L. J. Chem. Theory Comput. 2018;14:2919–2929. doi: 10.1021/acs.jctc.7b01058. [DOI] [PubMed] [Google Scholar]
Associated Data
This section collects any data citations, data availability statements, or supplementary materials included in this article.


