

Abstract
Objectives: Oleuropein (OP), the predominant natural constituent of leaves of the olive tree, exerts anti-inflammatory and antioxidant effects. The purpose of this study was to assess the protective effects of OP under the conditions of paraquat (PQ)-induced oxidative stress in vitro, using the human hepatocarcinoma cell line, HepG2.
Methods: Cell viability and death were determined using the 3-(4,5-dimethylthiazol-2-yl)-2,5-diphenyltetrazolium bromide assay and 4′,6-diamidino-2-phenylindole-propidium iodide staining, respectively. Superoxide anion and lipid peroxidation levels were evaluated using nitroblue tetrazolium and thiobarbituric acid-reactive substances assays, respectively. Apoptosis was assessed by measuring poly(ADP-ribose) polymerase (PARP) and caspase-3 (Casp-3) cleavage via immunoblotting and immunofluorescence analyses.
Results: PQ induced a decrease in cellular viability by promoting necrosis through a mechanism involving superoxide generation and nuclear translocation of cleaved Casp-3. Co-treatment with OP afforded significant protection against the suppressive effects of PQ, as evident from increased cell viability, reduction of Casp-3 immunofluorescence, and normalization of β-tubulin expression levels. Unexpectedly, these OP-mediated protective effects were associated with increased superoxide and malondialdehyde generation and PARP cleavage.
Discussion: OP protects HepG2 cells against PQ-induced necrosis by suppressing Casp-3 cleavage while concomitantly acting as a pro-oxidant agent. This paradoxical mechanism of action of OP requires further investigation.
Keywords: Oleuropein, Paraquat, Oxidative stress, Superoxide, Hydroxyl radical, Lipid peroxidation, Apoptosis, Necrosis
Introduction
Olive oil, the cornerstone of the Mediterranean diet, is proposed to contain the main etiological factor for the reduced all-cause death rate in these countries.1 Olive oil is composed of various compounds that individually display potent antioxidant activity, including tocopherols and phenolic compounds.2 In addition, olive tree leaf extract constituents are of pharmacological interest, in view of their protective activity against oxidant-induced damage in vitro3 and in vivo.4 A major constituent of olive leaf extracts that has attracted considerable research attention is oleuropein (OP).
OP is a phenolic compound found in the leaves and seeds of olive trees belonging to the Olea europae family that can be dietetically obtained.5 The compound has been identified as a hydroxytyrosol (HTyr) ester that is absorbed in the small intestine and colon of animals6 and humans,7 degraded to HTyr in the large intestine,8 binds circulating human lipoproteins,9 and is excreted in urine as glucoronide conjugates.7 Several studies have provided evidence of the antioxidant10 and anticancer11 effects of OP, validating its therapeutic potential.
OP exerts antioxidant effects either directly by reducing reactive oxygen species (ROS) generation and subsequent damage12 or indirectly through modulating endogenous antioxidant enzymes, as appropriate, to overcome oxidant-induced stress.13 In addition, anticancer properties of OP have been documented. Specifically, OP has been shown to induce apoptosis in human promyelocytic leukemia (HL60),14 prostate cancer,15 cervical carcinoma,16 and human colorectal cancer (HT-29)11 cells. In many cases, the anti-proliferative and pro-apoptotic effects of OP on tumor cells are elicited via pathways involving ROS generation and oxidative stress. Conversely, OP has been reported to mediate antioxidant effects and promote cell survival in HL-6017 and thyroid cancer12 cells. Thus, the issue of whether the action of OP on malignant cells is strictly pro-oxidant or antioxidant remains to be established.
In the present study, the human hepatocarcinoma cell line, HepG2, used previously to demonstrate OP-induced cytoprotective effects against toxic insult,18 was employed as an in vitro malignant cell model. The main aims were to primarily evaluate whether OP mediates a cytoprotective effect against oxidant-induced stress and to further ascertain whether OP can act as an anti-tumor agent in HepG2 cells via modulation of intracellular redox states, as reported for other malignant cell lines.
Methods
General experimental procedures
Unless otherwise stated, all chemicals and reagents were obtained from Sigma-Aldrich. OP was isolated at the Department of Pharmacognosy and Natural Product Chemistry, Faculty of Pharmacy, University of Athens. An initial stock of OP was prepared by dissolving the powder in dimethyl sulfoxide (DMSO) to yield a final 0.1 M solution. Lower concentrations were prepared from serial dilutions of stock solution in Dulbecco's Modified Eagle's Medium (DMEM). The final paraquat (PQ) and FeSO4 solutions were prepared following dissolution of the respective powders in DMEM.
Culture of human hepatocarcinoma HepG2 cells
HepG2 cells were obtained from the European Collection of Cell Cultures (www.ecacc.org.uk). Cells were maintained in 75 cm2 flasks in DMEM containing 10% (v/v) heat-inactivated fetal bovine serum, 1% non-essential amino acid solution, 5.5 mmol/l glucose, 100 U/ml penicillin, and 50 μg/ml streptomycin (designated as ‘supplemented DMEM’) and grown at 37°C in a humidified atmosphere of 5% CO2 and 95% air. Following sub-culture in 0.1% (w/v) trypsin and 0.02% (w/v) ethylenediaminetetraacetic acid (EDTA, Versene), cells were seeded, as appropriate, in supplemented DMEM containing 5% (v/v) FBS in 25 cm2 flasks or plates. Final incubations were performed with sub-confluent cultures of HepG2 cells in the passage range 25–48 in supplemented DMEM containing 1% (v/v) FBS.
Measurement of cell viability and death
Cell viability was assessed via measurement of enzymatic conversion of the yellow tetrazolium salt 3-(4, 5-dimethylthiazol-2-yl)-2, 5-diphenyltetrazolium bromide (MTT) into purple formazan, as described previously.19 Evaluation of the mode of cell death for each treatment was based on staining with 4′,6-diamidino-2-phenylindole (DAPI)-propidium iodide (PI).19 Specifically, nuclei of apoptotic cells appeared blue with intense chromatin condensation and apoptotic body formation. In contrast, post-apoptotic and necrotic cell nuclei-stained pink due to entry of PI through damaged sites on the plasma membrane. For DAPI-PI staining, HepG2 cells were plated in 24-well plates at a density of 10,000 cells/well, and 1000 randomly distributed nuclei counted per sample and scored as morphologically normal, apoptotic, or necrotic using an inverted fluorescence microscope.
Measurement of superoxide production
Superoxide anion production was assessed using the nitroblue tetrazolium (NBT) assay,19 as described previously. Briefly, HepG2 cells (2 × 10⁶ cells/well) were cultured in six-well plates until ∼80% confluency before incubation with a medium containing the treatment agent (PQ, OP, or both) and 25 μg/ml (30 μmol/l) NBT. After 24 hours, the medium was discarded and 70% (v/v) methanol was added to terminate the reaction. Following rinsing with 100% methanol, the resultant blue formazan crystals were solubilized in a 1:1.167 mixture of potassium hydroxide (2 M) and DMSO, and absorbance read at 690 nm.
Measurement of lipid peroxidation
Production of hydroxyl radicals (·OH) and malondialdehyde (MDA) in sub-confluent HepG2 cells cultured in 25 cm2 flasks (∼4 × 10⁶ cells/flask) in the presence of FeSO4 + H2O2, OP, or both was evaluated using the thiobarbituric acid-reactive substances (TBARS) assay.20 Briefly, sub-confluent HepG2 cells were incubated with each treatment solution for 24 hours, harvested in 0.5 ml ice-cold 1.15% potassium chloride (KCl) containing 3 mM EDTA, and sonicated on ice for 60 seconds. Following centrifugation at 500g for 10 minutes at 4°C, 500 µl supernatant or 19-tetramethoxypropan (TMOP) used for the preparation of MDA standards21 was added separately to 3 ml phosphoric acid and 1 ml TBA solution [1% (v/v) phosphoric acid, 1% (w/v) TBA in 50 mM NaOH containing 15 µl of 2% (v/v) butylated hydroxytoluene in ethanol], and the resulting solution heated in a water bath at 95°C for 45 minutes. Thereafter, 4 ml n-butanol was added to the mixture and the chromogen formed was extracted into the butanol layer, which was separated from the aqueous layer by centrifugation at 2000g for 20 minutes. Absorbance was measured at 540 nm using a UV-1700 SHIMADZU spectrophotometer.
Western blotting
Total protein was extracted from HepG2 cells using modified protein extraction buffer. Following centrifugation at 10 000g for 30 minutes at 4°C, supernatants were collected and assayed for protein content using the Bradford assay. In total, 60 μg protein was loaded onto each lane of an sodium dodecyl sulfate (SDS) gel and allowed to separate at 120 V for 90 minutes. Proteins were transferred to nitrocellulose membranes (Amersham) at 4°C and 100 V for 80 minutes. Next, membranes were blocked using 5% (w/v) powdered milk for 1 hour and incubated with primary antibodies overnight at 4°C. Rabbit polyclonal anti-poly ADP-ribose polymerase (PARP) (Cell Signaling Technology, Bioline Scientific, Athens, Greece; 1:1000 dilution), mouse monoclonal anti-β-tubulin (1:500 dilution), and mouse monoclonal anti-GAPDH (1:1000 dilution) were used as the primary antibodies. Following incubation with the appropriate HRP-conjugated antibodies for 1 hour, protein bands were visualized using an ECL Plus chemiluminescent detection system (Amersham). Densitometric analysis was performed using ImageJ, and individual results normalized using the corresponding GAPDH value.
Fluorescence microscopy
For immunofluorescence experiments, cells were fixed with 4% formaldehyde in PBS for 10 minutes, washed twice with PBS, and blocked for 1 hour in solution containing 0.05% Tween and 5% (v/v) FBS in PBS. Cells were incubated with primary antibodies (rabbit polyclonal anti-cleaved caspase-3 (Casp-3) (Cell Signaling Technology; 1:200 dilution) and mouse monoclonal anti-β-tubulin; 1:400 dilution) in PBS containing 5% FBS and 0.01 Tween overnight at 4°C. The next day, cells were washed twice with PBS and incubated with Alexa Fluor 488 and 594 secondary antibodies (Thermo Scientific, Athens, Greece) for 1 hour at room temperature, followed by two PBS washes and subsequent examination under a confocal laser scanning microscope (Carl Zeiss). Five to seven confocal microscopic fields were taken for each treatment group and analysis for corrected total fluorescence was performed. At least 20 cells per treatment were examined using ImageJ.
Statistical analysis
Results are expressed as mean ± standard deviation of the mean (SEM) for n independent observations. Statistical differences between the mean values of groups were determined using either unpaired t-tests for comparison of two means or one-way analysis of variance (ANOVA), followed by Dunnett's post-significance test for comparison of multiple means with commercially available software (Graphpad Prism, version 4.0, Graphpad Software, San Diego, CA, USA). The level of significance was set at P < 0.05.
Results
OP partially restores HepG2 cell viability in the presence of PQ, but has no effect on cellular viability as a sole treatment agent
Treatment of HepG2 cells with various concentrations of OP (10−8–10−4 mol/l) for 24 hours did not affect cell viability, as evident from unchanged MTT reduction (Fig. 1A). To induce oxidative stress and specific superoxide anion generation, the cationic pesticide, PQ, was employed. Treatment of cells with 0.5 mmol/l PQ for 24 hours led to 51.5% cell death. Notably, co-treatment with OP (10 or 100 µmol/l) for 24 hours partially improved cell viability by 13–18% (Fig. 1B; P < 0.01).
Figure 1.
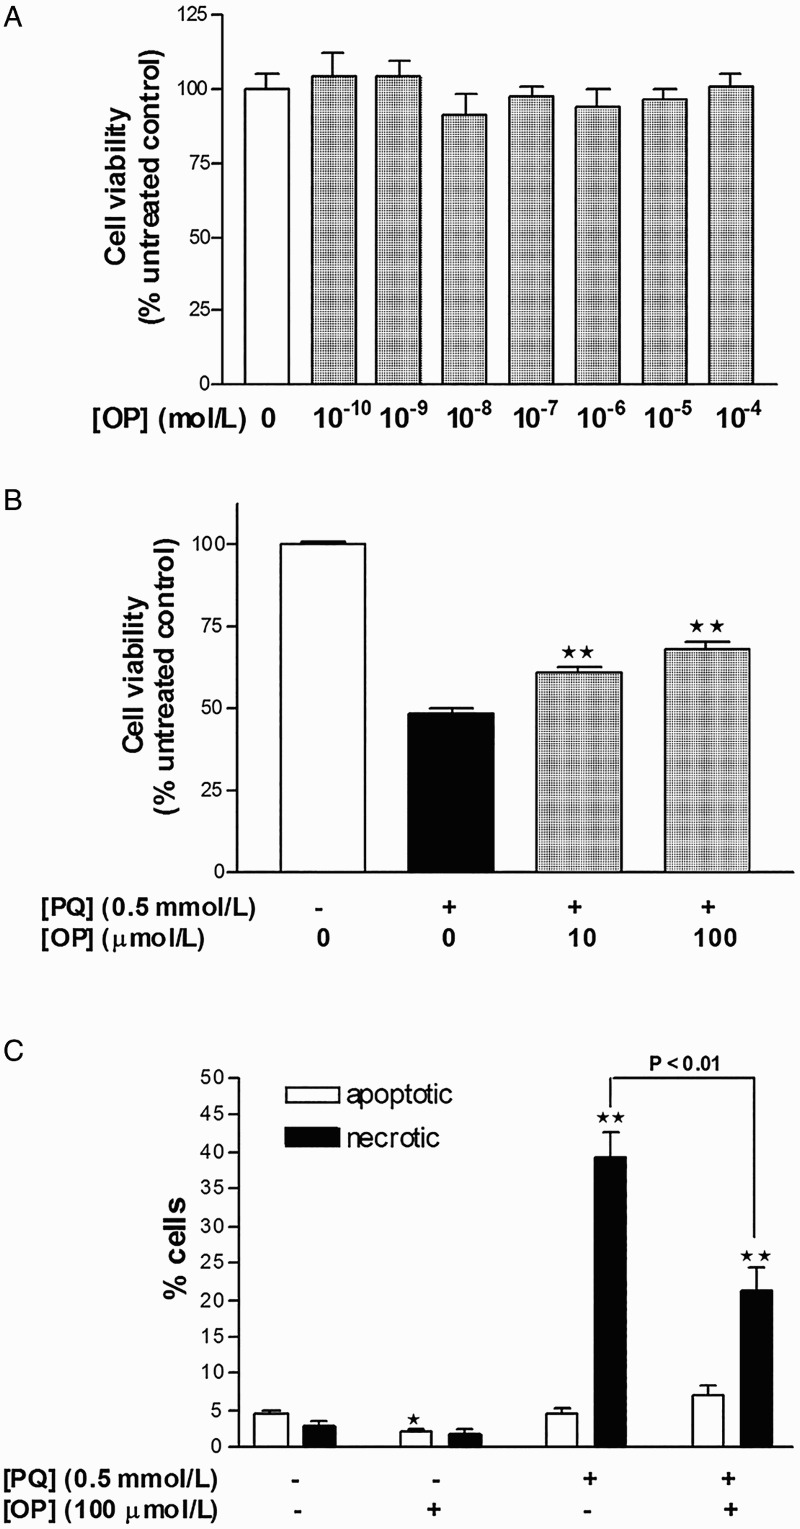
Measurement of HepG2 cellular viability with the MTT assay following 24 hours treatment with (A) increasing concentrations of oleuropein and (B) PQ with or without oleuropein. Results are expressed as means ± SEM of four to six independent experiments, with at least three replicates each. **P < 0.01 vs. PQ-treated cells.
OP-mediated protection against PQ-induced cell death involves suppression of necrosis
Treatment of HepG2 cells with PQ (0.5 mmol/l) for 24 hours resulted in 39.5% necrotic cell death, with no significant changes in apoptotic rates, compared to control (Fig. 1C). Cells concomitantly incubated with PQ (0.5 mmol/l) and OP (100 µmol/l) for 24 hours displayed reduced necrosis by 16% as well as a trend of increased apoptosis, compared to PQ-only-treated cells (Fig. 1C). One morphological difference between necrotic cells of the PQ-only- and PQ + OP-treated groups was that the cells of the latter group appeared post-apoptotic/necrotic whereby nuclei were stained pink and possessed apoptotic bodies. This finding signifies that necrosis in the PQ + OP group occurs as a secondary event following apoptosis induction. Application of OP alone reduced the basal apoptotic rate by 1.7%, with no effect on necrosis (Fig. 1C).
OP further potentiates superoxide anion and MDA production in HepG2 cells
Incubation of cells with either 0.5 mmol/l PQ or 100 μmol/l OP for 24 hours induced a significant increase in superoxide production in HepG2 cells. Notably, simultaneous incubation of cells with both agents for 24 hours yielded a greater increase in superoxide levels, compared to those recorded upon treatment with the individual agents (Fig. 2A). PQ failed to induce lipid peroxidation and MDA adduct formation in HepG2 cells, although this has been observed in other cell lines in vitro.22 To overcome this issue, a solution of Fe2SO4 + H2O2 was employed to stimulate the Fenton reaction for producing .OH radicals. As expected, incubation of HepG2 cells with 0.5 mmol/l Fe2SO4 + 100 μmol/l H2O2 for 24 hours promoted the production of MDA adducts, compared to untreated cells, and co-incubation with 100 μmol/l OP for 24 hours induced a further increase in MDA adduct formation, compared to 0.5 mmol/l Fe2SO4 + 100 μmol/l H2O2 alone (Fig. 2B).
Figure 2.
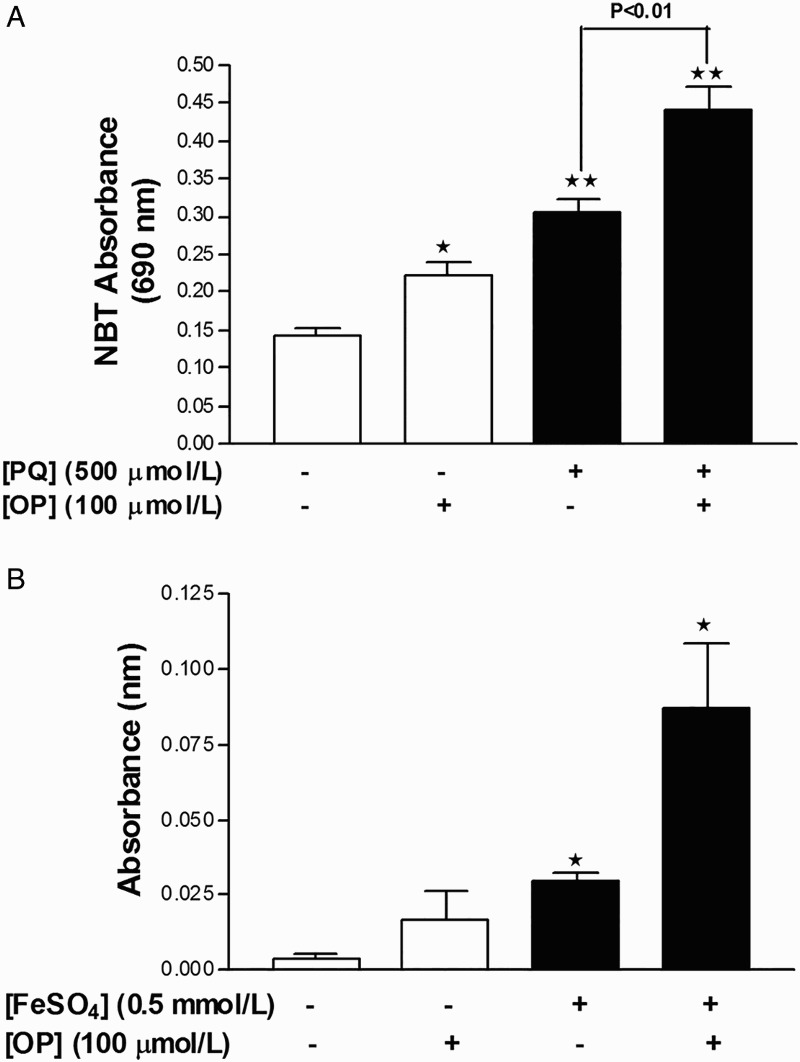
OP potentiates oxidant production in HepG2 cells. (A) Measurement of superoxide anion production with the NBT assay in cells treated with PQ, OP, or both for 24 hours. (B) Measurement of lipid peroxidation (MDA) with the TBARS assay in cells treated with FeSO4 + H2O2, OP, or both for 24 hours. Results are expressed as mean ± SEM of six independent experiments for NBT and three independent experiments for MDA. *P < 0.05 and **P < 0.01 vs. untreated control.
OP enhances PARP cleavage and partially restores β-tubulin expression upon co-incubation with PQ
Incubation of cells with 100 μmol/l OP for 24 hours did not affect PARP levels, while treatment with 0.5 mmol/l PQ for 24 hours induced a four-fold increase in PARP cleavage (Fig. 3A and B) and suppressed β-tubulin expression by 43% (Fig. 3A and C). In cells co-incubated with 0.5 mmol/l PQ + 100 μmol/l OP for 24 hours, PARP cleavage was augmented six-fold and the β-tubulin level partially restored, compared to PQ-only-treated cells (Fig. 3).
Figure 3.
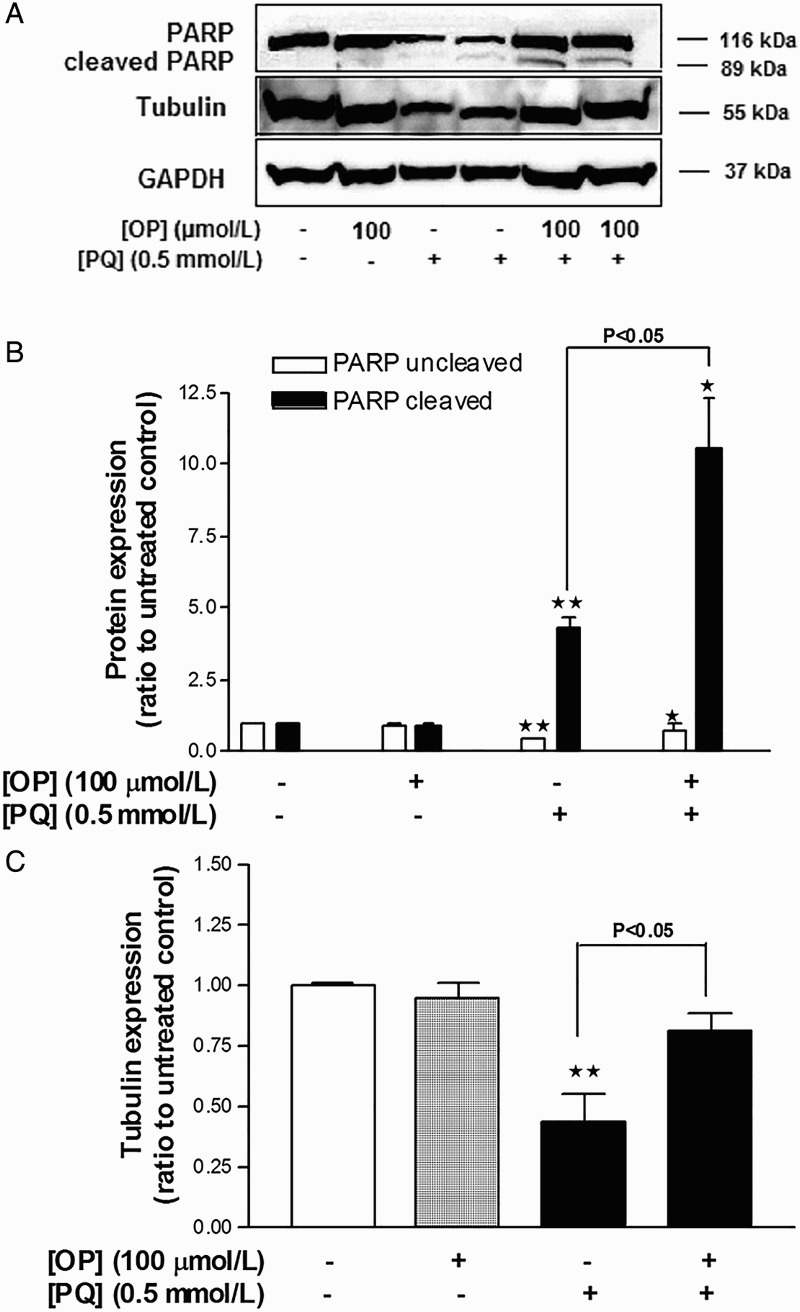
Effects of OP on PQ-induced changes in the levels of β-tubulin expression and PARP cleavage in HepG2 cells. (A) Western blot image. (B) Densitometric analysis of PARP expression. (C) Densitometric analysis of β-tubulin expression. Results were normalized using the corresponding GAPDH values. Data represent means ± SEM, n = 4. *P < 0.05 and **P < 0.01 vs. untreated control, ANOVA, Dunnett's post-test.
PQ promotes Casp-3 cleavage and nuclear translocation of fragments while OP suppresses Casp-3 cleavage
Treatment of cells with PQ (0.5 mmol/l) for 24 hours triggered a 2.4-fold increase in Casp-3 cleavage, compared to control, as well as nuclear translocation of the Casp-3 fragments (Fig. 4A and B). Treatment of cells with OP (100 µmol/l) did not affect Casp-3 cleavage relative to control cells, based on comparable immunofluorescence findings between the two groups. However, cells co-treated with OP and PQ displayed significantly reduced PQ-induced Casp-3 cleavage (Fig. 4A and B).
Figure 4.
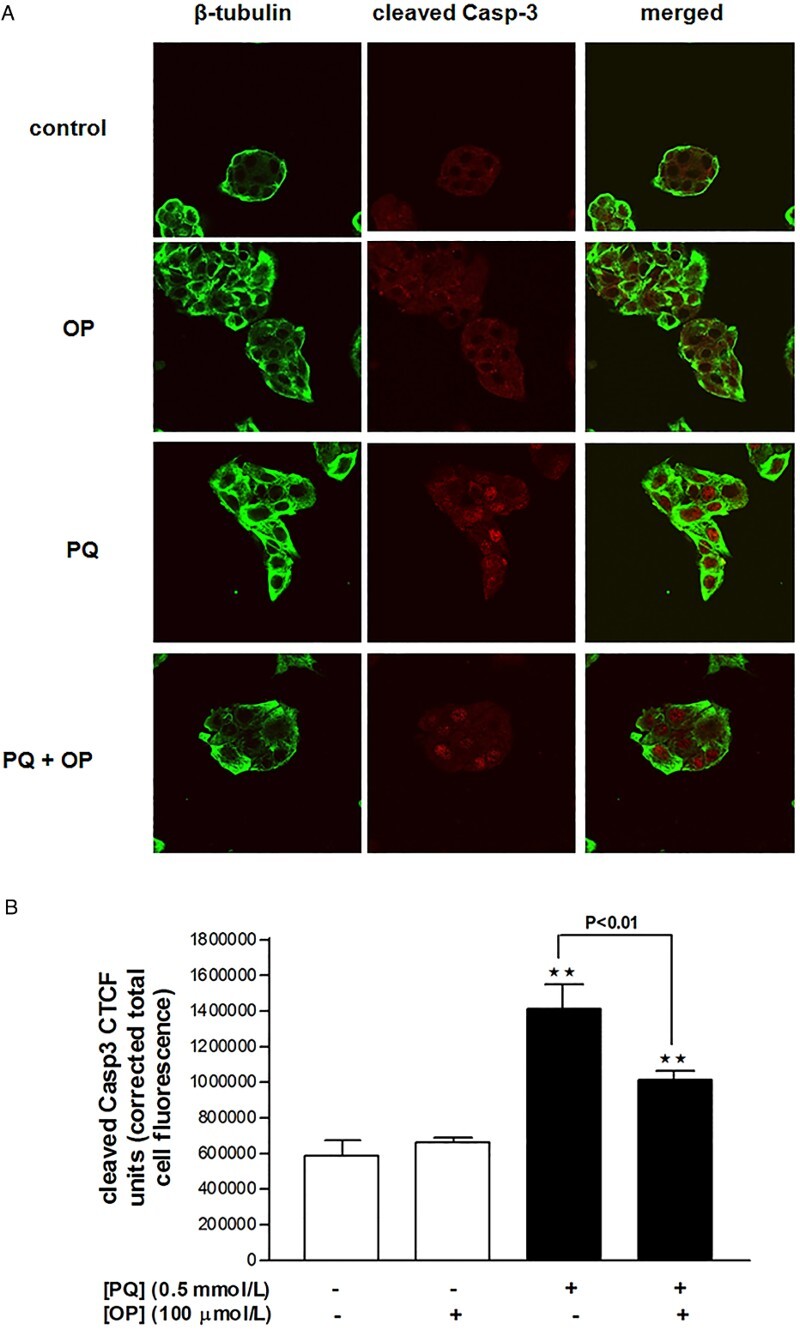
Cleaved caspase-3 immunofluorescence in HepG2 cells treated with OP (100 µmol/l), PQ (0.5 mmol/l) or both for 24 hours. (A) Confocal images and (B) analysis of corrected total cell fluorescence.
Discussion
Considerable evidence supports the protective and antioxidant effects of OP against various pathological states, from metabolism to cancer. Data from the current study demonstrate that although OP partially rescues HepG2 cells against oxidant-induced damage, the compound itself displays pro-oxidant activity without exerting toxic effects. Since OP and PQ individually promote superoxide generation, it was reasonable to expect a robust increase in superoxide levels when both compounds were included in the treatment medium. Similarly, OP potentiated MDA generation, which was augmented further upon inclusion of FeSO4 + H2O2 in medium, clearly indicating that OP stimulates ROS production in HepG2 cells.
OP-induced redox perturbation had no effect on HepG2 cell viability, as evident from the unchanged MTT reduction and the absence of cleaved PARP signal. The non-toxic effects of OP were further confirmed with DAPI-PI results and lack of cleaved Casp-3 signal. Consistently, incubation of HepG2 cells with OP for 48 hours did not induce PARP cleavage (data not shown). Rather, OP improved cell viability and normalized β-tubulin expression, which were compromised by PQ,23 supporting the theory that it partially restores cytoskeletal HepG2 cell integrity. The protection afforded by OP against PQ-induced cell death involved a significant reduction in necrotic cell death levels, accompanied by suppression of Casp-3 cleavage. Although nuclear translocation of Casp-3 is fundamentally associated with apoptosis in HepG224 and other cell types,25 Casp-3 is also reported to be involved in necrotic cell death,26 which may be the case here.
Three lines of evidence presented here suggest that OP-mediated protection is actually due to a delay in cell death onset as well as a shift from the necrotic pathway to apoptosis. Firstly, necrosis in the combined treatment group (PQ + OP) appeared to follow an apoptosis event (based on the finding of apoptotic bodies engulfed within necrotic nuclei). Secondly, significant increase in cleaved PARP levels in the combined treatment group, compared to PQ-only-treated cells, was observed. This finding is of particular importance, as it reveals a shift to apoptosis.27 Thirdly, the protective effects of OP on cellular viability were lost following 48 hours treatment with PQ (Supplementary Material). Accordingly, it is concluded that OP enables HepG2 cells to initially cope better with PQ insult and survive longer, prior to entering a more regulated cell death phase, rather than experiencing necrosis instantly as is the case for PQ-treated cells.
The possibility that the protective properties of OP may be mediated via upregulation of antioxidant enzyme levels and/or activity cannot be ruled out. In this case, the initial boost of superoxide and hydroxyl radicals may either be an artifact,28 which seems unlikely since superoxide is generated intracellularly, or the beginning of a preconditioning mechanism initiated by OP, which, in turn, protects against PQ-induced ROS-mediated cell damage. To provide more comprehensive data, a detailed study is required with emphasis on the intracellular antioxidant enzyme levels. In support of this theory, OP has been shown to positively regulate the hepatic endogenous antioxidant enzyme system in rats.13 Alternatively, OP-induced MDA production could be explained by the fact that OP itself is oxidized by ROS,29 generating peroxides. This scenario reflects the antioxidant potency of OP through its potential function as a target shield for ROS, inhibiting the oxidation of other subcellular compartments (e.g. proteins, lipids, and DNA).30
The manner in which OP-induced ROS accumulation affects cell viability is of significant interest and a subject of controversy. As discussed below, OP and HTyr exert differential and even opposite effects on the viability and redox state of cells, depending on (i) the cell type used (tumorous or non-malignant), (ii) concentration of the applied agent, and (iii) duration of exposure to the agent. While OP and HTyr mainly appear to exert antioxidant effects in non-malignant hepatic tissue,10,31 they are believed to generate an ROS-mediated apoptotic cascade in tumorous cell lines, as reported for HL-60,32 breast cancer,33 and prostate cancer15 cells. The debate on antioxidant and pro-oxidant actions of OP in malignant cells has been fueled by studies demonstrating that OP acts via an antioxidant mechanism to protect against oxidant-induced damage,17 but also to induce apoptosis.12 In addition, even in the same model system, the protection afforded by OP or HTyr against oxidant-induced cell damage17 does not necessarily correlate with protection against oxidant-induced cell death.32
HTyr has been previously shown to exert potent antioxidant properties in HepG2 cells challenged with oxidants.34 The results agree with those of Goya et al. in terms of cellular protection against oxidant-induced cell death, but not the oxidative boost observed in the presence of OP in medium. Accordingly, it is concluded that the properties of OP are different from those of its metabolite, HTyr. Moreover, PQ in rodent liver is detoxified by cytochrome P450 (CYP) enzymes35 that display compromised activity upon HTyr treatment.31 The issue of whether CYP inhibition due to OP exists in our model system and contributes to the increase in oxidative stress, possibly due to longer-term maintenance of PQ within the cell, remains to be clarified.
The concentration of OP applied to the test system and the duration of exposure are potential key determinants of the biological properties of the compound in malignant cells. Concentrations of OP ranging from 1 to 10 µmol/l have been shown to exert antioxidant and DNA protective activities,17 while doses greater than 100 µmol/l result in cell death.36,37 Several studies have demonstrated OP-induced apoptosis following prolonged treatment, e.g. 72 hours incubation.15,33 Here, we have elucidated the early events underlying the observed improvement in viability of HepG2 cells under PQ insult following treatment with high concentrations of OP.
Although the evidence reported here lacks validity for use in an in vivo model, these data have provided critical information on the drawbacks of OP treatment in an in vitro model of hepatocyte cell injury. Growth and proliferation of tumor cells is largely dependent on increased ROS,38,39 which, in many instances, serve as intracellular signaling mediators of growth, while in non-tumor cells, excessive ROS generation coincides with initiation of cytotoxic signaling cascades. Considering a protective role of OP in HepG2 cells, it may therefore be reasonable to suggest that the compound acts via upregulation of intracellular ROS to maintain the growth capacity of HepG2 cells as well as set up a pro-oxidant preconditioning environment to defend against oxidant insult (e.g. PQ). In support of this theory, viability was further increased in cells treated with OP for 48 hours, compared to untreated cells (Supplementary Material). In contrast, as a potential anti-tumor agent, OP could sensitize cells to oxidative stress whereby prolonged treatment (e.g. over 72 hours) results in apoptotic cell death, an assumption that seems unlikely in view of the data presented here.
The current findings do not challenge the current view of OP as a strong antioxidant substance, but indicate opposing effects in in vitro models depending on the cell type used in each case, raise concerns on the tight balance between oxidant and antioxidant states, and depict the risk of generalizing in vitro findings while attempting to characterize the true properties of OP. Care should therefore be taken when selecting a tumor cell line as a model for hepatotoxicity studies, since hepatoprotective agents such as OP may also possess anti-tumor effects, making the derivation of accurate conclusions difficult. Based on the collective findings to date, it is concluded that the ‘precise’ balance of pro-oxidant and antioxidant states, as discussed by Halliwell,39 is crucial for determining cell fate.
Acknowledgements
The author thanks E. Tsilibary and K. Machera for providing experimental materials and A. Kaminari, E. Tsalavoutas, K. Kyriakopoulou, and E. Katsanou for their support. Oleuropein was isolated and kindly provided by Dr N. Fokialakis. The language of the manuscript has been edited by the Charlesworth Group Author Services.
Disclaimer statements
Contributors None.
Funding Part of this work was carried out at Benaki Phytopathological Institute (BPI), Athens, Greece, and was partly funded by BPI Plant Heal – FP7-REGPOT-2008-1, No. 230010.
Conflicts of interest There are no conflicts of interest.
Ethics approval No ethical approval was required. The study is entirely based in vitro.
References
- 1.Filik L, Ozyilkan O. Olive-oil consumption and cancer risk. Eur J Clin Nutr 2003;57(1):191. [DOI] [PubMed] [Google Scholar]
- 2.Cristina F. Mediterranean diet health benefits may be due to a synergistic combination of phytochemicals and fatty-acids. BMJ 2005;331(7508):E366. [DOI] [PubMed] [Google Scholar]
- 3.Topalovic DZ, Zivkovic L, Cabarkapa A, Djelic N, Bajic V, Dekanski D, et al. Dry olive leaf extract counteracts l-thyroxine-induced genotoxicity in human peripheral blood leukocytes in vitro. Oxid Med Cell Longev 2015;2015:762192. [DOI] [PMC free article] [PubMed] [Google Scholar]
- 4.Turkez H, Togar B, Polat E. Olive leaf extract modulates permethrin induced genetic and oxidative damage in rats. Cytotechnology 2012;64(4):459–64. [DOI] [PMC free article] [PubMed] [Google Scholar]
- 5.de Bock M, Thorstensen EB, Derraik JG, Henderson HV, Hofman PL, Cutfield WS. Human absorption and metabolism of oleuropein and hydroxytyrosol ingested as olive (Olea europaea L.) leaf extract. Mol Nutr Food Res 2013;57(11):2079–85. [DOI] [PubMed] [Google Scholar]
- 6.Tan HW, Tuck KL, Stupans I, Hayball PJ. Simultaneous determination of oleuropein and hydroxytyrosol in rat plasma using liquid chromatography with fluorescence detection. J Chromatogr B Analyt Technol Biomed Life Sci 2003;785(1):187–91. [DOI] [PubMed] [Google Scholar]
- 7.Vissers MN, Zock PL, Roodenburg AJ, Leenen R, Katan MB. Olive oil phenols are absorbed in humans. J Nutr 2002;132(3):409–17. [DOI] [PubMed] [Google Scholar]
- 8.Corona G, Tzounis X, Assunta Dessi M, Deiana M, Debnam ES, Visioli F, et al. The fate of olive oil polyphenols in the gastrointestinal tract: implications of gastric and colonic microflora-dependent biotransformation. Free Radic Res 2006;40(6):647–58. [DOI] [PubMed] [Google Scholar]
- 9.Bonanome A, Pagnan A, Caruso D, Toia A, Xamin A, Fedeli E, et al. Evidence of postprandial absorption of olive oil phenols in humans. Nutr Metab Cardiovasc Dis 2000;10(3):111–20. [PubMed] [Google Scholar]
- 10.Domitrovic R, Jakovac H, Marchesi VV, Sain I, Romic Z, Rahelic D. Preventive and therapeutic effects of oleuropein against carbon tetrachloride-induced liver damage in mice. Pharmacol Res 2012;65(4):451–64. [DOI] [PubMed] [Google Scholar]
- 11.Cardeno A, Sanchez-Hidalgo M, Rosillo MA, de la Lastra CA. Oleuropein, a secoiridoid derived from olive tree, inhibits the proliferation of human colorectal cancer cell through downregulation of HIF-1alpha. Nutr Cancer 2013;65(1):147–56. [DOI] [PubMed] [Google Scholar]
- 12.Bulotta S, Corradino R, Celano M, Maiuolo J, D'Agostino M, Oliverio M, et al. Antioxidant and antigrowth action of peracetylated oleuropein in thyroid cancer cells. J Mol Endocrinol 2013;51(1):181–9. [DOI] [PubMed] [Google Scholar]
- 13.Jemai H, Bouaziz M, Fki I, El Feki A, Sayadi S. Hypolipidimic and antioxidant activities of oleuropein and its hydrolysis derivative-rich extracts from Chemlali olive leaves. Chem Biol Interact 2008;176(2–3):88–98. [DOI] [PubMed] [Google Scholar]
- 14.Anter J, Fernandez-Bedmar Z, Villatoro-Pulido M, Demyda-Peyras S, Moreno-Millan M, Alonso-Moraga A, et al. A pilot study on the DNA-protective, cytotoxic, and apoptosis-inducing properties of olive-leaf extracts. Mutat Res 2011;723(2):165–70. [DOI] [PubMed] [Google Scholar]
- 15.Acquaviva R, Di Giacomo C, Sorrenti V, Galvano F, Santangelo R, Cardile V, et al. Antiproliferative effect of oleuropein in prostate cell lines. Int J Oncol 2012;41(1):31–8. [DOI] [PubMed] [Google Scholar]
- 16.Yao J, Wu J, Yang X, Yang J, Zhang Y, Du L. Oleuropein induced apoptosis in HeLa cells via a mitochondrial apoptotic cascade associated with activation of the c-Jun NH2-terminal kinase. J Pharmacol Sci 2014;125(3):300–11. [DOI] [PubMed] [Google Scholar]
- 17.Fabiani R, Rosignoli P, De Bartolomeo A, Fuccelli R, Servili M, Montedoro GF, et al. Oxidative DNA damage is prevented by extracts of olive oil, hydroxytyrosol, and other olive phenolic compounds in human blood mononuclear cells and HL60 cells. J Nutr 2008;138(8):1411–6. [DOI] [PubMed] [Google Scholar]
- 18.Hur W, Kim SW, Lee YK, Choi JE, Hong SW, Song MJ, et al. Oleuropein reduces free fatty acid-induced lipogenesis via lowered extracellular signal-regulated kinase activation in hepatocytes. Nutr Res 2012;32(10):778–86. [DOI] [PubMed] [Google Scholar]
- 19.Katsoulieris E, Mabley JG, Samai M, Sharpe MA, Green IC, Chatterjee PK. Lipotoxicity in renal proximal tubular cells: relationship between endoplasmic reticulum stress and oxidative stress pathways. Free Radic Biol Med 2010;48(12):1654–62. [DOI] [PubMed] [Google Scholar]
- 20.Halliwell B, Grootveld M, Gutteridge JM. Methods for the measurement of hydroxyl radicals in biomedical systems: deoxyribose degradation and aromatic hydroxylation. Methods Biochem Anal 1988;33:59–90. [DOI] [PubMed] [Google Scholar]
- 21.Sozo F, O'Day L, Maritz G, Kenna K, Stacy V, Brew N, et al. Repeated ethanol exposure during late gestation alters the maturation and innate immune status of the ovine fetal lung. Am J Physiol Lung Cell Mol Physiol 2009;296(3):L510–8. [DOI] [PubMed] [Google Scholar]
- 22.Kim H, Lee SW, Baek KM, Park JS, Min JH. Continuous hypoxia attenuates paraquat-induced cytotoxicity in the human A549 lung carcinoma cell line. Exp Mol Med 2011;43(9):494–500. [DOI] [PMC free article] [PubMed] [Google Scholar]
- 23.Li WD, Zhao YZ, Chou IN. Paraquat-induced cytoskeletal injury in cultured cells. Toxicol Appl Pharmacol 1987;91(1):96–106. [DOI] [PubMed] [Google Scholar]
- 24.Kamada S, Kikkawa U, Tsujimoto Y, Hunter T. Nuclear translocation of caspase-3 is dependent on its proteolytic activation and recognition of a substrate-like protein(s). J Biol Chem 2005;280(2):857–60. [DOI] [PubMed] [Google Scholar]
- 25.Zhivotovsky B, Samali A, Gahm A, Orrenius S. Caspases: their intracellular localization and translocation during apoptosis. Cell Death Differ 1999;6(7):644–51. [DOI] [PubMed] [Google Scholar]
- 26.Niquet J, Allen SG, Baldwin RA, Wasterlain CG. Evidence of caspase-3 activation in hyposmotic stress-induced necrosis. Neurosci Lett 2004;356(3):225–7. [DOI] [PubMed] [Google Scholar]
- 27.Herceg Z, Wang ZQ. Failure of poly(ADP-ribose) polymerase cleavage by caspases leads to induction of necrosis and enhanced apoptosis. Mol Cell Biol 1999;19(7):5124–33. [DOI] [PMC free article] [PubMed] [Google Scholar]
- 28.Odiatou EM, Skaltsounis AL, Constantinou AI. Identification of the factors responsible for the in vitro pro-oxidant and cytotoxic activities of the olive polyphenols oleuropein and hydroxytyrosol. Cancer Lett 2013;330(1):113–21. [DOI] [PubMed] [Google Scholar]
- 29.Sakihama Y, Cohen MF, Grace SC, Yamasaki H. Plant phenolic antioxidant and prooxidant activities: phenolics-induced oxidative damage mediated by metals in plants. Toxicology 2002;177(1):67–80. [DOI] [PubMed] [Google Scholar]
- 30.Visioli F, Bellomo G, Galli C. Free radical-scavenging properties of olive oil polyphenols. Biochem Biophys Res Commun 1998;247(1):60–4. [DOI] [PubMed] [Google Scholar]
- 31.Gutierrez VR, de la Puerta R, Catala A. The effect of tyrosol, hydroxytyrosol and oleuropein on the non-enzymatic lipid peroxidation of rat liver microsomes. Mol Cell Biochem 2001;217(1–2):35–41. [DOI] [PubMed] [Google Scholar]
- 32.Fabiani R, Fuccelli R, Pieravanti F, De Bartolomeo A, Morozzi G. Production of hydrogen peroxide is responsible for the induction of apoptosis by hydroxytyrosol on HL60 cells. Mol Nutr Food Res 2009;53(7):887–96. [DOI] [PubMed] [Google Scholar]
- 33.Elamin MH, Daghestani MH, Omer SA, Elobeid MA, Virk P, Al-Olayan EM, et al. Olive oil oleuropein has anti-breast cancer properties with higher efficiency on ER-negative cells. Food Chem Toxicol 2013;53:310–6. [DOI] [PubMed] [Google Scholar]
- 34.Goya L, Mateos R, Bravo L. Effect of the olive oil phenol hydroxytyrosol on human hepatoma HepG2 cells. Protection against oxidative stress induced by tert-butylhydroperoxide. Eur J Nutr 2007;46(2):70–8. [DOI] [PubMed] [Google Scholar]
- 35.Ahmad I, Shukla S, Kumar A, Singh BK, Kumar V, Chauhan AK, et al. Biochemical and molecular mechanisms of N-acetyl cysteine and silymarin-mediated protection against maneb- and paraquat-induced hepatotoxicity in rats. Chem Biol Interact 2013;201(1–3):9–18. [DOI] [PubMed] [Google Scholar]
- 36.Han J, Talorete TP, Yamada P, Isoda H. Anti-proliferative and apoptotic effects of oleuropein and hydroxytyrosol on human breast cancer MCF-7 cells. Cytotechnology 2009;59(1):45–53. [DOI] [PMC free article] [PubMed] [Google Scholar]
- 37.Hassan ZK, Elamin MH, Omer SA, Daghestani MH, Al-Olayan ES, Elobeid MA, et al. Oleuropein induces apoptosis via the p53 pathway in breast cancer cells. Asian Pac J Cancer Prev 2014;14(11):6739–42. [DOI] [PubMed] [Google Scholar]
- 38.Valko M, Izakovic M, Mazur M, Rhodes CJ, Telser J. Role of oxygen radicals in DNA damage and cancer incidence. Mol Cell Biochem 2004;266(1–2):37–56. [DOI] [PubMed] [Google Scholar]
- 39.Halliwell B. Oxidative stress and cancer: have we moved forward? Biochem J 2007;401(1):1–11. [DOI] [PubMed] [Google Scholar]