

Abstract
This study was undertaken to investigate the effects of oral L-arginine administration and exercising training on the NO concentration emanating from rat tail and NOx in plasma. Obese (fa/fa) Zucker rats (n = 22) were divided into four groups: (1) oral L-arginine administration (A) (n = 6), (2) exercise training (E), (3) exercise training + L-arginine administration (E + A) (n = 5), and (4) non-exercise training + non-L-arginine administration (N) (n = 6). The control (+/+) Zucker rats (n = 22) were also divided into the same four groups. The body weight of the E + A and the A groups was significantly lower than that of the N group. The NO concentration emitted from the tail was higher in the L-arginine (E + A and A) groups than in the non-L-arginine (E and N) groups in both obese and control rats. Exercise training did not affect the skin gas NO concentration in either obese or control rats. Plasma NOx concentrations in four obese rats were significantly higher than those observed in control rats. Exercise training did not influence the level of plasma NOx in obese or control rats. In conclusion, this study confirmed that L-arginine administration increases the skin gas NO concentration and obesity increases the plasma NOx level. The plasma NOx concentrations were not affected by L-arginine administration or exercise training in obese or control rats.
Keywords: Obese, Rat tail, Nitric oxide, Skin gas, Nitrate, L-arginine, Exercise
Introduction
It has been reported that NO is detected in exhaled air1–3 and gas emanating from human skin.3 The concentration of NO in exhaled breath and skin gases strongly depends on several factors, such as inflammatory disease,2 physical exercise,1 smoking,4 breath holding,4,5 and hypoxia.6
NO is synthesized in endothelial cells from L-arginine by the activity of the endothelial, calcium-dependent isoform of NO synthase.7,8 NO is rapidly oxidized to NO2− (nitrite) and NO3− (nitrate) in vivo,9 and NO3− is subsequently eliminated via excretion into the urine.10 It is well known that the serum levels of NOx (NO2− and NO3−) reflect the total NO production in the body.11 The serum NOx level is increased by oral L-arginine treatment in Zucker diabetic fatty rats12 and in the urine of healthy subjects.13 However, no reports have been published regarding the effects of the oral administration of L-arginine on the NO concentration in skin gas.
It has previously been demonstrated that the level of NOx in plasma increase following dynamic exercise training.14,15 On the other hand, Pialoux et al.16 reported that exercise training does not influence the plasma NOx level. Therefore, the effects of exercise training on the plasma NOx level remain unclear.
L-arginine administration reduces the weight of abdominal and epididymal adipose tissue in the setting of diabetes.12,17 However, a few reports have noted that there are no significant differences in body weight after L-arginine treatment in healthy rats18 and or human heart failure subjects.19 Therefore, the influence of L-arginine oral administration on body weight remains equivocal.
The present study was performed to evaluate the effects of L-arginine administration and exercising training on the NO concentrations emanating from rat tails and the plasma NOx levels in obese (fa/fa) Zucker rats.
Methods
Experimental protocol
Male obese (fa/fa) and control (+/+) Zucker rats were purchased at 5 weeks of age from Japan SLC (Shizuoka, Japan). The protocols of the animal experiments were approved by the Ethical Committee of Nagoya Institute of Technology. The mean body weight at 5 weeks of age was 109.5 ± 7.1 g in obese rats and 103.1 ± 9.8 g in control rats. The obese rats (n = 22) were divided into four groups according to a similar weight: (1) L-arginine group (A) (n = 6), oral administration of L-arginine (6% in drinking water); (2) exercise training group (E) (n = 5), treadmill exercise training; (3) exercise training + L-arginine group (E + A) (n = 5), oral administration of L-arginine (6% in drinking water) + treadmill exercise training; and (4) non-exercise and non-L-arginine (N) (n = 6). The control (+/+) rats (n = 22) were divided into the same four groups according to a similar weight. In the E and the E + A groups, exercise training was conducted 5 days/week over 4 weeks. The running speed was 10 m/minute for 20 minutes in the first 2 weeks, followed by 12.5 m/minute for 30 minutes in the last 2 weeks. All rats were housed individually in a temperature-controlled room (22 ± 1°C), received food and water ad libitum throughout the experiment and were maintained on a 12/12 hour light–dark cycle. The rats received a standard rodent chow (CE-2, Nihon CLEA, Tokyo, Japan). The body weight was measured once a week, and food and drinking water intake was recorded every day. The rats were accustomed to entering the pipe (22.5 cm in length and 6.2 cm in diameter) voluntarily before the experiment (Fig. 1).20 After an overnight fast, the rats were anesthetized with an intraperitoneal injection of sodium pentobarbital (50 mg/kg body weight), blood (0.3 ml) was drawn from the heart, and plasma was obtained and stored at −80°C until the analysis. The total nitrate/nitrite (NOx) levels in the plasma were determined in duplicate using a Nitrate/Nitrite Colorimetric Assay Kit (Cayman, Ann Arbor, MI, USA). The NOx concentrations in the plasma were measured spectrophotometrically at 540 nm using the Multiskan JX (Thermo Fisher Scientific Inc., MA, USA).
Figure 1.
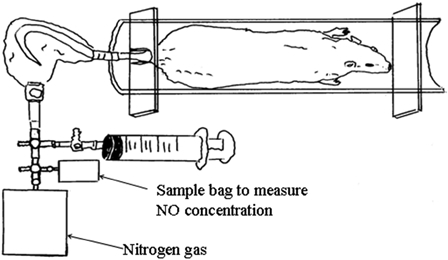
Collecting systems for assessing skin gas emanating from the rat tails.
Sampling procedure for assessing rat tail skin gas
Three days before blood sampling experiments, skin gas was obtained from the tail in all rats. The concentration of NO emanating from the tails was measured using previously described methods (Fig. 1).20 Food and drinking water was removed for minimum of 4 hours before skin gas sampling. After a rat entered the pipe (Fig. 1), the tail was washed with paper (Kimwipe S-200, Kimberly-Clark Co., Kulesia, Tokyo, Japan), dampened with distilled water and inserted into the sampling bag after the tail had dried, fixed 12 cm from the tail end with a flexible sealing film (GL Science, Tokyo, Japan). All air in the bag was sucked out with a glass syringe. Subsequently, 25 ml of nitrogen gas was infused into the sampling bag. After 10 minutes, 20 ml of skin gas was sampled from the bag and injected into another empty bag.
Analytical conditions of the NO concentrations emanating from the rat tails
The NO concentrations in the skin gas emanating from the rat tails were measured using a chemiluminescence analyzer (Pico device, Nagoya, Japan). The sampling flow rate was 100 ml/minute. The analyzer was calibrated before each measurement using pure nitrogen and four certified NO concentration gases (5, 10, 25, and 50 ppb).
Statistical analysis
The values are expressed as the mean ± standard error of the mean (M ± SEM). The data were analyzed using a one-way analysis of variance with repeated measures, with P < 0.05 determined to be statistically significant. When differences were obtained, post hoc analysis was performed using Fisher's protected least significant difference. The statistical analyses were performed using the Stat View (ver. 5.0, Abacus Corporation, California, USA) software package.
Results
Fig. 2 presents the results of a comparison of body weight between the four groups among the obese (fa/fa) and the control (+/+) Zucker rats. The mean body weight of the E group was significantly higher than that of the other three groups of obese rats (P < 0.05 or P < 0.001). The mean body weights of the L-arginine administration groups (E + A and A) were significantly lower than that of the N group (P < 0.001). In the control rats (+/+), the mean body weight of A group was significantly lower than that of the E and the N groups (P < 0.05 or P < 0.01).
Figure 2.
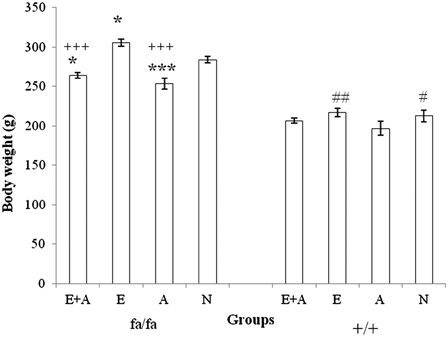
Comparison of body weight between the four groups of obese (fa/fa) and control (+/+) Zucker rats. ***P < 0.001, *P < 0.05 significant difference compared with the N group of obese rats. +++P < 0.001, P < 0.05 significant difference compared with the N group of obese rats. ##P < 0.01, #P < 0.05 significant difference compared with the A group of control rats. E, exercise; A, L-arginine; E + A, exercise + arginine; N, non-exercise and non-L-arginine.
Fig. 3 presents the results of a comparison of food intake between the four groups among the obese (fa/fa) and the control (+/+) Zucker rats. The level of food intake in the E group was significantly higher than that observed in the other three groups (P < 0.05 or P < 0.001) of obese rats. On the other hand, the level of food intake in the A group was significantly lower than that of the E and the N groups (P < 0.05).
Figure 3.
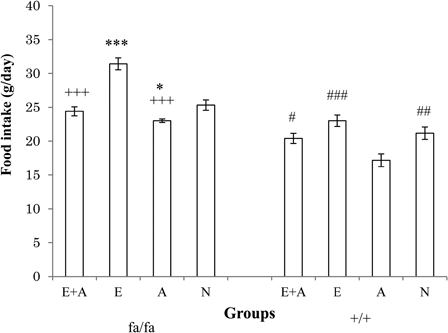
Comparison of food intake between the four groups of obese (fa/fa) and control (+/+) Zucker rats. ***P < 0.001, *P < 0.05 significant difference compared with the N group of obese rats. +++P < 0.001 significant difference compared with the E group of obese rats. ###P < 0.001, ##P < 0.01, #P < 0.05 significant difference compared with the A group of control rats. E, exercise; A, L-arginine; E + A, exercise + arginine; N, non-exercise and non-L-arginine.
Fig. 4 shows the results of a comparison of the NO concentrations emitted from the skin in the obese and control rats. The NO levels of the skin gas in the E + A and the A groups were higher than those observed in the E and the N groups among both the obese and the control rats (P < 0.001).
Figure 4.
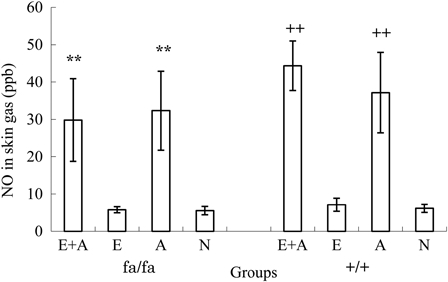
Comparison of the NO concentrations in the rat tails between the four groups. **P < 0.01. The NO concentrations were significantly higher in the L-arginine groups (A and A + E) than in the non-L-arginine groups (E and N) of obese rats. ++P < 0.01. The NO concentrations were significantly higher in the L-arginine groups (A and A + E) than in the non-L-arginine groups (E and N) of control rats.
Fig. 5 shows a comparison of the plasma NOx concentrations in obese and control rats. The plasma NOx levels were higher in the E + A, E, A, and N groups of obese rats compared with that observed in each respective group of control rats (P < 0.001). There were no significant differences between the E + A, E, A, and N groups in either the obese or control rats.
Figure 5.
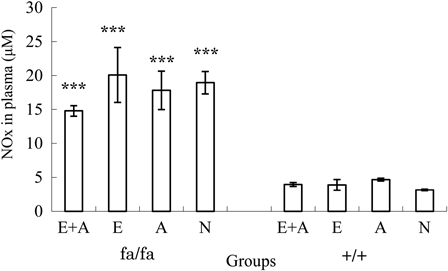
Comparison of the NOx concentrations in the plasma between the four groups. The NOx concentrations were higher in the obese rats than in the control Zucker rat. ***P < 0.001. The NOx concentrations in the plasma were significantly lower in the obese Zucker rats than in the control rats.
Discussion
This investigation found that body weights and food intake were significantly higher in obese rats than in control Zucker rats. This result generally agrees with the data of Kurtz et al.,21 who demonstrated that obese Zucker rats provide a useful experimental model of obesity. In the present study, among the obese Zucker rats, the mean body weight of the E group was significantly higher than that of the other three groups, in spite of the use of exercise training. The increase in body weight observed in the E group may be due to the volume of food intake (Figs. 2 and 3) and hypertrophy of skeletal muscle.22 On the other hand, the mean body weights of the A groups (E + A and A) were significantly lower than those of the non-L-arginine groups (E and N). The level of food intake in the A group was the lowest of the four groups of obese Zucker rats. Our results agree with the data of Fu et al.,12 who demonstrated that L-arginine treatment markedly decrease body weight due to a reduction in the weight of abdominal and epididymal adipose tissue in Zucker diabetic fatty rats. Lucotti et al.17 also reported that oral L-arginine administration decreases adipose fat mass in type 2 diabetic patients. In addition, L-arginine administration enhances the peroxisome proliferator-activated receptor γcoactivator-1α (PGC-1α) expression and activates AMP-activated protein kinase (AMPPK).12 The increases in the PGC-1α expression and AMPPK level increase the oxidation of energy substrates in skeletal muscle and adipose tissue.12 These results suggest that L-arginine administration promotes the loss of body weight in obese patients.
No reports have been published regarding the effects of L-arginine treatment on the skin gas NO concentration. A new and interesting finding of this study is that the NO concentrations emanating from the rat tails in the L-arginine groups (E + A and A) were significantly higher than those observed in the non-L-arginine administration groups among both obese and control rats (P < 0.001). NO is synthesized in endothelial cells from L-arginine, a substrate, by the activity of the endothelial, calcium-dependent isoform of NO synthase.7,8 These results suggest that L-arginine administration induces increases in the NO concentration in skin gas.
Our study showed that exercise training has no effect on the skin NO concentrations in obese and control rats. Maroun et al.23 also reported that the state of physical conditioning has no effect on the resting expired NO concentration.
The present study clarified that the plasma NOx levels were higher in obese rats than in control rats. This finding is consistent with those of previous studies showing that the serum NOx concentrations are significantly higher in human subjects with metabolic syndrome than in healthy controls.24 Although the exact mechanism regulating the plasma NOx level is not well understood, the elevation of the plasma NOx level may be due to an increase in oxidative stress.25 Lauer et al. (2002)26 suggested that NO can produce peroxynitrite in the presence of superoxide. Peroxynitrite has a very short half-life and reacts with tyrosine residues in protein to form nitrotyrosine.27 Although nitrotyrosine was not assessed in this study, Ma et al. (2011)27 reported that the levels of nitrotyrosine are higher in obese subjects than in controls due to increases in oxidative stress. Maejima et al.25 also demonstrated that the plasma NOx level is positively correlated with lipid peroxidation. In this study, the level of food intake was significantly higher in the obese rats than in the controls (Fig. 3). Because a high-calorie diet induces oxidative stress,28 the elevation of the NOx levels observed in obese individuals may be due to increases in oxidative stress. In the present study, there were no significant differences in the plasma NOx concentrations between the four groups (E + A, E, A, and N) in either obese or control rats. Our study showed that L-arginine administration does not affect the plasma NOx level, similar to the findings of a previous study, in which the plasma NOx levels remained unchanged after L-arginine infusion in healthy subjects.13
Exercise training also did not influence the levels of plasma NOx in obese or control rats. This result is in accordance with previous findings by Pialoux et al.,16 who reported that, in their study, the plasma NOx concentrations were not significantly different between the trained and the sedentary groups. However, it has been demonstrated that dynamic exercise training markedly increases the levels of NOx in postmenopausal hypertensive15 and elderly females.14 Chirico et al.29 also demonstrated that the plasma NOx levels are higher in trained subjects than in untrained subjects immediately after a maximal exercise test. The conflicting results observed between previous reports and our studies may be due to differences in the subjects (rats or humans), training methods (exercise type, intensity, training period), or disease (obesity, diabetes, hypertension).
In conclusion, this study confirmed that oral L-arginine administration increases the skin gas NO concentration and obesity increases the plasma NOx level. The plasma NOx concentrations were not affected by L-arginine administration or exercise training in either obese or control rats.
Acknowledgements
This study was supported by JSPS KAKENHI Grant Number 22500661.
References
- 1.Bauer JA, Wald JA, Doran S, Soda D. Endogenous nitric oxide in expired air: effects of acute exercise in humans. Life Sci 1994;55:1903–9. [DOI] [PubMed] [Google Scholar]
- 2.Kharitonov SA, Yates D, Robbins RA, Logan-Sinclair R, Shinebourne EA, Barnes PJ. Increased nitric oxide in exhaled air of asthmatic patients. Lancet 1994;343:133–5. [DOI] [PubMed] [Google Scholar]
- 3.Ohkuwa T, Mizuno T, Kato Y, Nose K, Itoh H, Tsuda T. Effects of hypoxia on nitric oxide (NO) in skin gas and exhaled air. Int J Med Sci 2006;2:279–83. [PMC free article] [PubMed] [Google Scholar]
- 4.Person MG, Zetterström O, Agrenius V, Ihre E, Gustafsson LE. Single-breath nitric oxide measurements in asthmatic patients and smokers. Lancet 1994;343:146–7. [DOI] [PubMed] [Google Scholar]
- 5.Jöbsis Q, Schellekens SL, Kroesbergen A, Hop WCJ, de Jongste JC. Off-line sampling of exhaled air for nitric oxide measurement in children: methodological aspects. Eur Respir J 2001;17:898–903. [DOI] [PubMed] [Google Scholar]
- 6.Hampl V, Cornfield DN, Cowan NJ, Archer SL. Hypoxia potentiates nitric oxide synthesis and transiently increases cytosolic calcium levels in pulmonary artery endothelial cells. Eur Respir J 1995;8:515–22. [PubMed] [Google Scholar]
- 7.Förstermann U, Closs EI, Pollock JS, Nakae M, Schwarz P, Gath I, et al.. Nitric oxide synthase isozymes. Hypertension 1994;23:1121–31. [DOI] [PubMed] [Google Scholar]
- 8.Verleden GM, Dupont LJ, Verpeut AC, Demedts MG. The effect of cigarette smoking on exhaled nitric oxide in mild steroid-naive asthmatics. Chest 1999;116:59–64. [DOI] [PubMed] [Google Scholar]
- 9.Wennmalm Å, Benthin G, Edlund A, Jungersten L, Kieler-Jensen N, Lundin S, et al.. Metabolism and excretion of nitric oxide in humans. Circ Res 1993;73:1121–7. [DOI] [PubMed] [Google Scholar]
- 10.Böger RH, Bode-Böger SM, Gerecke U, Gutzki F-M, Tsikas D, Frölich JC. Urinary NO3− excretion as an indicator of nitric oxide formation in vivo during oral administration of L-arginine or L-NAME in rats. Clin Exp Pharmacol Physiol 1996;23:11–5. [PubMed] [Google Scholar]
- 11.Jungersten L, Edlund A, Petersson A-S, Wennmalm Å. Plasma nitrate as an index of nitric oxide formation in man: analyses of kinetics and confounding factors. Clin Physiol 1996;16:369–79. [DOI] [PubMed] [Google Scholar]
- 12.Fu WJ, Haynes TE, Kohli R, Hu J, Shi W, Spencer TE, et al.. Dietary L-arginine supplementation reduces fat mass in Zucker diabetic fatty rats. J Nutr 2005;135:714–21. [DOI] [PubMed] [Google Scholar]
- 13.Bode-Böger SM, Böger RH, Creutzig A, Tsikas D, Gutzki F-M, Alexander K, et al.. L-arginine infusion decreases peripheral arterial resistance and inhibits platelet aggregation in healthy subjects. Clin Sci 1994;87:303–0. [DOI] [PubMed] [Google Scholar]
- 14.Maeda S, Tanabe T, Otsuki T, Sugawara J, Iemitsu M, Miyauchi T, et al.. Moderate regular exercise increases basal production of nitric oxide in elderly women. Hypertens Res 2004;27:947–53. [DOI] [PubMed] [Google Scholar]
- 15.Zaros PR, Pires CER, Bacci M, Moraes C, Zanesco A. Effect of 6-months of physical exercise on the nitrate/nitrite levels in hypertensive postmenopausal women. BMC Womens Health 2009;9:1–5. [DOI] [PMC free article] [PubMed] [Google Scholar]
- 16.Pialoux V, Brown AD, Leigh R, Friedenreich CM, Poulin MJ. Effect of cardiorespiratory fitness on vascular regulation and oxidative stress in postmenopausal women. Hypertension 2009;54:1014–20. [DOI] [PubMed] [Google Scholar]
- 17.Lucotti P, Setola E, Monti LD, Galluccio E, Costa S, Sandoli EP, et al.. Beneficial effects of a long-term oral L-arginine treatment added to a hypocaloric diet and exercise training program in obese insulin-resistant type 2 diabetic patients. Am J Physiol Endocrinol Metab 2006;291:E906–12. [DOI] [PubMed] [Google Scholar]
- 18.Lin W-T, Yang S-C, Tsai S-C, Huang C-C, Lee N-Y. L-arginine attenuates xanthine oxidase and myeloperoxidase activities in hearts of rats during exhaustive exercise. Br J Nutr 2006;95:67–75. [DOI] [PubMed] [Google Scholar]
- 19.Rector TS, Bank AJ, Mullen KA, Tschumperlin LK, Sih R, Pillai K, et al.. Randomized, double-blind, placebo-controlled study of supplemental oral L-arginine in patients with heart failure. Circulation. 1996;93:2135–41. [DOI] [PubMed] [Google Scholar]
- 20.Yamai K, Funada T, Ohkuwa T, Itoh H, Tsuda T. Acetone concentration in gas emanating from tails of diabetic rats. Anal Sci 2012;28:511–4. [DOI] [PubMed] [Google Scholar]
- 21.Kurtz TW, Morris RC, Pershadsingh HA. The Zucker fatty rat as a genetic model of obesity and hypertension. Hypertension 1989;13:896–901. [DOI] [PubMed] [Google Scholar]
- 22.Ishihara A, Roy RR, Ohhira Y, Ibata Y, Edgerton R. Hypertrophy of rat plantaris muscle fibers after voluntary running with increasing loads. J Appl Physiol 1998;84:2183–9. [DOI] [PubMed] [Google Scholar]
- 23.Maroun MJ, Mehta S, Turcotte R, Cosio MG, Hussain SNA. Effects of physical conditioning on endogenous nitric oxide output during exercise. J Appl Physiol 1995;79:1219–25. [DOI] [PubMed] [Google Scholar]
- 24.Zahedi Asl S, Ghasemi A, Azizi F. Serum nitric oxide metabolites in subjects with metabolic syndrome. Clin Biochem 2008;41:1342–7. [DOI] [PubMed] [Google Scholar]
- 25.Maejima K, Nakano S, Himeno M, Tsuda S, Makiishi H, Ito T, et al.. Increased basal levels of plasma nitric oxide in type 2 diabetic subjects: relationship to microvascular complications. J Diabetes Complications 2001;15:135–43. [DOI] [PubMed] [Google Scholar]
- 26.Lauer T, Kleinbongard P, Kelm M. Indexes of NO bioavailability in human blood. News Physiol Sci 2002;17:251–5. [DOI] [PubMed] [Google Scholar]
- 27.Ma S-X, Li X-Y, Smith BT, Jou N-T. Changes in nitric oxide, cGMP, and nitrotyrosine concentrations over skin along the meridians in obese subjects. Obesity 2011;19:1560–7. [DOI] [PMC free article] [PubMed] [Google Scholar]
- 28.Chae JS, Paik JK, Kang R, Kim M, Choi Y, Lee SH, et al.. Mild weight loss reduces inflammatory cytokines, leukocyte count, and oxidative stress in overweight and moderately obese participants treated for 3 years with dietary modification. Nutr Res 2013;33:195–203 [DOI] [PubMed] [Google Scholar]
- 29.Chirico EN, Martin C, Faёs C, Féasson L, Oyono-Enguéllé S, Aufradet E, et al.. Exercise training blunts oxidative stress in sickle cell trait carriers. J Appl Physiol 2012;112:1445–53. [DOI] [PubMed] [Google Scholar]