Summary
Metastasis - the disseminated growth of tumours in distant organs – underlies cancer mortality. Breast-to-brain metastasis (B2BM) is disconcertingly common and disruptive, being prevalent in the aggressive basal-like subtype, albeit evident at varying frequencies in all subtypes. Previous studies revealed parameters of breast cancer metastasis to brain, but its preference for this site remains an enigma. Herein we show that B2BM cells co-opt a neuronal signaling pathway recently implicated in invasive tumour growth, involving activation by glutamate ligand of an N-methyl-D-aspartate receptor (NMDAR), whose signaling is demonstrably instrumental in model systems for metastatic colonization of the brain, and associated with poor prognosis. While NMDAR receptor activation is autocrine in some primary tumour types, human and mouse B2BM cells express receptors but secrete insufficient glutamate to activate signaling, which is instead supplied via the formation of pseudo-tripartite synapses between cancer cells and glutamatergic neurons, presenting an insidious rationale for brain metastasis.
(Intro)
There has been exciting progress in the past decade defining general mechanisms by which cancer cells in solid tumours acquire the hallmark capability to metastasize1,2. Brain metastases originating from breast tumours are the most prevalent in women3. Parameters of breast-to-brain metastasis (B2BM) have been described, utilizing cancer cells selected for proficiency at seeding lesions in the brain4,5, including activation of a sialyltransferase that promotes extravasation of cancer cells through the blood-brain-barrier (BBB)4, inducers and modulators of reactive astrocytes6,7 and evasion of the activin B/ALK7 homeostatic barrier8, Although brain metastatic cancer cells can acquire neuronal cell characteristics9,10, the potential interplay between cancer cells and neurons is largely unexplored.
We previously reported that a neuronal glutamate receptor, N-methyl-D-aspartate receptor (NMDAR), promotes invasive tumour growth in neuroendocrine and ductal pancreatic cancers11–13. We implicated autocrine secretion of glutamate that stimulates multimeric NMDAR receptors composed of GluN1 and GluN2B subunits, the latter containing phosphorylation sites critical for NDMAR signaling14–20 in response to glutamate that is transduced via the cytoplasmic adaptor protein GKAP to evoke an invasive growth program characterized by broad changes in cellular regulatory pathways12.
Implicating NMDAR in breast cancer metastasis
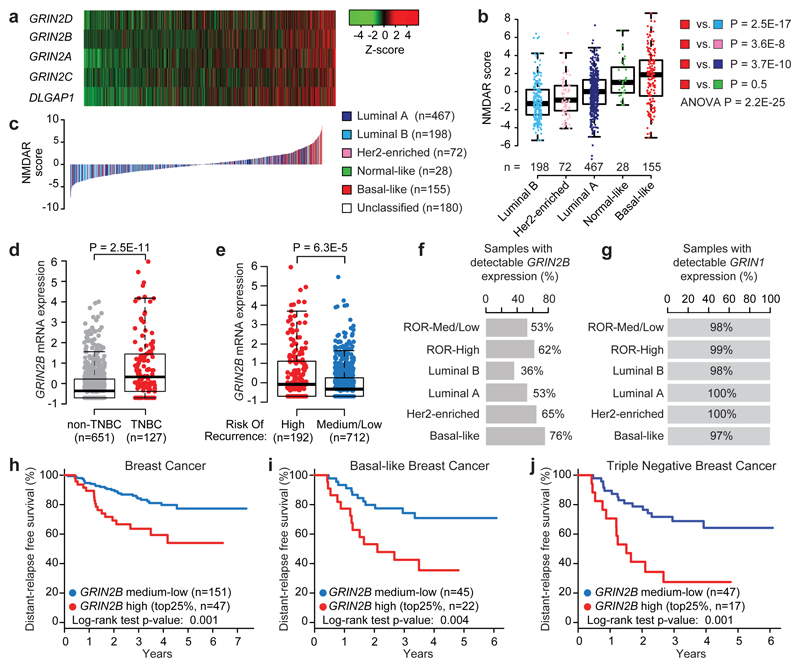
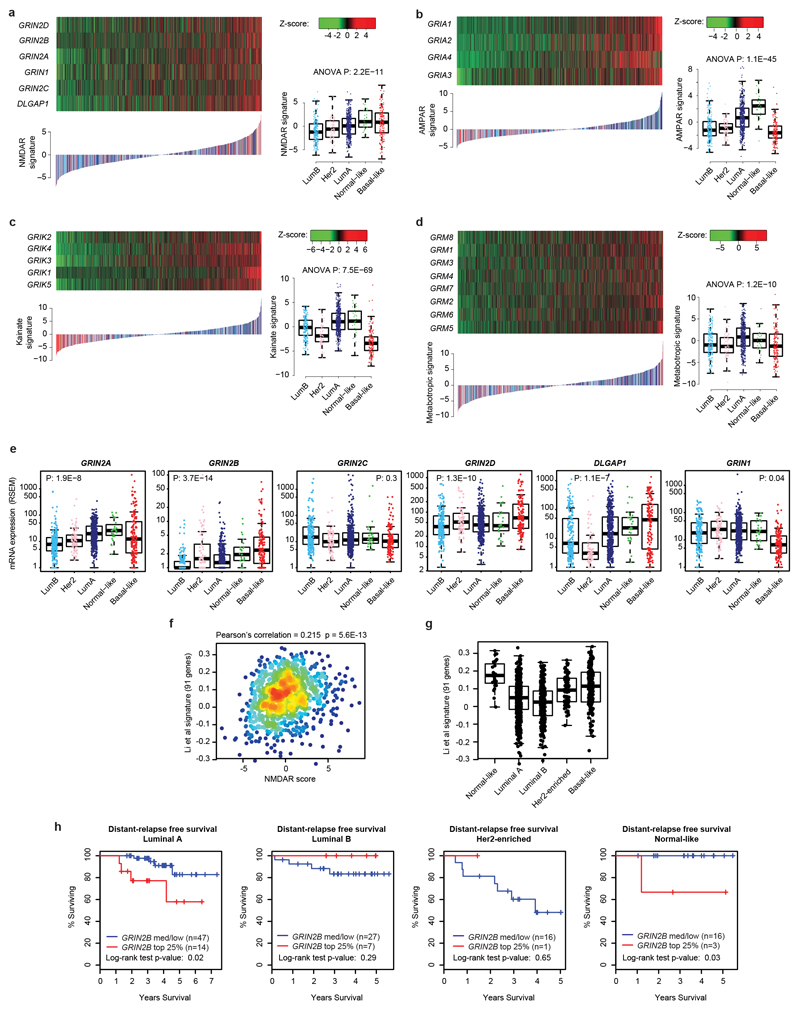
Seeking to more broadly assess glutamate-mediated signaling in human cancer, we evaluated expression of a core set of NMDAR and other glutamate receptor component genes across multiple human cancer types, which led us to focus on breast cancer, encourged by histological clues from our initial report11. From the analysis of 1100 primary breast cancers profiled by The Cancer Genome Atlas (TCGA)21, we derived transcriptional signatures and patient-specific signature scores for each of the four major glutamate receptors (the NMDA, AMPA, Kainate, and Metabotropic Receptors), which revealed distinct glutamate receptor-associated scores and expression in different subtypes (Extended Data Fig. 1a-d). In particular, basal-like tumors exhibited higher NMDAR scores, but lower AMPA and Kainate receptor scores, than the other subtypes (Extended Data Fig. 1a-c). This association was driven by expression of GluN2 components (especially GluN2B; encoded by GRIN2B) and GKAP (encoded by DLGAP1) (Extended Data Fig. 1e). An NMDAR signature based on the four GluN2 genes and GKAP confirmed a strong association with basal-like breast cancer (Fig. 1a-c), which was validated using a recently described 148-gene signature diagnostic of NMDAR pathway activity12 (Extended Data Fig. 1f, g). Basal-like breast cancer is characterized by unfavorable prognosis, lack of expression of hormone receptors (ER and PR) and of the growth factor receptor Her2 (triple negative breast cancer or TNBC), and by a high risk of recurrence (RoR). We found that elevated expression of GRIN2B was in particular significantly associated with TNBC status (Fig. 1d) and with a high RoR across all breast cancers (Fig. 1e). Elevated GRIN2B expression could be detected at >40% frequency in all breast cancers, whether segregated by subtype or RoR status, but especially in RoR-high and basal-like cases (Fig. 1f). By contrast, the obligatory GluN1 subunit of NMDAR (encoded by GRIN1) was uniformly expressed in a vast majority (>90%) of all breast cancer subtypes (Fig. 1g).
Fig. 1. Expression of GluN2B-NMDAR signaling components is associated with poor prognosis across all human breast cancer types.
a, mRNA expression of 5 NMDAR-associated genes (GRIN2A, GRIN2B, GRIN2C, GRIN2D, and DLGAP1) in 1,100 breast cancer (BC) patients from The Cancer Genome Atlas. Samples were sorted by NMDAR score (b), which combines, for each sample, Z-scores of normalized expression values of all 5 genes.
b, Boxplot comparison of NMDAR scores among PAM50 BC subtypes, ranked by median score within each subtype. NMDAR scores in Basal-like BC were tested against scores obtained for all other subtypes. Wilcoxon two tail test.
c, NMDAR mRNA expression score for the TCGA BC cohort (n = 1,100). Scores for all BC samples are ranked in increasing order and color-coded based on the PAM50 subtype.
d, Boxplot comparison of GRIN2B mRNA expression (z-scores of log2-normalized RNA-seq RSEM-normalized values) between samples classified as triple negative breast cancer (TNBC; red dots) vs. remaining samples (gray dots). Wilcoxon two-tail test.
e, Boxplot comparison of GRIN2B mRNA expression (z-scores of log2-normalized RNA-seq RSEM-normalized values) between samples with high risk of recurrence (RoR; red dots) vs. medium/low RoR (blue dots). Wilcoxon two-tail test.
f,g Percentage of tumors with detectable GRIN2B (f) and GRIN1 (g) mRNA (RSEM-normalized counts > 0) classified by high RoR, medium/low RoR, and the most frequent PAM50 subtypes.
h, Distant relapse-free survival (DRFS) analysis of an independent cohort of BC patients (GSE25065) with over-expressed GRIN2B (top 25% - red line) vs. remaining patients (blue line). Two-sided log-rank test.
i,j, DRFS analysis of basal-like (i) or TNBC (j) patients (GSE25065) with over-expressed GRIN2B (top 25% - red line) vs. remaining patients (blue line). Two-sided log-rank test.
The thick central line of each box plot represents the median number of significant motifs, the bounding box corresponds to the 25th–75th percentiles, and the whiskers extend up to 1.5 times the interquartile range.
Notably, in an independent clinical cohort of breast cancers, expression of GRIN2B was associated with poor “distant relapse-free survival” (DRFS), reflecting metastasis (Fig. 1h). The association with metastasis was highly significant within the subset of basal-like and TNBC tumours (Fig. 1i, j), along with a moderate association with worse prognosis (metastasis) for Luminal A tumours and no association for the other breast cancer subtypes (Extended Data Fig. 1h).
Motivated by these results, we sought to explore the possibility that GluN2B-containing NMDAR is functionaly involved in brain metastasis of breast cancer cells.
NMDAR activation in breast-to-brain metastases
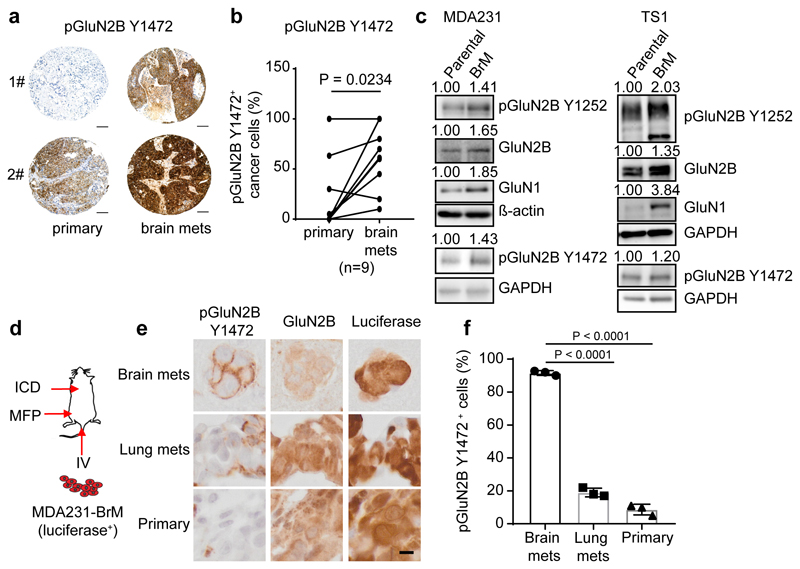
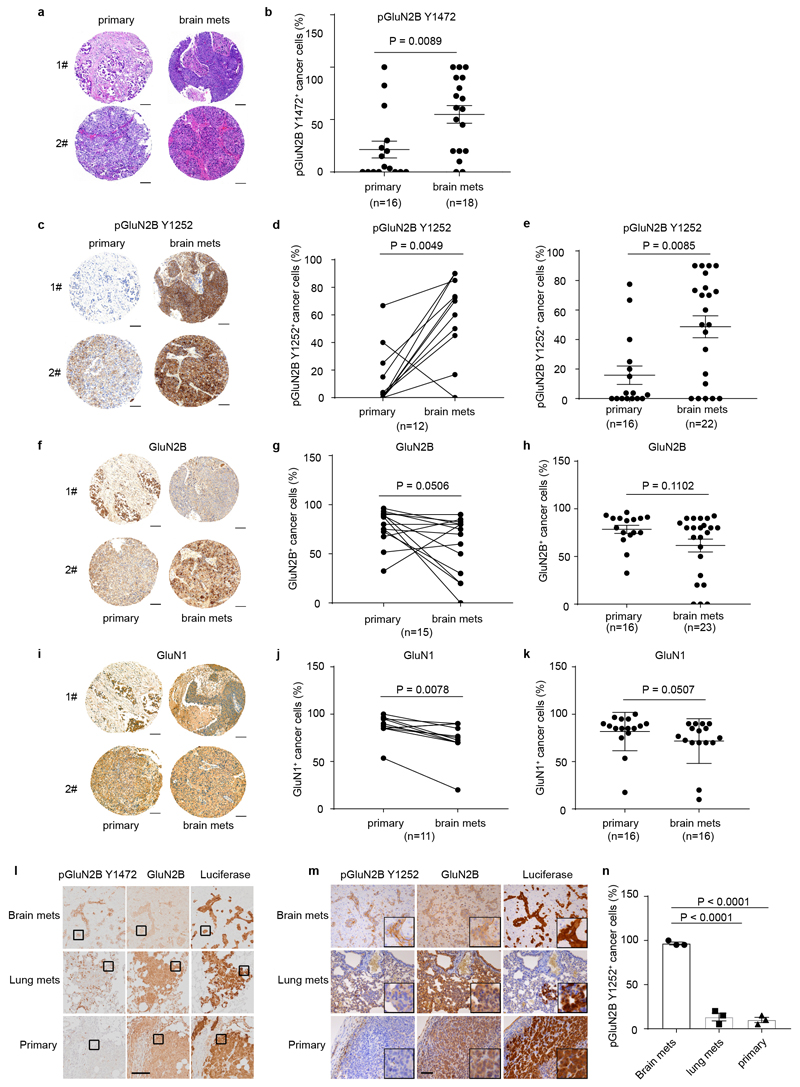
To begin, we immuno-stained paired primary human breast cancers and brain metastases in a tissue microarray for phospho-GluN2B as well as total GluN2B protein. GluN2B phosphorylations at Tyrosine 1472 and Tyrosine 1252 (pGluN2B Y1472 and Y1252) are instrumental for and diagnostic of cell-surface localization of NMDAR and induction of downstream signaling in response to glutamate14–20. GluN2B-mediated NMDAR signaling (revealed by the percentage of pGluN2B Y1472 and Y1252 positive cancer cells) was high in 7/9 and 10/12 of brain metastases, respectively, and frequently increased compared to matched primary breast tumours (Fig. 2a, b, and Extended Data Fig. 2a-e, Supplementary Table 1). Notably, total GluN2B, as well as GluN1 were similarly expressed in primary and brain metastases (Extended Data Fig. 2f-h and 2i-k).
Fig. 2. GluN2B-NMDAR signaling is highly activated in human brain metastasis.
a-b, Representative images (a) and quantification (b) of IHC staining of pGluN2B Y1472 in paired human primary BC (primary) and brain metastases (brain mets). Mean ± s.e.m. Two sided Wilcoxon two-tail test. Scale bar, 100 μm. BC subtype: 3 Her2+, 1 luminal and 5 unknown.
c, Western blotting of pGluN2B Y1252, pGluN2B Y1472, GluN2B, and GluN1 in pairs of human (left column, MDA231) and mouse (right column, TS1) parental BC cell lines and their corresponding B2BM derivatives. Three independent experiments. Protein levels in B2BM cells were quantified relative to cognate parental cells, after normalization to ß-actin or GAPDH controls, for which blotted membranes were cut into two parts, of <50 K for beta-actin or GAPDH staining, and 50-250 Kd for pGluN2B Y1252/Y1472 staining. Additional, equally loaded gels were blotted and stained for GluN2B or GluN1, using the loading control from the pGluN2B Y1252 gel.
d, Schematic of assays performed with luciferase-expressing B2BM cells either inoculated orthotopically into the mammary fat pad (MFP) to develop primary tumours, or intracardiac (ICD) to seed brain mets, or intravenous (IV) into the tail vein to seed lung mets.
e,f, IHC staining of pGluN2B Y1472, total GluN2B, and luciferase (e) and quantification of pGluN2B Y1472 staining (f) in primary tumours, brain mets, and lung mets formed by MDA231-B2BM cells (day 28~35 after injection). Scale bar, 10 μm. These images correspond to the inserts shown in Extended Data Figure 2l. Two-tailed Student t-test, n = 3 mice per group, mean ± s.e.m.
Next, we assessed levels of GluN2B, pGluN2B Y1252/Y1472, and GluN1 in breast cancer cells that had been selected for enhanced brain-metastatic proficiency into mice of parental human MDA2314 or mouse TS15 cells. We found that both subunits (GluN2B and GluN1) as well as pGluN2B were significantly upregulated in each ‘B2BM’ cell line (MDA231-BrM and TS1-BrM) in comparison to the poorly brain-metastatic parental MDA231 and TS1 cells (Fig. 2c, Supplementary Figure 1), consistent with the possibility that upregulated NMDAR was playing a role in the acquired brain-metastatic proficiency of the B2BM cells. To assess potential activation of GluN2B-mediated NMDAR signaling in the primary and metastatic sites, we inoculated mice with MDA231-BrM cells, either into the mammary fat pad (MFP) to form orthotopic primary breast cancers, or into the left cardiac ventricle (ICD) to elicit brain metastasis, or into the lateral tail vein (IV) to induce lung metastasis (Fig. 2d). Essentially 100% of brain metastases had clear membrane staining for pGluN2B Y1252 and Y1472, in contrast to much less frequent positivity in the orthotopic breast tumours and lung metastases (Fig. 2e, f and Extended Data Fig. 2l, m, n).
Paracrine sourcing of glutamate to B2BM cells
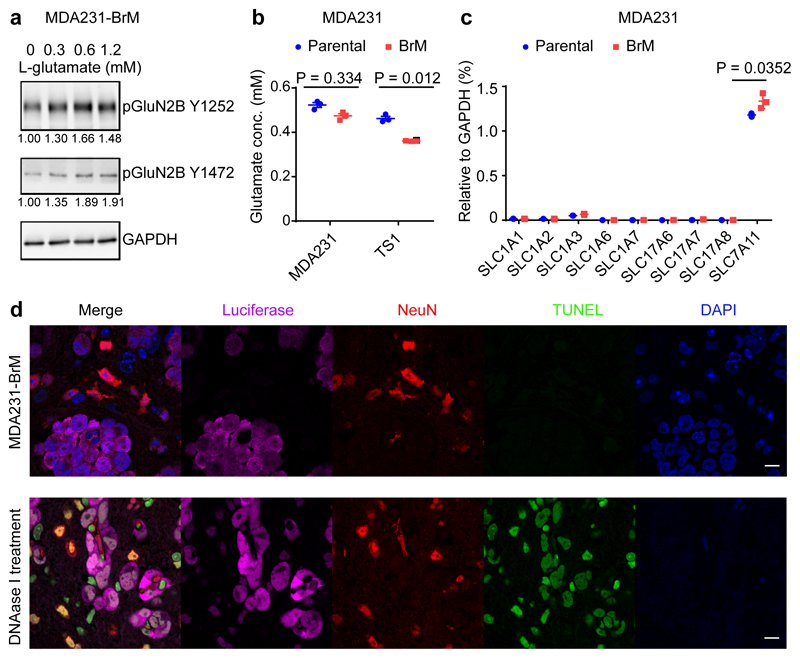
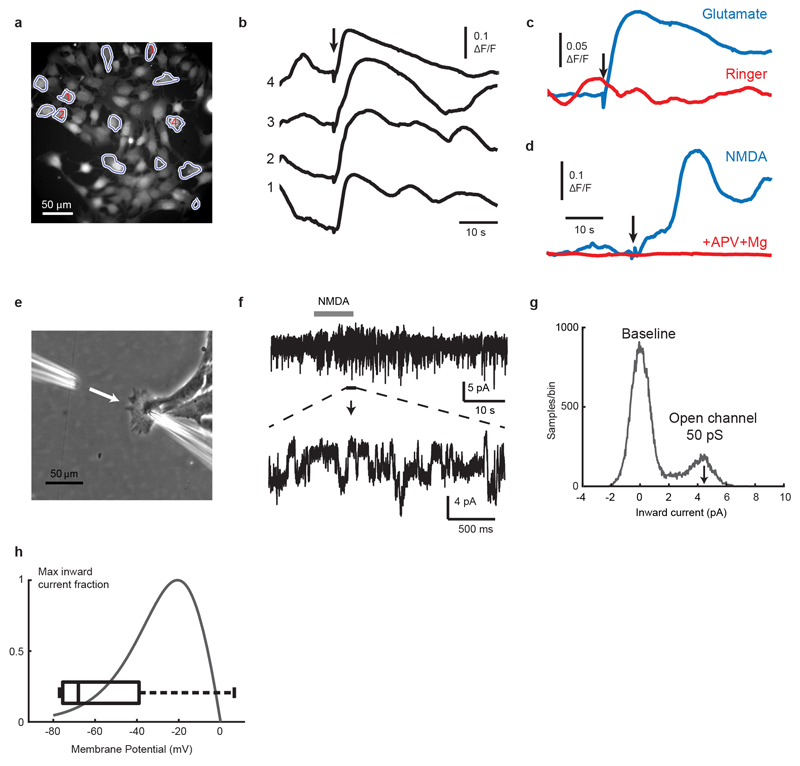
To explore why activation of GluN2B-NMDAR signaling was preferentially occurring in brain metastases, we first established that L-glutamate, the major agonist for NMDAR22, was capable of enhancing GluN2B-mediated NMDAR signaling (as revealed by pGluN2B Y1472 and Y1252 expression) when supplied in a dose-dependent manner to MDA231-BrM cells in culture (Fig. 3a, Supplementary Figure 1). Furthermore, using fluorescence imaging and patch-clamp recordings in 2D cultures of TS1-BrM cells, we verified that exogenously-applied NMDA or glutamate both activate single-channel currents and elevate intracellular calcium, indicating that NMDAR-mediated signalling is functional in B2BM cells (Extended Data Fig. 3).
Fig. 3. Autocrine secretion of L-glutamate is not sufficient to explain the brain metastasis-specific induction of GluN2B-NMDAR signaling.
a, Western blotting of pGluN2B Y1252 and Y1472 in MDA231-BrM cells treated with increasing concentrations of L-glutamate and 10 μM glycine for 1 hr in artificial cerebrospinal fluid. The numbers below indicate levels of pGluN2B Y1252, with Y1472 expression normalized to GAPDH. Three independent experiments. GAPDH control was run in the same gel as pGluN2B Y1252, and on separate gels from pGluN2B Y1472.
b, Secreted L-glutamate concentrations in conditioned medium from MDA231 and TS1 parental and derivative B2BM cells after 48 hrs of culture. Two-tailed Student t-test, n = 3 independent experiments.
c, Real-time RT-PCR analysis of glutamate transporter gene expression in MDA231 parental and B2BM cells. Two-tailed Student t-test, mean ± s.e.m., n = 3 independent experiments.
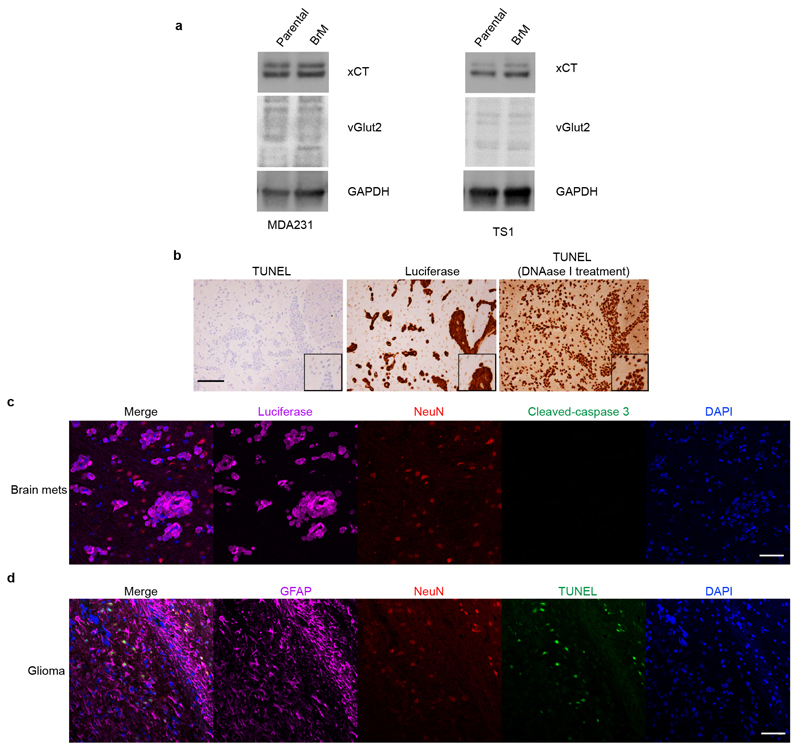
d Immunofluorescence staining to detect apoptotic cells (TUNEL; green) in mouse brains with metastases formed by MDA231-BrM cells (day 28~35 after injection). Luciferase (magenta) reveals the cancer cells, and NeuN (red) reveals neurons; Bottom row: DNAase I treatment on brain tissue sections was used as a TUNEL-positive control. Images shown are representative of an analysis of >20 brain mets from 4 mouse brains, 2 sections/mouse brain. Scale bar, 10 μm. Three independent experiments.
An ancillary question was where the NMDAR-activating L-glutamate ligand might come from in vivo? One possibility was autocrine supply, based on several considerations: First, glutamate is secreted by TNBC cells in culture23, and is detectable in cultured parental and B2BM cells (Fig. 3b). Additionally, human glioma cells secrete extracellular glutamate that triggers neuronal death and facilitates tumour expansion24,25. Furthermore, pancreatic cancer cells elevate expression of glutamate transporters and secretion of glutamate so as to activate NMDAR-dependent invasiveness11,13. Therefore, we asked whether secretion of glutamate by B2BM cells was activating autocrine/juxtracrine GluN2B-NMDAR signaling. If so, we expected to see higher secretion of glutamate in B2BM cells compared with their parental breast cancer cells, given the observed differences in NMDAR signaling in primary tumours vs metastasis (Fig. 2e, f). However, analysis of glutamate concentrations in conditioned medium revealed no increased secretion of glutamate in B2BM cells compared with their parental cells (Fig. 3b). Using qRT-PCR we audited levels of expression of the nine glutamate transporter genes, comparing parental and B2BM cells, and did not detect major differences (Fig. 3c). WB analysis revealed that xCT23 (encoded by SLC7A11), a transporter that can export glutamate, is similarly expressed in parental and B2BM cells, whereas vGlut2, a key vesicular protein for glutamate loading into synaptic vesicles, is insignificantly detected (Extended Data Fig. 4a, Supplementary Figure 1).
Given the reports that autocrine secretion of glutamate by glioma cancer cells elicited neuronal cell death24,25, we immuno-stained mouse brain tissue sections bearing B2B metastases for apoptotic neurons (revealed as TUNEL+/NeuN+ or cleaved-caspase3+/NeuN+), and found that apoptotic neurons were infrequent (Fig. 3d and Extended Data Fig. 4b, c); in contrast, apoptotic neurons were frequent at the margins of glioma brain tumours (Extended Data Fig. 4d). These results indicate that the concentration of extracellular glutamate in the B2B metastatic microenvironment was relatively low. Collectively, these results suggest that autocrine secretion of glutamate is not sufficient to explain the brain metastasis-specific induction of GluN2B-NMDAR signaling.
Pseudo-tripartite synapses supply glutamate
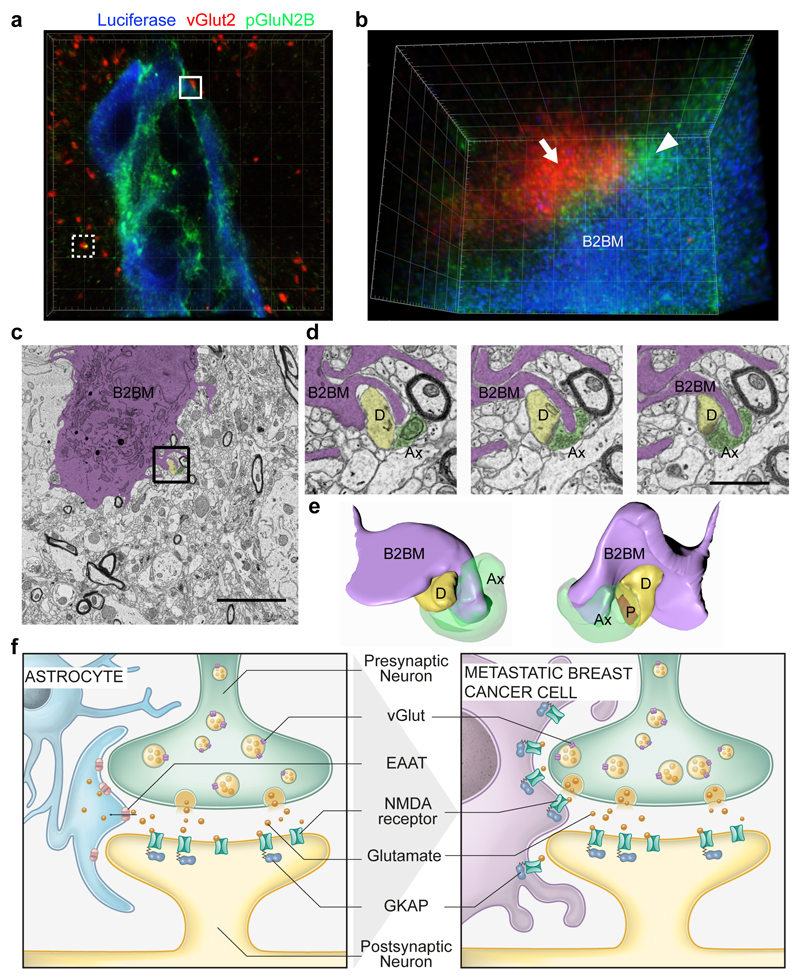
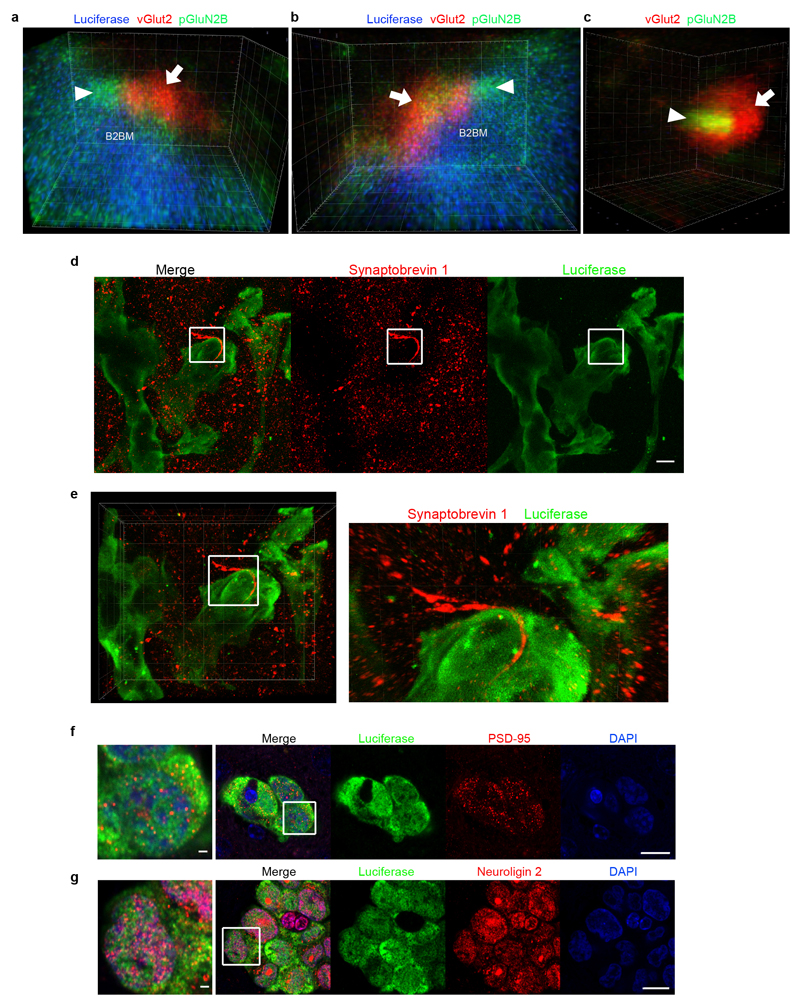
We were led therefore to explore the possibility that a paracrine supply of glutamate from the brain microenvironment was activating NMDAR signaling in metastatic lesions. High levels of glutamate are released locally as neurotransmitters from excitatory glutamatergic presynaptic neurons. The secreted glutamate is then rapidly absorbed by NMDAR-expressing post-synaptic neurons as well as by astrocytes surrounding the synaptic cleft, the latter serving to ensure the fidelity of neurotransmission and to avoid high extracellular glutamate-induced neurotoxicity26. To explore whether B2BM cells could be obtaining glutamate from glutamatergic synapses, we immunostained tissue sections of metastatic lesions and adjacent normal brain for B2BM cells (revealed by luciferase), for presynaptic neurons (revealed by vGlut2) and for an indicator of NMDAR signaling (pGluN2B Y1252)14–20, and then performed STED super-resolution microscopy. Strikingly, the data reveal vGlut2+ puncta intimately associated both with pGluN2B+ puncta in B2BM cells and with presumptive neuronal processes in close proximity to the B2BM cells, as well as with well-separated normal synapses (Fig. 4a, b, Extended Data Fig. 5a-c, Supplementary Video 1, 2). We also immunostained for another presynaptic vesicle marker synaptobrevin 1, analyzed also by STED microscopy, which revealed discrete synaptobrevin 1-positive bouton chains closely associated with luciferase+ B2BM cells (Extended Data Fig. 5d, e). Consistent with active NMDAR signaling, B2BM cells populating brain metastases express the key post-synaptic signal-transducing protein PSD-95 (Extended Data Fig. 5f). Provocatively, these cells also express Neuroligin 2 (Extended Data Fig. 5g), one of a family of four transmembrane cell adhesion proteins that has been shown to enable non-neuronal cells to form pseudo-synapses with axons27,28, and whose expression in astrocytes normally contributes to astrocytic morphogenesis and synaptogenesis29.
Fig. 4. B2BM cancer cells form pseudo-tripartite synapses with neurons.
a,b, Immunofluorescence staining of luciferase (B2BM; blue), pGluN2B Y1252 (green) and vGlut2 (red) in a mouse brain metastasis formed by MDA231-BrM cells (day 25 after injection), imaged by STED super-resolution microscopy. (a) Image with 3D volume. The white dotted border box indicates a normal synapse shown in Extended Data Fig. 5c. (b) Tilted 3D image of the area circumscribed by the white solid border box in (a) shows a pseudo-tripartite synapse between B2BM cell(s) and neurons, revealed by vGlut2+ neuronal puncta (arrow) and pGluN2B+ puncta in B2BM cells and presumptive neuronal processes in close proximity (arrowhead). Images are representative of 9 brain mets from 3 mice, 2 sections/mouse brain. Side length for each square in 3D view = 5 μm (a) and 400 nm (b). (Two Supplemental videos further describe the boxed images.)
c, Electron micrograph of a brain metastasis formed by MDA231-BrM cells in the cerebral cortex. The cancer cell is purple-shaded. Scale bar, 5 μm. Two independent experiments.
d, Three serial EM images from the region indicated by the black box in (c) showing protrusions from a B2BM cell in close apposition to an excitatory synapse.(Representative of 6 regions within 2 ultrathin sections from one mouse brain.) B2BM cells, purple-shaded; D = dendrite, yellow-shaded; Ax = axon, green-shaded; P = postsynaptic density. Scale bar, 1 μm.
e, 3D reconstruction of the region in (d) illustrating a metastatic cell’s protrusion proximal to pre- and postsynaptic elements and the synaptic density (shown in red).
f, Brain-metastatic cancer cells supplant astrocytes at neuronal synapses to enable NMDAR-dependent colonization. The tripartite synapse composed of pre- and post-synaptic neurons and astrocytes (left) is subverted by metastasizing breast cancer cells, which mimic astrocytes to form pseudo-tripartite synapses (right) that provide a source of glutamate ligand, activating NMDAR signaling to stimulate tumor growth in the brain.
We next used transmission electron microscopy as well as block face scanning electron microscopy to image the brain metastases. This analysis revealed finger-like processes, emanating from the B2BM cells, which were often in close association with excitatory synapses (Fig. 4c-e) identified according to their morphological characteristics of round, clear vesicles (~35 nm diameter) in pre-synaptic axons, and prominently stained post-synaptic membranes in dendrites that gave them an asymmetric appearance30 (Fig. 4d). Notably, the B2BM cells were not disrupting the pre/post neuronal synapse, but rather appeared to adopt a position that would normally be occupied by astrocytic processes. This morphological arrangement is seemingly analogous to the tripartite synapse, with the B2BM cells taking the place of astrocytes. Collectively, the STED super-resolution microscopy and the 3D EM suggest that B2BM cells are establishing pseudo-tripartite synapses, so as to obtain access to glutamate secreted by pre-synaptic neurons, as illustrated in Figure 4f.
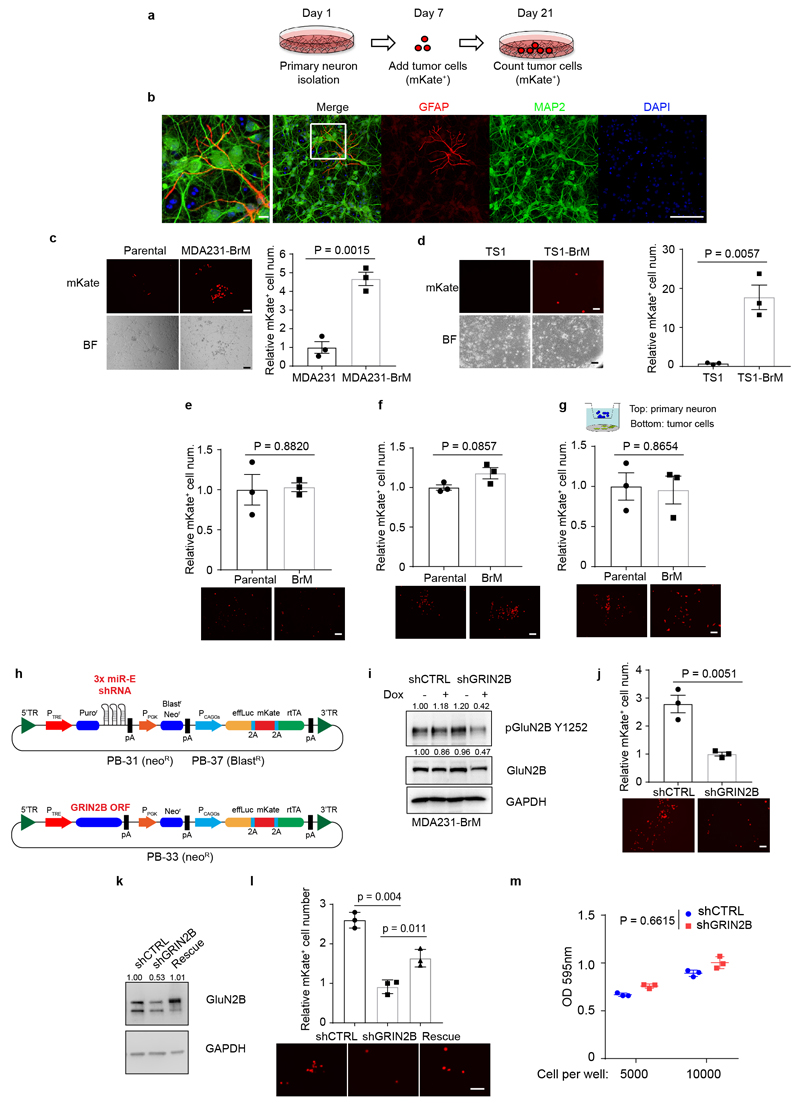
To assess the hypothesis that B2BM cells were being stimulated by glutamate released in the context of these pseudo-tripartite synapses, we established a co-culture system involving B2BM cells and primary cortical neurons31 (Extended Data Fig. 6a, b). Significantly enhanced proliferation was observed for both MDA231 and TS1 B2BM cells compared to parental cells when co-cultured with primary neurons (Extended Data Fig. 6c, d). In contrast, there were no significant difference when cultured in neuron-optimized medium (Extended Data Fig. 6e), or in conditioned medium from primary neuronal cultures (Extended Data Fig. 6f), or in Boyden chambers (Extended Data Fig. 6g) where the cancer cells and neuronal cells were separated. To further assess the importance of NMDAR signaling for the stimulation of B2BM proliferation by co-cultured neurons, we engineered MDA231-BrM cells with doxycycline (DOX) inducible miR-E-based shRNA GRIN2B knock-down8,32 (Extended Data Fig. 6h, i, Supplementary Figure 1), which upon induction reduced B2BM cell proliferation in cancer cell-neuron co-cultures (Extended Data Fig. 6j). Re-expression of GluN2B in B2BM cells partially rescues cell proliferation in co-cultures (Extended Data Fig. 6k, l, Supplementary Figure 1). No significant differences were observed comparing shCTRL vs shGRIN2B MDA231-BrM cells in the cultures lacking neurons (Extended Data Fig. 6m). Collectively, the results are indicative of the necessity for direct interaction between B2BM cancer cells and neurons in promoting NMDAR-dependent cell proliferation.
NMDAR drives metastatic colonization
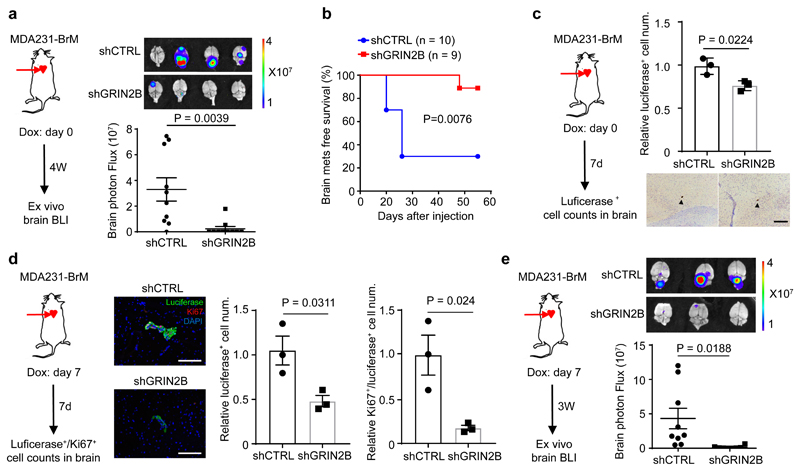
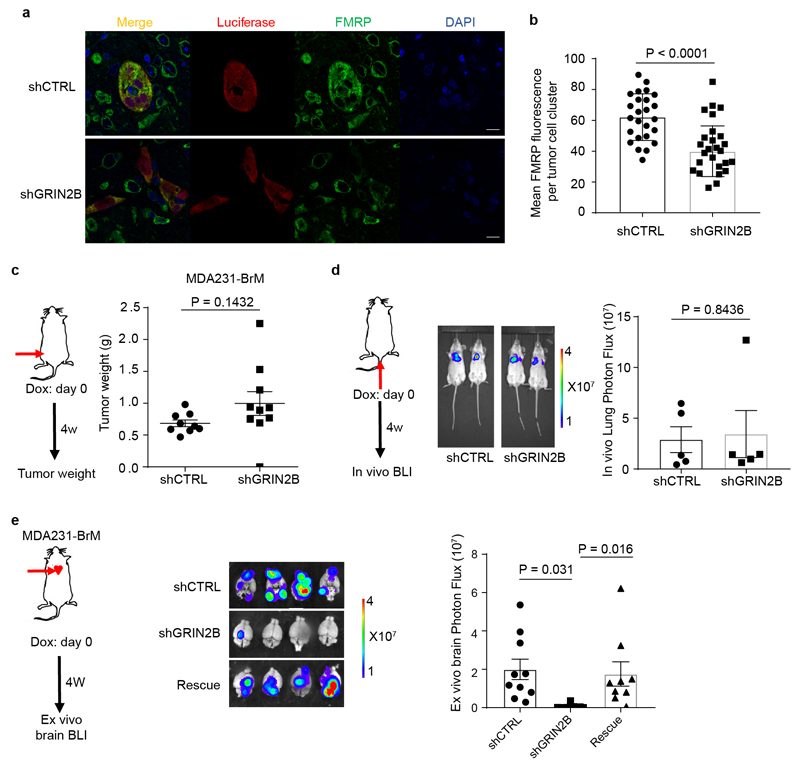
We next ascertained whether GluN2B-NMDAR signaling promotes brain metastasis. The conditional knock-down B2BM cells were inoculated into mice by intracardiac injection concomitant with induction of the shRNAs. The GluN2B-k/d B2BM cells produced lower brain tumour burden and significantly prolonged survival (Fig. 5a, b). Notably, FMRP, a candidate effector upregulated by NMDAR in pancreatic cancer cells12, was expressed in shCTRL and markedly reduced in GluN2B-k/d brain lesions (Extended Data Fig. 7a, b), consistent with ongoing NMDAR signaling in w.t. brain metastases. In contrast, the GluN2B-k/d did not affect orthotopic primary tumour growth in the mammary fat pad or i.v.-derived lung metastasis (Extended Data Fig. 7c, d). To exclude possible off-target effects of the shRNA, GluN2B was re-expressed in GluN2B-k/d MDA231-BrM cells, which rescued their brain metastatic capability (Extended Data Fig. 7e). Similar results were observed with mouse TS1-BrM cells carrying GluN2B knockdown (Extended Data Fig. 8, Supplementary Figure 1).
Fig. 5. NMDAR activity mediates colonization but not seeding of brain metastases.
a, Bio-luminescent imaging (BLI) and quantification of brain metastatic lesions formed by MDA231-BrM cells transfected with doxycycline (DOX) inducible shCTRL or shGluN2B. DOX food was supplied concomitantly with ICD injections and metastasis burden was assessed 4 weeks later by BLI. Two-tailed Student t-test, mean ± s.e.m., n = 10 mice per group, two independent experiments.
b, Brain metastasis-free survival of mice seeded by intracardiac inoculation with MDA231-BrM cells transfected with shCTRL or shGluN2B. DOX food was supplied concomitantly with ICD injection. Two-sided log-rank test.
c, Evaluation of brain seeding capability of luciferase+ shGluN2B vs. shCTRL MDA231-BrM. DOX food was supplied concomitantly with ICD injection; mice were sacrificed at day 7. Every 10th brain section was stained with luciferase antibody, and all luciferase+ cells were counted. Representative images show single luciferase+ B2BM cells (brown staining; black arrowhead). Two-tailed Student t-test, mean ± s.e.m., n = 3 mouse brains per group. Scale bar, 100 μm.
d, Evaluation of Luciferase+/Ki67+ shGluN2B vs. shCTRL MDA231-BrM cells after initial colonization of brain-metastatic lesions. DOX food was supplied 7 days after ICD injection; mice were sacrificed at day 14. Every 10th brain section was stained with luciferase and Ki67 antibody, and all luciferase+ and Ki67+ cells were counted. Representative images show luciferase (green) and Ki67 (red) staining. DAPI; nuclear staining. Two-tailed Student t-test, mean ± s.e.m., n = 3 mouse brains per group. Scale bar, 100 μm.
e, Bio-luminescent imaging (BLI) and quantification of brain metastatic growth by MDA231-BrM cells transfected with inducible shGluN2B or shCTRL. DOX food was supplied at day 7 after ICD injection, and continued for 3 weeks, until day 28. Two-tailed Student t-test, mean ± s.e.m., n = 9 mice for shCTRL, and 8 mice for shGluN2B.
To further define the stage at which GluN2B-NMDAR signaling contributes to brain metastasis, we performed a short-term metastasis assay with MDA231-BrM cells to assess initial seeding and survival. Circulating cancer cells complete their extravasation across the blood-brain-barrier (BBB) ~7 days after ICD injection in the B2BM mouse model6,33. GluN2B-k/d MDA231-BrM cells produced slightly decreased numbers of cancer cells in the brain parenchyma 7-days after inoculation (Fig. 5c), indicating that NMDAR was not essential for metastatic seeding. In contrast, when GluN2B was inducibly knocked down beginning 7 days after ICD inoculation and seeding, proliferation was significantly decreased when analyzed a week later, concomitant with a 4-fold decrease in the total number of Ki67+ B2BM cells in the brain (Fig. 5d). Furthermore, inducible knockdown of GluN2B in MDA231-BrM beginning at day 7 impaired brain-metastatic tumour growth and consequent tumour burden in a longer-term (4 week) metastasis assay (Fig. 5e), indicating that GluN2B-NMDAR signaling is promoting colonization and metastatic tumour growth in the brain.
Discussion
Taken together, these results have collectively revealed and substantiated a remarkable interaction between brain metastatic cells and neurons that serves to activate the glutamate-stimulated GluN2B-NMDAR signaling axis in cancer cells in the brain microenvironment. This realization builds upon a prior study documenting the capability of metastatic breast cancer cells to couple via gap junctions with astrocytes, reprogramming them to create a supportive tumour microenvironment7. Thus, breast cancer cells are functionally interacting both with neurons and astrocytes so as to orchestrate their metastatic growth. Moreover, the capability for brain metastasis evidently has other components, including alterations that facilitate extravasation across the blood-brain barrier and evasion of tissue barriers6–8. Given that subsets of all breast cancer subtypes show elevated NMDAR expression in association with comparatively poor distant relapse-free and/or overall survival, it is possible that breast tumours commonly spawn cancer cells whose growth can be promoted by NMDAR signaling. Since lethality is not exclusively governed by brain metastasis, these observations suggest that NMDAR signaling may contribute more broadly to breast tumor progression. To assess this possibility, one can envisage future studies probing large breast cancer biobanks via immunostaining of tissue microarrays with the phospho-specific antibodies that are diagnostic of active NMDAR signaling. Finally, it remains to be ascertained whether brain metastases from other primary tumour types similarly parasitize neuronal synapses to stimulate NMDAR-dependent colonization, and whether certain primary tumours and metastases to other sites characterized by ‘peri-neural invasion’34 might establish pseudo-tripartite synapses with peripheral nerves in order to activate and sustain NMDAR-dependent invasive growth.
The demonstrated dependency of brain metastatic cells on GluN2B-NMDAR signaling for successful colonization of metastatic lesions suggests in principle a therapeutic opportunity. In practice, however, recognizing the insidious interplay whereby brain metastatic cancer cells co-mingle with NMDAR-dependent neurons, it can be anticipated that directly inhibiting NMDAR signaling in brain-metastatic cancer cells will elicit concomitant CNS neurotoxicity 35. We envisage future studies may uncover downstream effectors of GluN2B-NMDAR signaling specific to and responsible for brain metastatic cell growth, representing potential vulnerabilities that could be amenable to therapeutic targeting whilst sparing neurons. In conclusion, this investigation has revealed a provocative mechanism whereby GluN2B-mediated NMDAR signaling is activated in brain-metastatic cancer cells via the formation of pseudo-tripartite synapses to achieve paracrine supply of the glutamate ligand, a sobering manifestation of the “seed and soil” theory of organ-selective metastasis.
Methods
Glutamate receptor expression analysis in human breast cancer patient cohorts
To examine transcriptional levels of glutamate receptors, we defined a gene signature for each receptor as composed by its core components. Glutamate receptor signatures used in this study were defined as follows:
NMDAR: GRIN1, GRIN2A, GRIN2B, GRIN2C, GRIN2D, DLGAP1.
AMPAR: GRIA1, GRIA2, GRIA3, GRIA4
Kainate: GRIK1, GRIK2, GRIK3, GRIK4, GRIK5
Metabotropic: GRM1, GRM2, GRM3, GRM4, GRM5, GRM6, GRM7, GRM8.
Next, for each gene signature, we derived patient-specific gene expression signature scores. To this purpose, RSEM gene normalized RNA-seq data from the TCGA breast cancer cohort was collected from the FireBrowse data portal and RSEM counts were log2-transformed [log2(RSEM+1)] and normalized as Z-scores. For each patient, we took the sum of the Z-scores obtained for the genes within each signature as the ‘signature score’ corresponding to that patient. As a control, we performed the same analysis by applying a rank-based transformation to the RSEM-normalized counts (qq-transformation) instead of the log2. The obtained scores were highly correlated (Pearson’s coefficient = 0.96). In the manuscript, we decided to use the score obtained from the log2 transformed data as it better reflects the magnitude of mRNA expression differences among the analyzed genes, including the cases where mRNA expression of a given gene was not detectable (RSEM = 0). Given the association between NMDAR and basal-like breast cancer was primarily driven by GluN2 components, a second NMDAR signature was defined by excluding GRIN1 from the initial signature (see Fig. 1a-c).
Recently, a 148-gene expression signature was associated with NDMAR-activity in mouse tumors11,12. To compare our NMDAR score with this previously derived 148-genes expression signature, we first separated genes that were up-regulated in NMDAR active tumors (100 genes) from genes that were down-regulated (48 genes). Next, we mapped up- and down-regulated genes to the corresponding orthologs in human using the biomaRt R package. Upon mapping, we found that the lists of up- and down-regulated human genes had non-empty intersections, hence we removed genes present in both lists. Finally, we computed an expression signature score for each TCGA breast cancer patient applying the GSVA method36 (GSVA R package) to the list of unique up-regulated genes (91 genes). Pearson’s correlation between signature scores and NMDAR scores was computed and tested for statistical significance using the R function cor. test (Extended Data Fig. 1a).
Within the TCGA breast cancer cohort, NMDAR scores have been compared among patients attributed to distinct PAM50 breast cancer subtypes (Luminal A, Luminal B, Her2-enriched, Basal-like, and Normal-like) by the Wilcoxon two-tail test. GRIN2B (encoding GluN2B) mRNA expression had been compared between patients with high or medium/low Risk of Recurrence (ROR) by Wilcoxon two-tail test. PAM50 subtypes and ROR had been previously determined for these samples21.
For distant-relapse free survival analysis, we analyzed an independent dataset of 198 breast cancer patients37 (GSE25065). Patients have been stratified based on GRIN2B (a.k.a. GluN2B) mRNA expression into a “high” group corresponding to the top 25% of samples with highest expression of GRIN2B, and a “medium/low” group including all the remaining cases. Kaplan-Meier survival analyses have been performed using the R Version 3.3.2 “survival” package.
Patient Tissue Microarray
The TMA was constructed from 25 cases of diagnosed primary breast cancer and corresponding brain metastases at the Institute of Pathology, University of Bern. Patient samples were collected in accordance to the Swiss Federal Human Research Act (HFG 2014). All tissues were retrieved from the archives of the Institute of Pathology, University of Bern, Switzerland. Tissue blocks were used collected for construction of the tissue microarrays. Permission to use the patient material and accompanying patient-related data for this study were approved by the Ethics committee of the Canton of Bern and were collected in accordance with the 2014 Human Research Act/Law (KEK#200/2014). Samples were coded after they were retrieved from the archives of the Institute of Pathology, University of Bern and matched to the corresponding data. Sample data was coded by giving each patient a “study ID” and each sample a further number. Only the Research Data Support Team of the University of Bern’s Translational Research Unit (dedicated team) have access to the key leading back to the patients and their uncoded data. Subtype categorization for those twenty-five patients are: 4 TNBC, 6 Her2+, 2 luminal and 13 unknown.
TMA immunohistochemical staining of human samples
IHC staining of human samples was carried out in the automated system BOND RX® (Leica Biosystems, Newcastle, UK). All sections were deparaffinized and rehydrated using Dewax solution (Leica Biosystems) at 72°C for 30 seconds. Endogenous peroxidase activity was blocked with 3% H2O2 solution (Leica Biosystems) for 5 minutes. Samples were incubated with the following primary antibodies at RT for 30 minutes: anti-NMDA Receptor Type 1 (GluN1) rabbit polyclonal antibody (ThermoFisher Scientific, IL, USA, PA3-102) at 1:200 dilution, anti-GluN2B mouse monoclonal antibody, (ThermoFisher Scientific, IL, USA, PA3-105) at 1:100 dilution and anti-pGluN2B Y1252 or anti-pGluN2B Y1472 rabbit polyclonal antibody (ThermoFisher Scientific, IL, USA, 485200 or 387000) at 1:200 dilution. Antigen retrieval was performed using Tris-EDTA buffer (pH 9) at 95°C for 30 minutes.
The slides were incubated with the secondary antibody using the Bond Polymer Refine Kit (Leica Biosystems) for 15 minutes. Subsequently, samples were incubated with the chromogen DAB (3-3’-Diaminobenzidine) for 10 minutes, counterstained with hematoxylin for 5 minutes and finally mounted with Aquatex® (Merck Millipore). The stainings were scored semi-quantitatively as 0-100 percentage of positive cells.
Cell culture
Human MDA231 parental and derivative BrM cells were cultured in DMEM (Gibco) with 10% FBS (Gibco) and 2 mM L-glutamine (Gibco). TS1 parental and derivative BrM cells were cultured in DMEM with 10% FBS. Mouse primary cortical neurons were cultured in neuron basal medium with 5% B27 (Gibco) and 0.5 mM L-glutamine. All cells tested negative for mycoplasma. For the L-glutamate treatment experiment38, 3x10⁵ MDA231-BrM cells were seeded in one well of a 6-well plate. 48 hrs later, cells were washed with 1X artificial cerebrospinal fluid (aCSF, 120 mM NaCl, 26 mM NaHCO3, 3 mM KCl, 1.25 mM NaH2PO4, 1.3 mM MgCl2, 2 mM CaCl2, and 10 mM glucose) and equilibrated in aCSF for 1 hr. Cells were then stimulated with different concentrations of L-glutamate (0, 0.3, 0.6, 1.2 mM) and 10 μM glycine for 1 hr, and harvested for western blotting analysis.
Animal studies
All experiments using animals were performed in accordance with protocols approved by the local animal experimentation committee of the Canton de Vaud (license number 3070 and 3214). No mice in the experiments exceeded the maximal tumour/metastasis burden. Female SCID/beige mice were used at 6-8 weeks of age and were randomly allocated to each group. Sample size for in vivo experiments was based on previous publications using the same cell lines and mouse experimental procedures7. No statistical methods were used to predetermine sample sizes. Blinding was not performed during experiments to facilitate veterinary and staff monitoring.
For the brain metastasis assay, 1x10⁵ MDA231-BrM or TS1-BrM cells suspended in 100 μl PBS were injected into the left cardiac ventricle of the mice. Any mice with abnormal neurogical signs and locomotion behavior (ticked as score 3-4 according to the score sheet of license 3070) were euthanized.
For the lung metastasis assay, 2x10⁵ MDA231-BrM cells suspended in 200 μl PBS were injected into the lateral tail vein of the mice. Any mice with abnormal respiratory signs and locomotion behavior (ticked as score 3-4 according to the score sheet of license 3214) were euthanized.
To monitor the growth of brain or lung metastases, mice were intraperitoneally injected with D-luciferin (150 mg/kg), and then imaged and analyzed using the IVIS Spectrum imaging system (Caliper Life Sciences) weekly after the injection.
For the primary tumor growth assay, 5x10⁵ MDA231-BrM or TS1-BrM cells suspended in 100 μl PBS were injected into the fourth right mammary fat pad of female mice. Mice with tumor dimeter more than 1 cm were euthanized.
For the short-term brain metastasis assay, 5x10⁵ MDA231-BrM cells suspended in 100 μl PBS were injected into the left cardiac ventricle of the mice. For inducible knockdown experiments, mice were given doxycycline hyclate (325 mg/kg) in the diet at various time points as indicated in the relevant Figures.
Isolation of primary cortical neuron cells and co-culture with cancer cells
The isolation of primary cortical neurons was performed as described previously31. In brief, the brains of E17 embryos of FVB/N mice (Charles River) were dissected out in Hibernate E medium (Thermo Fisher Scientific). Cerebral cortices were collected under a dissecting microscope, and then digested by TrypLE Express (Gibco) in 37°C for 10 min. The obtained primary cortical neurons were counted and suspended in neuron basal medium with 5% B27 and 0.5 mM L-glutamine. 4x10⁵ primary neurons were seeded in 35 mm glass bottom culture dishes (MatTek) or one well of 6-well plates pre-coated with poly-D-Lysine (Sigma, P6407). When primary cortical neurons reached ~95% confluence (~7 days after the isolation), 2500 cancer cells (mKate+) in 1 ml complete neuron basal medium were added to the primary neuron culture. After maintaining the co-cultures for 14 days, mKate+ positive cells were detected by taking 5 random pictures (10X objective lens, both bright and fluorescent fields) in each plate using a Fluorescence microscope (Leica DMI4000B). The quantification of mKate+ tumor cells was performed using ImageJ-64bit.
TUNEL staining
Mouse brains with metastatic lesions formed by MDA231-BrM cells (28~35 days after the ICD injection) were used for TUNEL staining. In brief, sections were de-paraffinized, treated with 1% proteinase K for 8 min at room temperature, and then incubated with equilibration buffer for 10 min, followed by TdT buffer in 37°C for 30 min. Sections were then incubated with anti-digoxigenin antibody conjugated with POD (for DAB staining) or fluorescein (for IF staining) in 37°C for 30 min. For TUNEL positive control, DNAase I (3000 U/ml, RT, 10 min) treatment of adjacent brain tissue sections was performed. For TUNEL negative controls, TdT enzyme was not included in the incubation buffer. For IF staining, sections were further co-stained for the nuclear marker NeuN (neurons) and luciferase (BrM cells), allowing for the accurate observation of dead or dying neurons in proximity to the metastatic lesions.
Electrophysiology
Cells were bathed in a magnesium-free Ringer solution, containing (mM): 140 NaCl, 2.5 KCl, 2 CaCl2, 10 glucose, 0.01 glycine, 10 HEPES/Na, pH adjusted to 7.4 with NaOH. Patch pipettes were pulled from capillary glass (Harvard Apparatus, borosilicate glass capillaries, GC150F-7.5). For current-clamp (membrane-potential) recordings and some voltage-clamp recordings, pipettes were filled with a solution containing 105 K gluconate, 30 KCl, 10 HEPES, 4 ATP / Mg, 0.3 GTP Na2, 10 creatine phosphate/Na, pH adjusted to 7.3 with NaOH. For low noise voltage-clamp recordings, pipettes were filled with a cesium-based solution, containing (mM): Cs methane sulfonate 125, CsCl 5, KCl 10, EGTA 1, 10 HEPES, 4 ATP / Mg, 0.3 GTP Na2, 10 creatine phosphate/Na, pH adjusted to 7.3 with CsOH. Open pipette resistance was between 5 and 10 MΩ, and the membrane potential signal was corrected for nulling of the liquid junction potential before seal formation. Whole-cell recordings were established using an Axon Multiclamp 700B patch-clamp amplifier (Molecular Devices) using a feedback resistor of 50 GΩ, low-pass filtered at 4 kHz (Bessel, 8-pole) and sampled at 20 kHz with 16-bit resolution (X-series PCIe board, National Instruments). Further Gaussian digital filtering (low-pass at 500–1000 Hz, high-pass at 0.25 Hz) was applied offline. Glutamate and NMDA responses were measured by pressure ejection of agonist dissolved in the Ringer solution, through pipettes with tip diameters of 5-10 μm, and pressures of 5-10 mBar, using a solenoid valve-controlled pressure ejection system. Recording and perfusion pipettes were positioned with LM-Mini stepper-motor-controlled micromanipulators (Luigs and Neumann, Ratingen, Germany). All recordings were carried out at room temperature (23 °C).
Intracellular calcium measurement
To record intracellular calcium signals, cells were loaded with the fluorescent indicator Oregon Green 488 BAPTA-1 AM (OGB, Life Technologies). OGB was dissolved in DMSO with 20% w/v Pluronic F-127, at 200 mg/ml, then diluted to a final concentration of 5 μM in PBS. Cells were loaded in this solution at room temperature for 1 hr, and imaged using epifluorescence (Olympus BX51W microscope, UMPlan FI 60X objective, X-Cite 120 light source, EXFO Photonic Solutions), and an sCMOS camera (Orca-Flash4.0, Hamamatsu). Using custom programs with the Matlab Image Processing Toolbox, regions of interest (ROIs) corresponding to individual cells were selected, and an automatic bleaching correction was applied by subtraction of a single exponential decay fitted by least-squares to the first 5-10 s of each response, preceding agonist application. Average signals across pixels in each ROI were analysed as the change in fluorescence (ΔF) relative to the median resting baseline level (F), i.e. ΔF/F. Cells were bathed in the same Ringer solution used for electrophysiology (see above). Glutamate or NMDA was either puff-applied through a pipette (see above), or added to the bath in concentrated aliquots.
Block face scanning electron microscopy
SCID/Beige mice bearing brain metastases formed by MDA231-BrM cells (28~35 days after the ICD injection) were terminally anaesthetized with an overdose of inhalation anaesthetic (isoflurane) and then immediately perfused with a buffered solution of 2.5% glutaraldehyde and 2% paraformaldehyde (0.1M phosphate buffer, pH 7.4). A vibratome was used to slice the brain in the coronal plane at 80 μm thickness. Sections that showed mKate+ metastasis were then further processed to be imaged in a block face scanning electron microscope. They were postfixed in potassium ferrocyanide (1.5%) and osmium (2%), then stained with thiocarbohydrazide (1%) followed by osmium tetroxide (2%). This was followed by overnight staining in uranyl acetate (1%), after which the sections were washed in distilled water at 50°C before being stained with lead aspartate at the same temperature. Finally, the sections were dehydrated in increasing concentrations of alcohol and then embedded in spurs resin, and hardened at 65°C for 24 h between glass slides. The regions containing the metastases were trimmed from the rest of the section using a razor blade and glued to a blank resin block.
The final trimmed block was imaged inside a scanning electron microscope (Zeiss Merlin, Zeiss NTS) at a voltage of 1.8 kV and image pixel size of 6 nm. Backscattered electrons were collected with a Gatan backscattered electron detector with a pixel dwell time of 1 microsecond. Serial images, 50 nm apart were collected from the selected region using an ultramicrotome mounted inside the microscope (3View, Gatan).
The final reconstruction from the serial images of the region of interest was made using a manual segmentation approach involving the TrakEM2 plugin39 in the FIJI software package (www.fiji.sc).
Immunohistochemical and immunofluorescent staining
Harvested mouse tissues (breasts with primary tumors, and brains and lungs with metastatic lesions) were fixed in 4% paraformaldehyde overnight, embedded in paraffin, and sectioned using a microtome (Leica). Antigen retrieval was performed in a citrate buffer (pH = 6.0) in a water bath at 95°C for 20 min. Primary antibodies were incubated at 4°C overnight: anti-NMDA Receptor Type 1 (GluN1) rabbit polyclonal antibody (ThermoFisher Scientific, IL, USA, PA3-102) at 1:500 dilution, anti-GluN2B mouse monoclonal antibody (ThermoFisher Scientific, IL, USA, PA3-105) at 1:500 dilution and anti-pGluN2B Y1252 or anti-pGluN2B Y1472 rabbit polyclonal antibody (ThermoFisher Scientific, IL, USA, 485200 or 387000) at 1:200 dilution. For Immunohistochemical (IHC) staining, secondary antibodies (ImmPRESS HRP reagent kit, anti-rabbit MP-7401 and anti-Goat MP-7405) were incubated in room temperature for 45 min, and finally visualized with the peroxidase substrate DAB (Sigma-Aldrich, D5637-1G) for a maximum of 10 min at room temperature. The stained tissue sections were counterstained with Meyer’s hematoxylin. For Immunofluorescence (IF) staining, secondary antibodies (Alexa Fluor 488, 568, 647, Thermo Fisher Scientific) were incubated at room temperature for 45 min. Images were acquired with Leica DM5500B or Zeiss LSM 700 upright confocal microscopes, and analyzed with Image J. For STED analysis of mouse brain tissue sections with metastasis, mouse brains were perfused with 4% PFA and postfixed overnight at 4°C. Fixed brains were embedded in 2.5% low melting-point agarose in 1x PBS and sectioned into 50 μm slides with a Leica Biosystems vibratome (Leica VT1200S). Slides were incubated with primary antibodies at 4°C for two days and secondary antibodies (Rhodamine, Alexa Fluor 647, 680, 594, Jackson ImmuneResearch) applied overnight. Mounted sections were imaged with Leica SP8 STED 3x microscope. The 3D reconstruction from the serial STED images of the region of interest was made using Arivis 3.0. The primary antibodies used herein are listed in the Reporting Summary.
Knockdown and rescue expression constructs
For inducible knock-down of human or mouse GRIN2B we used the piggyBac-based inducible miR-E-based shRNA knock-down system (vectors PB31;G418 resistance and PB37; blasticidin resistance), and for rescue the inducible open reading frame of GRIN2B overexpression vector PB33 (G418 resistance) that were generated in our laboratory8. Targeted sequences of the shRNAs are shown in the supplementary information of Fellmann et al.40 The shRNA IDs and sequences (5’-3’) are:
Human GRIN2B.4138:
TGCTGTTGACAGTGAGCGACAGCGTAAGCCTGAAAGACAATAGTGAAGCCACAGATGTATTGTCTTTCAGGCTTACGCTGCTGCCTACTGCCTCGGA;
Human GRIN2B.1492:
TGCTGTTGACAGTGAGCGCACGCATAGTCACTGAGAATAATAGTGAAGCCACAGATGTATTATTCTCAGTGACTATGCGTTTGCCTACTGCCTCGGA
Human GRIN2B.3350:
TGCTGTTGACAGTGAGCGATCCGATGTCTCTGACATCTCATAGTGAAGCCACAGATGTATGAGATGTCAGAGACATCGGAGTGCCTACTGCCTCGGA;
Mouse Grin2b.4009:
(TGCTGTTGACAGTGAGCGACAGCAATATAAGGACAGTCTATAGTGAAGCCACAGATGTATAGACTGTCCTTATATTGCTGCTGCCTACTGCCTCGGA);
Mouse Grin2b.342:
TGCTGTTGACAGTGAGCGCCACAGAGACTCCTCTACTAAATAGTGAAGCCACAGATGTATTTAGTAGAGGAGTCTCTGTGTTGCCTACTGCCTCGGA;
Mouse Grin2b.340:
TGCTGTTGACAGTGAGCGACACACAGAGACTCCTCTACTATAGTGAAGCCACAGATGTATAGTAGAGGAGTCTCTGTGTGGTGCCTACTGCCTCGGA.. Human GRIN2B cDNA was purchased from Origene (RC223623L2, NM000832). To induce expression of the shRNAs or the ORF, 1 μg/ml doxycycline hyclate (Sigma-Aldrich) was added.
mRNA and Protein detection
mRNA extractions from cultured cells were performed with the Qiagen miRNeasy kit (217004). Reverse transcription of total RNA (500 ng) into cDNA was performed with PrimeScript (Takara, RR036Q). All qRT-PCR reactions were performed as triplicates in 7900HT qPCR instrument (Applied Biosystems). Results were normalized to the housekeeping genes beta-actin or GAPDH (for human) and Rpl19 or GAPDH for mouse. For western blotting, cultured cells were lysed in RIPA lysis buffer (Thermo Fisher Scientific, 89900), and protein concentrations were determined using Bradford 1X dye reagent (Bio-Rad). Proteins were separated by SDS-PAGE and transferred to nitrocellulose membranes. After blocking the membranes with 5% BSA in TBST buffer for 1 hr at room temperature, primary antibodies were incubated at 4°C overnight, and then secondary antibodies were incubated for 1 hr at room temperature. Finally, the membranes were visualized with an enhanced chemiluminescence reagent (Thermo Fisher Scientific).
Measurement of glutamate concentration
3x10⁵ MDA231/TS1 parental and -BrM cells were seeded into one well of a 6-well plate. 48 hrs later, the conditioned media were harvested and filtered using 10 kDa Amicon Ultra centrifugal units. L-glutamate quantification was performed with the colorimetric Glutamate Assay Kit (sigma, MAK004-1KT), following the manufacturer’s protocol.
Cell proliferation assay
Cell proliferation rate was measured using an MTT cell proliferation kit (Roche). Briefly, cells were plated in triplicate in 96-well plates (5x10³ or 1x10⁴). Seventy-two hours later, 10 μl of MTT labeling reagent was added to each well and then incubated for 4h at 37°C, followed by the addition of 100 μl MTT solubilization reagent overnight. Absorbance was measured at 595 nm on a plate reader (Tecan Safire).
Statistical analysis
Statistics were performed with Prism 7 (GraphPad Software). Unless stated otherwise, the Student’s t test was used for non-paired experiments (two-tailed). Wilcoxon matched pairs test (two-tailed) was performed for paired experiments that did not follow a Gaussian distribution. Values are mean ± s.e.m.
Extended Data
Extended Data Figure 1. Association of the NMDAR signaling pathway with human breast cancer.
a, mRNA expression of 6 NMDAR-associated genes (GRIN2A, GRIN2B, GRIN2C, GRIN2D, GRIN1 and DLGAP1) in 1,100 breast cancer (BC) patients from The Cancer Genome Atlas (TCGA). Samples were sorted by NMDAR score (lower panel), which combines, for each sample, the Z-scores of normalized expression values of all 5 genes.
b, mRNA expression of 4 AMPAR-associated genes (GRIA1, GRIA2, GRIA4 and GRIA3) in 1,100 breast cancer (BC) patients from TCGA. Samples were sorted by AMPAR score (lower panel), which combines, for each sample, the Z-scores of normalized expression values of all 4 genes.
c, mRNA expression of 5 Kainate-associated genes (GRIK2, GRIK4, GRIK3, GRIK1 and GRIK5) in 1,100 breast cancer (BC) patients from TCGA. Samples were sorted by Kainate score (lower panel), which combines, for each sample, the Z-scores of normalized expression values of all 5 genes.
d, mRNA expression of 8 Metabotropic glutamate-associated genes (GRM8, GRM3, GRM4, GRM7, GRM2, GRM6 and GRM5) in 1,100 breast cancer (BC) patients from TCGA. Samples were sorted by Metabotropic score (lower panel), which combines, for each sample, the Z-scores of normalized expression values of all 5 genes.
e, Boxplot comparison of mRNA expression of GRIN2A, GRIN2B, GRIN2C, GRIN2D, DLGAP1 and GRIN1 (from left to right) across the five breast cancer PAM50 subtypes. P-values were computed using a two-sided ANOVA test.
f, Comparison between NMDAR score (X-axis) and a previously derived NMDAR expression signature (Y-axis) across all breast cancer samples. Points are color coded based on points concentration (warm color = high concentration, cold colors = low concentration), n = 1100.
g, Boxplot comparison of scores from the previously derived NMDAR expression signature across the five PAM50 breast cancer subtypes.
h, Kaplan-Meier plots comparing distant-relapse free survival between samples with high GRIN2B expression (top 25%, red line) versus remaining cases (blue line) in Luminal B, Her2-enriched, Luminal B, Normal-like, and Basal-like breast cancer subtypes (from left to right). Log-rank tests are two-sided.
In all comparisons, the number of samples for each breast cancer subtype (panels a-e and g) are: Luminal A (n = 467), Luminal B (n = 198), Her2-enriched (n = 72), Normal-like (n = 28), Basal-like (n = 155). The thick central line of each box plot represents the median number of significant motifs, the bounding box corresponds to the 25th–75thpercentiles, and the whiskers extend up to 1.5 times the interquartile range.
Extended Data Figure 2. GluN2B-NMDAR signaling is activated in brain metastasis.
a, Representative H&E stained images of two paired human primary breast cancers (primary) and brain metastases (brain mets) are shown. Scale bar, 100 μm. Two independent experiments.
b, Quantification of pGluN2B Y1472 staining in 16 primary breast tumors and 18 brain metastases, including 9 matched primary cancers and brain mets, along with 7 unmatched primary tumors and 9 unmatched brain mets. Mean ± s.e.m. Mann-Whitney test (two-tailed) was used. Subtype categorization for those patients are: 4 TNBC, 6 Her2+, 2 luminal and 13 unknown.
c-e, Representative images (c) and quantification (d) of IHC staining of pGluN2B Y1252 in 12 paired human primary breast cancers (primary) and brain metastases (brain mets). Mean ± s.e.m. Wilcoxon test analysis (two-tailed). Subtype categorization for these twelve patients: 1 TNBC, 4 HER2+, 2 luminal and 5 unknown. (e), Quantification of pGluN2B Y1252 staining in 16 primary breast tumors and 22 brain metastases, including 12 matched primary cancers and brain mets, along with 4 unmatched primary tumors and 8 unmatched brain mets. Mean ± s.e.m. The Mann-Whitney (two-tailed) statistical test was used. Subtype categorization for those patients: 4 TNBC, 6 Her2+, 2 luminal and 13 unknown. Scale bar, 100 μm.
f-h, IHC staining of GluN2B in 16 human primary breast cancers and 23 brain metastases. Representative images (f), Wilcoxon test analysis (two-tailed) of the 15 matched primary cancers and brain mets (g), and Mann-Whitney (two-tailed) test analysis (h) of all samples. Mean ± s.e.m. (It remains to be ascertained whether the few brain mets lacking GluN2B expression have activated NMDAR signaling via another GluN2 subunit.) Scale bar, 100 μm. Subtype categorization for those patients: 4 TNBC, 6 Her2+, 2 luminal and 13 unknown.
i-k, IHC staining of GluN1 in 16 human primary breast cancers and 16 brain metastases. Representative images (i), Wilcoxon test (two-tailed) analysis of the 11 matched primary cancers and brain mets, (j) and Mann-Whitney test (two-tailed) analysis (k) of all samples. Mean ± s.e.m. Scale bar, 100 μm. Note that due to variations in the presence of cancer in the sections taken from the TMA block for analysis, not all 25 samples were represented in each of the immuno-stainings performed in Figure 2 and in this figure. Subtype categorization for those patients: 4 TNBC, 6 Her2+, 2 luminal and 13 unknown.
l, Representative IHC staining of pGluN2B Y1472, total GluN2B, and luciferase in primary tumours, brain mets, and lung mets formed by MDA231-B2BM cells (day 28~35 after injection). Scale bar, 100 μm. The areas indicated by black boxes are shown in Figure 2e.
m, n, IHC staining of pGluN2B Y1252, total GluN2B, and luciferase (m) and quantification of pGluN2B Y1252 staining (n) in primary tumors, brain mets, and lung mets formed by MDA231-BrM cells (day 28~35 after injection). Scale bar, 100 μm. Insets are magnified 3.2-times relative to the main field. Two-tailed Student t-test, mean ± s.e.m., n = 3 mice per group.
Extended Data Figure 3. NMDAR-mediated calcium signaling and single channel currents in BrM cells.
To test for functional NMDARs, fluorescence imaging and patch-clamp recordings were carried out in 2D cultures of TS1-BrM cells, 14 view-fields (301 X 301 μm) from 10 different culture dishes. Total of 151 responding cells out of 1,070 imaged cells = 14.11%. Data from bath addition of 50-100 uL of 100 mM KGlut, 50-200 uL of 10 mM NMDA, or local perfusion-pipette puffing of 100 uM K Glutamate, or of 500 uM NMDA, all of which produced calcium responses.
a-c, Representative calcium imaging experiments.
a, TS1BrM cells were loaded with Oregon Green BAPTA-1 AM fluorescent calcium indicator, and imaged with a sCMOS camera at 5 frames per second. A subset of cells in the field of view (13/75) showed calcium elevation in response to addition of glutamate to the bath (50 μL of 10 mM glutamate, final concentration 125 μM).
b, Calcium signals from 4 cells as indicated in (a), with glutamate application at the arrow.
c, Average signal over the 13 agonist-responsive cells during application of glutamate (blue trace) or preceding control application of the same volume of Ringer solution (red trace).
d, Response to application of 50 uL of 10 mM NMDA (final concentration 125 μM), averaged over 6 responding cells within a field of view containing 30 cells (blue trace), compared to an example response averaged over 52 cells to the same amount of NMDA, but in the presence of 100 μM APV and 2 mM Mg2+ (red trace). Overall, calcium transients stimulated either by NMDA or glutamate were detectable in about 14% of cells (151 of 1,070 cells, from 10 culture dishes).
e-g, Puff application (pipette at left) of NMDA (200 μm, gray bar) activates inward single-channel currents recorded through the pipette at right (e, f), with amplitudes of ≈4.5 pA at a holding potential of -90 mV (g), equivalent to a chord conductance of 50 pS, characteristic of GluN2A/GluN2B-containing NMDARs. 4.5 pA single-channel currents were detectable in low-noise whole-cell recordings on application of glutamate (100 μM) or NMDA (200 μM) in 45% (9/20) of recorded cells.
h, Resting membrane potentials were measured with whole-cell current-clamp using pipettes filled with cytoplasm-like high-potassium solutions (box plot, -52 ± 10.6 mV (mean ± SEM, n = 9 cells). For comparison, the voltage-dependence of GluN2A/2B inward current in physiological (1 mM) magnesium is superimposed41,42, indicating that membrane potentials are sufficiently depolarized to overcome a substantial fraction of voltage-dependent magnesium block of NMDARs.
Extended Data Figure 4. Brain mets are not inducing the neuronal apoptosis anticipated for autocrine secretion of glutamate by cancer cells.
a, WB analysis of Western blotting of the xCT and vGlut2 glutamate transporters in pairs of human and mouse parental breast cell lines and their corresponding brain metastatic derivatives. Protein levels in BrM cells are quantitated relative to cognate parental cell, after normalization to GAPDH. Three independent experiments. GAPDH was run on separate gels from xCT and vGlut2 as sample processing controls.
b, Immunohistochemical-(DAB)-based staining to detect apoptotic cells in mouse brains with metastases formed by MDA231-BrM cells (day 28~35 after injection). DNAase I treatment on brain tissue sections was used as a TUNEL+ control. Images shown are representative of an analysis of >20 brain mets from 4 mouse brains, 2 sections/mouse brain. Scale bar, 10 μm.
c, Immunofluorescent staining for cleaved-caspase 3 (green), luciferase (cancer cells; magenta) and NeuN (neurons; red) in mouse brain with metastases formed by MDA231-BrM cells (day 28~35 after injection). Images shown are representative of an analysis of >20 brain mets from 4 mouse brains, 2 sections/mouse brain. Scale bar, 10 μm.
d, Immunofluorescence staining for TUNEL (green), NeuN (red), GFAP (glioma cells; magenta) in a brain harboring a glioma that arose in a genetically engineered mouse model43. Images shown are representative of an analysis of > 6 gliomas from 6 mouse brains, 1 section/mouse brain. As previously reported24, glioma cells secrete glutamate that causes neuronal apoptosis, in contrast to BrM cells, which do not. Scale bar, 50 μm.
Extended Data Figure 5. Interactions between BrM cells and neurons.
a-c, Immunofluorescence staining of luciferase (B2BM; blue), vGlut2 (red) and pGluN2B 1252 (green) in a mouse brain metastasis formed by MDA231-BrM cells (day 28~35 after injection), imaged by STED super-resolution microscopy. (a, b) Tilted 3D images of the area circumscribed by the white solid border box in Fig. 4a. Arrow, vGlut2+ in presynaptic neuron; arrowhead, pGluN2B Y1252+ in a blue-labelled B2BM cell, potentially in close apposition to a postsynaptic neuron. (c) Tilted 3D image of the area circumscribed by the white dotted border box in Fig. 4a depicting a normal synapse revealed by close association between vGlut2+ puncta in a presynaptic neuron (arrow) with pGluN2B+ puncta in a postsynaptic neuron (arrowhead). Side length for each square in 3D view, 400 nm (a-b) and 300 nm (c). Images shown are representative of an analysis of 9 brain mets from 3 mouse brains, 2 sections/mouse brain. See Supplemental Videos further describing the images shown in a-c.
d, e, Immunofluorescence staining of luciferase (green) and synaptobrevin 1 (red) in a mouse brain metastasis formed by MDA231-BrM cells (day 28~35 after injection), imaged by STED super-resolution microscopy. Shown in part d are a merged image (left panel) and individual fluorescent images (middle and left panels), scale bar, 10 μm. Part e shows a tilted 3D image at lower and higher magnifications, highlighting a synaptobrevin 1+ bouton chain (red) localized proximal to luciferase+ tumor cells (green). Images shown are representative of an analysis of nine brain mets from three mouse brains, 2 sections/mouse brain. Side length for each square in 3D view, 10 μm.
f,g, Immunofluorescence staining for post-synaptic proteins PSD-95 (red, f), and Neuroligin 2 (red, g) along with luciferase (green) in mouse brains with metastases formed by MDA231-BrM cells (day 28~35 after injection). Scale bar, 10 μm. The area circumscribed by the white box is shown in the leftmost column. Scale bar, 1 μm. Images shown are representative of an analysis of >20 brain mets from 4 mouse brains, 2 sections/mouse brain.
Extended Data Figure 6. NMDAR signaling in BrM cells is activated in co-culture with neurons.
a, Schematic of cancer cell - primary neuron co-culture system and experimental design.
b, Immunofluorescence staining for MAP2 (neuronal marker, green) and GFAP (astrocyte marker, red) in primary cultures of cortical neurons, revealing the preponderance of neurons. Scale bar, 10 μm, except for the leftmost panel, in which the area circumscribed by the white box is shown at higher magnification; scale bar, 1 μm. Three independents experiments.
c, Representative brightfield (BF) and fluorescent (mKate+) images (left panel), and quantification (right panel) of MDA231 parental and MDA231-BrM cells co-cultured with primary cortical neurons for 14 days. Two-tailed Student t-test, mean ± s.e.m., n = 3 biological replicates over three independent experiments. Scale bar, 100 μm.
d, Representative bright-field and fluorescent images (left panel) and quantification (right) of TS1 parental and TS1-BrM cells co-cultured with primary cortical neurons for 14 days. Data are represented as mean ± s.e.m. Student t-test (two-tailed) was used. n = 3 biological replicates over three independent experiments.
e-g, Quantification of MDA231 parental and MDA231-BrM cell numbers after 14 days of culture in poly-D-lysine coated plates in three different conditions: in complete neuronal culture medium (e); in conditioned medium from primary cortical neuron cultures (f); and in a Boyden chamber with neurons in the top chamber and cancer cells in the bottom chamber (g). Mean ± s.e.m. Student t-test (two-tailed) was used. n = 3 biological replicates over three independent experiments. The panels below each bar graph show representative images of the cancer cells at the end of the assay, revealed by mKate fluorescence.
h, Schematic inducible miR-E-based shRNA knock-down system carrying 3 distinct miR-E-based shRNA sequences that bind to different regions of a targeted mRNA (top vector), and tet-on inducible vector for GRIN2B open reading frame (ORF) used for rescue experiments (bottom vector). TRE; tet-on inducible promoter, rtTA; reverse tetracycline transactivator.
i, Knockdown of GRIN2B in cultured MDA231-BrM cells with tet-on inducible shRNAs, as assessed by western blotting after DOX treatment (1 μg/ml) for 2 days. Three independent experiments. The numbers above indicate levels of pGluN2B Y1252 and total GluN2B protein normalized to GAPDH. GAPDH was run in the same gel as pGluN2B Y1252, and run on separate gels from GluN2B as sample processing controls.
j, Representative brightfield and fluorescent images (bottom panel) and quantification (top panel) of MDA231-BrM cells transfected with inducible shCTRL and shGRIN2B (DOX; 1 μg/ml), co-cultured with primary cortical neurons for 14 days. Two-tailed Student t-test, mean ± s.e.m., n = 3 biological replicates over three independent experiments. Scale bar, 100 μm.
k, Rescue expression of GluN2B in cultured MDA231-BrM cells with tet-on inducible shRNAs along with a GRIN2B cDNA, as assessed by western blotting after DOX treatment (1 μg/ml) for 2 days. Three independent experiments. GAPDH was run in the same gel as GluN2B.
l, Representative fluorescent (mKate+) images (left panel), and quantification (right panel) of MDA231 shCTRL, shGRIN2B and GluN2B rescue cells co-cultured with primary cortical neurons for 14 days. Two-tailed Student t-test, mean ± s.e.m., n = 3 biological replicates over three independent experiments. Scale bar, 100 μm.
m, Cell proliferation in shCTRL and shGRIN2B BrM cells as determined by MTT assays, starting with 5,000 or 10,000 cells per well, after 72 hrs in culture. Two way ANOVA, mean ± s.e.m., n = 3 independent experiments.
Extended Data Figure 7. In vivo assessment of the functional importance of GluN2B-NMDAR signaling in brain-metastatic human breast cancer cells.
a-b, Representative immunofluorescent images of FMRP (green), luciferase (red) and DAPI (blue) in brain metastases formed by shCTRL and shGRIN2B MDA231 cells (a), and quantification of mean FMRP fluorescence in Luciferase+ tumour cell clusters (b). Two-tailed Student t-test, mean ± s.e.m.; n = 25 for shCTRL and n = 32 shGRIN2B group, all from 3 mice per group.
c, Weight of orthotopic breast tumors formed by MDA231-BrM cells transfected with inducible shCTRL or shGRIN2B inoculated into the 4th mammary fat pads of female mice. DOX food was added to induce the shRNAs concomitantly with MFP injection. Two-tailed Student t-test, mean ± s.e.m.; n = 9 mice for shCTRL group, and 10 mice for shGRIN2B group.
d, Bio-luminescent imaging (BLI) and quantification of lung metastatic lesions formed by MDA231-BrM cells transfected with inducible shCTRL or shGRIN2B inoculated IV. DOX food was added to induce the shRNAs concomitantly with IV injection. Two-tailed Student t-test, mean ± s.e.m.; n = 5 mice per group, two independent experiments.
e, Bio-luminescent imaging (BLI) and quantification of brain metastatic lesions formed by MDA231-BrM cells transfected with inducible shCTRL or shGRIN2B, or additionally with rescue expression of a GRIN2B cDNA. DOX food was supplied concomitantly with ICD injection to induce shRNA expression. Tumor burden was assessed 4 weeks later by BLI. Two independent experiments. Two-tailed Student t-test, mean ± s.e.m.; n = 10 mice for shCTRL group, 9 mice for shGRIN2B group and 9 mice for rescue group.
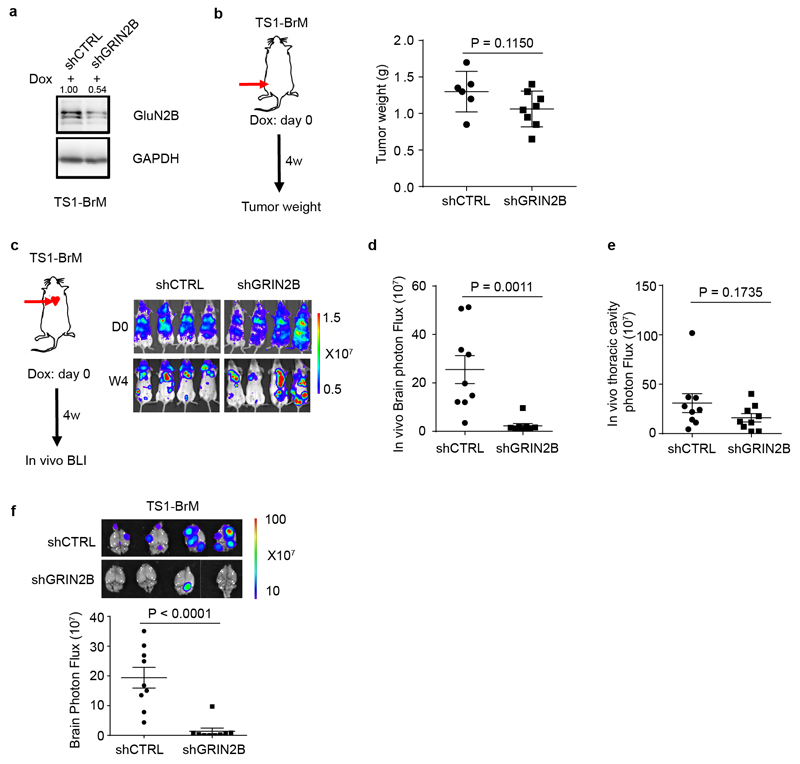
Extended Data Figure 8. Functional analysis of GluN2B expression in brain-metastatic mouse breast cancer cells.
a, Knockdown of GluN2B expression in cultured mouse TS1-BrM cells with tet-on inducible shRNAs, as assessed by western blotting 2 days after DOX treatment in vitro (1 μg/ml). Three independent experiments. The numbers above indicate levels of GluN2B normalized to GAPDH. GAPDH was run in the same gel as GluN2B.
b, Weight of primary orthotopic breast tumors formed by TS1-BrM cells transfected with inducible shCTRL or shGRIN2B, and inoculated into the 4th mammary fate pad of female mice. DOX food was added to induce the shRNAs concomitantly with MFP injection. Two-tailed Student t-test, mean ± s.e.m.: n = 6 mice for shCTRL group, and 8 mice for shGRIN2B group.
c-e, In vivo bioluminescent imaging (c) and quantification of brain (d) and thoracic cavity (e) photon flux in mice bearing TS-BrM cells transfected with inducible shCTRL or shGRIN2B four weeks after intracardiac injection. DOX food was supplied concomitantly with ICD injection to induce shRNA expression. Two-tailed Student t-test, mean ± s.e.m.; n = 9 mice per group, two independent experiments.
f, Ex vivo bioluminescent imaging (BLI) and quantification of excised brains with metastatic lesions formed by TS1-BrM cells transfected with inducible shCTRL or shGRIN2B. DOX food was supplied concomitantly with ICD injection to induce shRNA expression. Two-tailed Student t-test, mean ± s.e.m.; n = 9 mice per group, two independent experiments.
Supplementary Material
Acknowledgements
We thank: J. Massague (Memorial Sloan Kettering Cancer Center), and J. Joyce, (Univ. Lausanne) for respectively providing the MDA231 and TS1 parental and derivative ‘-BrM’ cell lines; J. Massague, K. Pietras (Lund Univ.) and M. De Palma (EPFL) for helpful comments on the manuscript; S. Grant (Univ. Edinburgh) for insightful suggestions; MW. Peng, A. Dubois, S. Lamy and L. Drori (EPFL) for technical support; J. Scotton, EPFL for providing mouse glioma samples; W. Tang (BMI, EPFL) as well as all the members of the Hanahan lab for discussions. This work was principally supported by grants from the Swiss National Science Foundation and the European Research Council, and by a gift from the Biltema Foundation that was administered by the ISREC Foundation, Lausanne, Switzerland.
Footnotes
Data availability
All materials are readily available from the corresponding author upon request or from standard commercial sources, including original IVIS data, Confocal/STED/EM images, IHC staining of human/mouse samples, full Western Blots et al. There are no restrictions on availability of the materials used in the study.
Author Contributions
Q.Z., G.C. and D. H. conceptualized the project and designed the experiments; I.M. contributed to the experimental design. G.C., S.S. and P.Z. performed the bioinformatic analysis; I.M. and Q.Z. generated the knock-down and rescue approach. J. G. and I.Z. did the IHC staining on human breast cancer and brain metastasis samples; H.R. carried out electrophysiology and calcium imaging. J.W., Q.Z. and B.M. performed the STED analysis of mouse brain with brain mets; G.K. did the EM analysis; Q.Z. performed in vivo, in vitro and primary culture experiments, data analyses and quantification; Q.Z., G.C., I.M., and D.H. prepared the manuscript.
Author Information
Reprints and permissions information is available at www.nature.com/reprints.
The authors declare no competing interests.
References
- 1.Lambert AW, Pattabiraman DR, Weinberg RA. Emerging Biological Principles of Metastasis. Cell. 2017;168:670–691. doi: 10.1016/j.cell.2016.11.037. [DOI] [PMC free article] [PubMed] [Google Scholar]
- 2.Vanharanta S, Massagué J. Origins of Metastatic Traits. Cancer Cell. 2013;24:410–421. doi: 10.1016/j.ccr.2013.09.007. [DOI] [PMC free article] [PubMed] [Google Scholar]
- 3.Lin NU, Amiri-Kordestani L, Palmieri D, Liewehr DJ, Steeg PS. CNS Metastases in Breast Cancer: Old Challenge, New Frontiers. Clin Cancer Res. 2013;19:6404–6418. doi: 10.1158/1078-0432.CCR-13-0790. [DOI] [PMC free article] [PubMed] [Google Scholar]
- 4.Bos PD, et al. Genes that mediate breast cancer metastasis to the brain. Nature. 2009;459:1005–1009. doi: 10.1038/nature08021. [DOI] [PMC free article] [PubMed] [Google Scholar]
- 5.Sevenich L, et al. Analysis of tumor- and stroma-supplied proteolytic networks reveals a brain metastasis-promoting role for cathepsin S. Nat Cell Biol. 2014;16:876–888. doi: 10.1038/ncb3011. [DOI] [PMC free article] [PubMed] [Google Scholar]
- 6.Valiente M, et al. Serpins Promote Cancer Cell Survival and Vascular Co-Option in Brain Metastasis. Cell. 2014;156:1002–1016. doi: 10.1016/j.cell.2014.01.040. [DOI] [PMC free article] [PubMed] [Google Scholar]
- 7.Chen Q, et al. Carcinoma–astrocyte gap junctions promote brain metastasis by cGAMP transfer. Nature. 2016;533:493–498. doi: 10.1038/nature18268. [DOI] [PMC free article] [PubMed] [Google Scholar]
- 8.Michael IP, et al. ALK7 Signaling Manifests a Homeostatic Tissue Barrier That Is Abrogated during Tumorigenesis and Metastasis. Dev Cell. 2019;49:409–424.e6. doi: 10.1016/j.devcel.2019.04.015. [DOI] [PubMed] [Google Scholar]
- 9.Park ES, et al. Cross-species hybridization of microarrays for studying tumor transcriptome of brain metastasis. Proc Natl Acad Sci. 2011;108:17456–17461. doi: 10.1073/pnas.1114210108. [DOI] [PMC free article] [PubMed] [Google Scholar]
- 10.Neman J, et al. Human breast cancer metastases to the brain display GABAergic properties in the neural niche. Proc Natl Acad Sci. 2014;111:984–989. doi: 10.1073/pnas.1322098111. [DOI] [PMC free article] [PubMed] [Google Scholar]
- 11.Li L, Hanahan D. Hijacking the Neuronal NMDAR Signaling Circuit to Promote Tumor Growth and Invasion. Cell. 2013;153:86–100. doi: 10.1016/j.cell.2013.02.051. [DOI] [PubMed] [Google Scholar]
- 12.Li L, et al. GKAP Acts as a Genetic Modulator of NMDAR Signaling to Govern Invasive Tumor Growth. Cancer Cell. 2018;0 doi: 10.1016/j.ccell.2018.02.011. [DOI] [PMC free article] [PubMed] [Google Scholar]
- 13.Robinson HPC, Li L. Autocrine, paracrine and necrotic NMDA receptor signalling in mouse pancreatic neuroendocrine tumour cells. Open Biol. 2017;7 doi: 10.1098/rsob.170221. [DOI] [PMC free article] [PubMed] [Google Scholar]
- 14.Roche KW, et al. Molecular determinants of NMDA receptor internalization. Nat Neurosci. 2001;4:794–802. doi: 10.1038/90498. [DOI] [PubMed] [Google Scholar]
- 15.Takasu MA, Dalva MB, Zigmond RE, Greenberg ME. Modulation of NMDA Receptor- Dependent Calcium Influx and Gene Expression Through EphB Receptors. Science. 2002;295:491–495. doi: 10.1126/science.1065983. [DOI] [PubMed] [Google Scholar]
- 16.Lavezzari G, McCallum J, Lee R, Roche KW. Differential binding of the AP-2 adaptor complex and PSD-95 to the C-terminus of the NMDA receptor subunit NR2B regulates surface expression. Neuropharmacology. 2003;45:729–737. doi: 10.1016/s0028-3908(03)00308-3. [DOI] [PubMed] [Google Scholar]
- 17.Nakazawa T, et al. NR2B tyrosine phosphorylation modulates fear learning as well as amygdaloid synaptic plasticity. EMBO J. 2006;25:2867–2877. doi: 10.1038/sj.emboj.7601156. [DOI] [PMC free article] [PubMed] [Google Scholar]
- 18.Matsumura S, et al. Impairment of CaMKII activation and attenuation of neuropathic pain in mice lacking NR2B phosphorylated at Tyr1472. Eur J Neurosci. 2010;32:798–810. doi: 10.1111/j.1460-9568.2010.07348.x. [DOI] [PubMed] [Google Scholar]
- 19.Knox R, et al. NR2B phosphorylation at Tyrosine 1472 contributes to brain injury in a rodent model of neonatal hypoxia-ischemia. Stroke J Cereb Circ. 2014;45:3040–3047. doi: 10.1161/STROKEAHA.114.006170. [DOI] [PMC free article] [PubMed] [Google Scholar]
- 20.Levy AD, et al. Noonan Syndrome-Associated SHP2 Dephosphorylates GluN2B to Regulate NMDA Receptor Function. Cell Rep. 2018;24:1523–1535. doi: 10.1016/j.celrep.2018.07.006. [DOI] [PMC free article] [PubMed] [Google Scholar]
- 21.Ciriello G, et al. Comprehensive Molecular Portraits of Invasive Lobular Breast Cancer. Cell. 2015;163:506–519. doi: 10.1016/j.cell.2015.09.033. [DOI] [PMC free article] [PubMed] [Google Scholar]
- 22.Fonnum F, Storm-Mathisen J, Divac I. Biochemical evidence for glutamate as neurotransmitter in corticostriatal and corticothalamic fibres in rat brain. Neuroscience. 1981;6:863–873. doi: 10.1016/0306-4522(81)90168-8. [DOI] [PubMed] [Google Scholar]
- 23.Briggs KJ, et al. Paracrine Induction of HIF by Glutamate in Breast Cancer: EglN1 Senses Cysteine. Cell. 2016;166:126–139. doi: 10.1016/j.cell.2016.05.042. [DOI] [PMC free article] [PubMed] [Google Scholar]
- 24.Takano T, et al. Glutamate release promotes growth of malignant gliomas. Nat Med. 2001;7:1010. doi: 10.1038/nm0901-1010. [DOI] [PubMed] [Google Scholar]
- 25.Buckingham SC, et al. Glutamate release by primary brain tumors induces epileptic activity. Nat Med. 2011;17:1269. doi: 10.1038/nm.2453. [DOI] [PMC free article] [PubMed] [Google Scholar]
- 26.Danbolt NC. Glutamate uptake. Prog Neurobiol. 2001;65:1–105. doi: 10.1016/s0301-0082(00)00067-8. [DOI] [PubMed] [Google Scholar]
- 27.Scheiffele P, Fan J, Choih J, Fetter R, Serafini T. Neuroligin Expressed in Nonneuronal Cells Triggers Presynaptic Development in Contacting Axons. Cell. 2000;101:657–669. doi: 10.1016/s0092-8674(00)80877-6. [DOI] [PubMed] [Google Scholar]
- 28.Fu Z, Washbourne P, Ortinski P, Vicini S. Functional Excitatory Synapses in HEK293 Cells Expressing Neuroligin and Glutamate Receptors. J Neurophysiol. 2003;90:3950–3957. doi: 10.1152/jn.00647.2003. [DOI] [PubMed] [Google Scholar]
- 29.Stogsdill JA, et al. Astrocytic neuroligins control astrocyte morphogenesis and synaptogenesis. Nature. 2017;551:192–197. doi: 10.1038/nature24638. [DOI] [PMC free article] [PubMed] [Google Scholar]
- 30.Harris KM, Weinberg RJ. Ultrastructure of Synapses in the Mammalian Brain. Cold Spring Harb Perspect Biol. 2012;4:a005587. doi: 10.1101/cshperspect.a005587. [DOI] [PMC free article] [PubMed] [Google Scholar]
- 31.Pacifici M, Peruzzi F. Isolation and Culture of Rat Embryonic Neural Cells: A Quick Protocol. JoVE J Vis Exp. 2012:e3965–e3965. doi: 10.3791/3965. [DOI] [PMC free article] [PubMed] [Google Scholar]
- 32.Fellmann C, et al. An Optimized microRNA Backbone for Effective Single-Copy RNAi. Cell Rep. 2013;5:1704–1713. doi: 10.1016/j.celrep.2013.11.020. [DOI] [PubMed] [Google Scholar]
- 33.Lorger M, Felding-Habermann B. Capturing Changes in the Brain Microenvironment during Initial Steps of Breast Cancer Brain Metastasis. Am J Pathol. 2010;176:2958–2971. doi: 10.2353/ajpath.2010.090838. [DOI] [PMC free article] [PubMed] [Google Scholar]
- 34.Amit M, Na’ara S, Gil Z. Mechanisms of cancer dissemination along nerves. Nat Rev Cancer. 2016;16:399–408. doi: 10.1038/nrc.2016.38. [DOI] [PubMed] [Google Scholar]
- 35.Ikonomidou C, Turski L. Why did NMDA receptor antagonists fail clinical trials for stroke and traumatic brain injury? Lancet Neurol. 2002;1:383–386. doi: 10.1016/s1474-4422(02)00164-3. [DOI] [PubMed] [Google Scholar]
- 36.Hänzelmann S, Castelo R, Guinney J. GSVA: gene set variation analysis for microarray and RNA-Seq data. BMC Bioinformatics. 2013;14:7. doi: 10.1186/1471-2105-14-7. [DOI] [PMC free article] [PubMed] [Google Scholar]
- 37.Hatzis C, et al. A Genomic Predictor of Response and Survival Following Taxane-Anthracycline Chemotherapy for Invasive Breast Cancer. JAMA. 2011;305:1873–1881. doi: 10.1001/jama.2011.593. [DOI] [PMC free article] [PubMed] [Google Scholar]
- 38.Weilinger NL, et al. Metabotropic NMDA receptor signaling couples Src family kinases to pannexin-1 during excitotoxicity. Nat Neurosci. 2016;19:432. doi: 10.1038/nn.4236. [DOI] [PubMed] [Google Scholar]
- 39.Cardona A, et al. TrakEM2 Software for Neural Circuit Reconstruction. PLOS ONE. 2012;7:e38011. doi: 10.1371/journal.pone.0038011. [DOI] [PMC free article] [PubMed] [Google Scholar]
- 40.Fellmann C, et al. An Optimized microRNA Backbone for Effective Single-Copy RNAi. Cell Rep. 2013;5:1704–1713. doi: 10.1016/j.celrep.2013.11.020. [DOI] [PubMed] [Google Scholar]
- 41.Vargas-Caballero M, Robinson HPC. Fast and Slow Voltage-Dependent Dynamics of Magnesium Block in the NMDA Receptor: The Asymmetric Trapping Block Model. J Neurosci. 2004;24:6171–6180. doi: 10.1523/JNEUROSCI.1380-04.2004. [DOI] [PMC free article] [PubMed] [Google Scholar]
- 42.Kim N-K, Robinson HPC. Effects of divalent cations on slow unblock of native NMDA receptors in mouse neocortical pyramidal neurons. Eur J Neurosci. 2011;34:199–212. doi: 10.1111/j.1460-9568.2011.07768.x. [DOI] [PubMed] [Google Scholar]
- 43.Shchors K, Massaras A, Hanahan D. Dual Targeting of the Autophagic Regulatory Circuitry in Gliomas with Repurposed Drugs Elicits Cell-Lethal Autophagy and Therapeutic Benefit. Cancer Cell. 2015;28:456–471. doi: 10.1016/j.ccell.2015.08.012. [DOI] [PubMed] [Google Scholar]
Associated Data
This section collects any data citations, data availability statements, or supplementary materials included in this article.


