

Abstract
Introduction
Pharmacological therapies to treat Alzheimer's disease (AD) targeting “Aβ” have failed for over 100 years. Low levels of laser light can disassemble Aβ. In this study, we investigated the mechanisms that Aβ-blocked extracellular space (ECS) induces memory disorders in APP/PS1 transgenic mice and addressed whether red light (RL) at 630 nm rescues cognitive decline by reducing Aβ-disturbed flow of interstitial fluid (ISF).
Methods
We compared the heating effects on the brains of rats illuminated with laser light at 630, 680, and 810 nm for 40 minutes, respectively. Then, a light-emitting diode with red light at 630 nm (LED-RL) was selected to illuminate AD mice. The changes in the structure of ECS in the cortex were examined by fluorescent double labeling. The volumes of ECS and flow speed of ISF were quantified by magnetic resonance imaging. Spatial memory behaviors in mice were evaluated by the Morris water maze. Then, the brains were sampled for biochemical analysis.
Results
RL at 630 nm had the least heating effects than other wavelengths associated with ~49% penetration ratio into the brains. For the molecular mechanisms, Aβ could induce formaldehyde (FA) accumulation by inactivating FA dehydrogenase. Unexpectedly, in turn, FA accelerated Aβ deposition in the ECS. However, LED-RL treatment not only directly destroyed Aβ assembly in vitro and in vivo but also activated FA dehydrogenase to degrade FA and attenuated FA-facilitated Aβ aggregation. Subsequently, LED-RL markedly smashed Aβ deposition in the ECS, recovered the flow of ISF, and rescued cognitive functions in AD mice.
Discussion
Aβ-obstructed ISF flow is the direct reason for the failure of the developed medicine delivery from superficial into the deep brain in the treatment of AD. The phototherapy of LED-RL improves memory by reducing Aβ-blocked ECS and suggests that it is a promising noninvasive approach to treat AD.
Keywords: Red light (RL), Alzheimer's disease (AD), Amyloid β (Aβ), Formaldehyde (FA), Formaldehyde dehydrogenase (FDH), Extracellular space (ECS), Interstitial fluid (ISF)
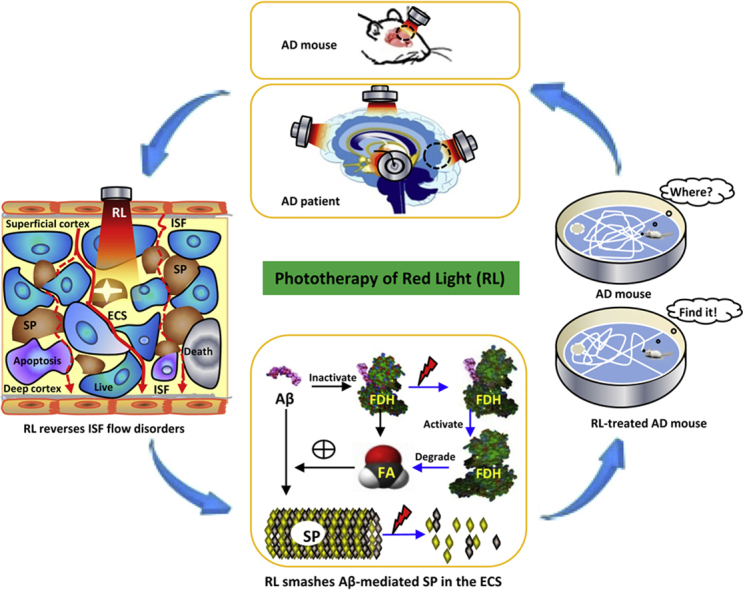
Graphical abstract
Highlights
-
•
Aβ-inactivated formaldehyde dehydrogenase induces formaldehyde accumulation.
-
•
Formaldehyde in turn accelerates Aβ deposition in the extracellular space.
-
•
Red light activates formaldehyde dehydrogenase to degrade formaldehyde.
-
•
Red light reduces Aβ self-aggregation and formaldehyde-promoted assembly.
-
•
Red light recovers interstitial fluid flow and alleviates memory deficits.
1. Introduction
The brain is a dynamic structure with the extracellular space (ECS) accounting for almost a quarter of its volume [1,2]. The interstitial fluid (ISF) in the ECS provides a survival environment for nerve cells, delivers neurotransmitters and pharmaceutical agents, and removes toxic metabolites [3]. In fact, neurons and glial cells release neuroactive substances, which then diffuse in the ECS to reach their target receptors in the membrane of neurons [4]. Physiologically, a smooth flow of ISF in the ECS is required for maintaining brain functions such as sleep [5] and development [6]. Disruption of the ISF flow has been found to be related with aging [3] and neuropsychiatric and degenerative diseases [7].
Alzheimer's disease (AD) is the most common neurodegenerative disease, leading to progressive cognitive decline [8,9]. Deposition of Aβ to form senile plaques (SPs) in the hippocampus and cortex is a pathological hallmark of AD [10,11]. However, over the past decades, targeting Aβ production, aggregation, and clearance by antibodies, vaccines, or small-molecule drugs have not resulted in desirable clinical efficacy [12]. An interesting study showed that transgenic AD model mice exhibited a marked decrease in ISF flow and an increase in ECS volume [13]. We speculated that the blockage of ISF flow by Aβ deposits may be a crucial reason for the failure of the developed medicine delivery from superficial into the deep brain in the treatment of AD.
A previous study showed that low-level laser lights disassemble Aβ in vitro for it could break the second structure of Aβ [14]. In this study, we investigated the effects of the light-emitting diode with red light (LED-RL, 630 nm) on Aβ deposits and its obstruction of ISF flow in APP/PS1 transgenic AD model mice. The results showed that phototherapy of LED-RL could penetrate into the skull, recover ISF flow by smashing Aβ deposition in the ECS, and alleviate cognitive deficits.
2. Methods
2.1. Animals
All protocols involving the use of animals were conducted in accordance with the Biological Research Ethics Committee, Capital Medical University, China. C57BL/6 mice (25 ± 5 g) were obtained from the Experimental Animal Center of Capital Medical University, China; and APP/PS1 male adult mice at the age of 4 and 6 months were provided by the Institute of Zoology, Chinese Academy of Medical Sciences, China. All the animals were maintained in cages at room temperature (25°C) under an alternating 12-hour light/dark cycle (lights on at 7: 00), with ad libitum access to food and water.
2.2. Illumination of red light on the skull and abdominal cavity of APP/PS1 mice
One group of APP/PS1 mice (n = 10) at the age of 4 months were confined in a mouse sleeve (Lucite pipe), and the skulls and abdomen were illuminated for 40 minutes at a light intensity of 0.55 mW/cm2 emitted from a LED-RL (630 nm) for 5 days per week over two consecutive months. Another group of APP/PS1 mice, used as the control, were confined similarly with a sunlight lamp. A group of healthy adult male C57BL/6 was used as a negative control. The mean optical power density and the light penetration through the skull and abdominal cavity of APP/PS1 mice were examined as described previously [15].
2.3. Detecting red light–irradiated thermal temperature of bone
A 1-cm bone was put into a hermetically sealed box and irradiated by low levels of laser light at 630, 680, and 810 nm for 40 minutes, respectively. The distance between bone and light sources was 2 cm. Then, the temperature of reverse side of bone was detected by a portable digital thermometer (Zhihui, Model: TC-01; Sanxing Technology Co., Ltd., Beijing, China), Accuracy: ±0.1°C. The hole of the data wire in the box was sealed to maintain box temperature.
2.4. Imaging formaldehyde fluorescence probe in mice
To measure brain formaldehyde (FA) levels, we used a fluorescence formaldehyde-RFAP-1 probe to detect FA [16]. The whole body of these mice was scanned using the in vivo imaging system 30 minutes after the probe was injected to the brain. To obtain clear FA fluorescence images, the brains of these mice were rapidly taken out and then used for animal imaging in a culture dish.
2.5. Intraperitoneal injection of FA and Thioflavin S–staining SPs in APP/PS1 mice
To examine whether FA enhances Aβ aggregation and subsequent SP formation, APP/PS1 mice were intraperitoneally injected with FA at 0.5 mM for one month [17]. The detection for SPs was performed using a method of Thioflavin S (Th S) staining as described previously [18].
2.6. The Morris water maze test
Spatial memory behaviors were assessed by the Morris water maze (MWM) test, as described previously [17]. Briefly, all mice were trained to mount a hidden/submerged escape platform in a restricted region of the pool for 6 consecutive days. After this learning phase, mice were subjected to a 60-second trial in the escape platform on day 7. The water maze activity was recorded with a video tracking system (Xinyuan Information Technology Co., Ltd., Shanghai, China).
2.7. Aβ aggregation examined by transmission electron microscopy
Fibrils were scanned by a transmission electron microscope as described previously [19].
2.8. Detection of FA and Aβ concentrations in tissues
All samples were collected and immediately placed on ice, before storing at −70°C until further processing. After centrifugation (8000 × g, 4°C, 10 min), FA concentrations in the blood and brain and liver homogenates were measured by high-performance liquid chromatography with fluorescence detection [20,21].
2.9. Intracellular FA analysis
The cultured N2a cells were scraped off petri dishes, the cell mixtures were centrifuged, and supernatants were discarded. The precipitate cells were harvested for intracellular FA measurements [20,21].
2.10. Measurement of FDH enzymatic activity in tissues
The activity of alcohol dehydrogenase 3 (ADH3, also named FDH) was measured by a commercially available kit according to the manufacturer's instructions (K787-100; BioVision, USA).
2.11. Double immunofluorescence analysis
Brain sections were prepared from APP/PS1 and control C57BL/6 mice. First antibodies—Mouse anti-GSNOR (ADH5, monoclonal antibody, 66193-1-Ig; Proteintech, USA), antibody-Aβ42 (AB5078P, Millipore, USA), rabbit Polyclonal antibody-A11 (1:100, TA326459; OriGene, USA), anti-ADH5 (FDH) Polyclonal Antibody (TA327239; OriGene)—and second antibodies—Goat Anti-Rabbit IgG H&L (Alexa Fluor 488) at a 1:500 dilution (ab150077; Abcam, UK), Goat Anti-Mouse IgG H&L (Alexa Fluor 594) at a 1:500 dilution (ab150116; Abcam)—were used in this study.
The synapse expressions of the sections from the hippocampus were strained by using MAP2 antibody (E2A7025, 1:100; EnoGene, China). Second antibody: IgG H&L (Fluo R594), 1:500 (Abcam, UK). Astrocytes were strained by using GFAP antibody (556328, 1:20; BD Pharmingen, USA). Second antibody: IgG H&L (Fluo m488), 1:500 (Abcam). Microglia were stained by using CD45 antibody (E2A6839, 1:100; EnoGene). Second antibody: IgG H&L (Fluo R594), 1:500 (Abcam). Finally, these cells were analyzed under a confocal microscope.
2.12. Brain IL-β and TNFα levels were detected by ELISA kits
The productions of Aβ-induced inflammatory including IL-β and TNFα were analyzed by ELISA kits according to the manufacturer's instructions (#H002, Interleukin-1β Assay Kit; #H052, Tumor Necrosis Factor-α Assay Kit; Nanjing Jiancheng Bioengineering Institute).
2.13. Purification of recombinant hFDH and measurement of FDH activity in vitro
The full-length, recombinant human FDH (hFDH) was provided by the Institute of Zoology, Chinese Academy of Medical Sciences, China. The purification of recombinant hFDH was performed as described previously [15]. FDH activity was tested at 25°C by monitoring the production of NADH at 340 nm for FA oxidation. Briefly, FDH was measured at pH 8.0 in 0.1 M sodium pyrophosphate, with S-(hydroxymethyl)glutathione (formed by mixing FA and glutathione) and NAD+. Kinetic constants for NAD+ and NADH were determined with 1 mM of glutathione and 1 mM of FA. Kinetic constants for S-(hydroxymethyl)glutathione were determined with 2.4 mM NAD+. Kinetic constants were calculated with the nonlinear regression program GraFit (version 3.0; Erithacus Software) as described previously [22].
2.14. Molecular simulation of FA-binding with Aβ and Aβ-binding with hFDH
The three-dimensional crystal structures of human Aβ (PDB ID: 1IYT) was downloaded for free (Protein Data Bank). FA-binding with Aβ or mutations was simulated using AutoDockTools 1.5.6 and the MGLTools software (http://mgltools.scripps.edu/). The hydrogen bonds between FA and Aβ were simulated using the PyMOL 1.7 software, which can be downloaded for free (http://sourceforge.net/projects/pymol/).
The crystal structures of human Aβ42 (PDB ID: 1Z0Q, hFDH (PDB ID: (PDB ID: 1TEH and 1MC5) were acted as molecular simulation template, which can be downloaded freely (Protein Data Bank, http://www.rcsb.org/pdb/home/home.do). To simulate the molecular structure of Aβ-binding with hFDH, the .pdb files of 1TEH-A, 1TEH-B, or 4W6Z and 1Z0Q were opened in the same window of Discovery Studio 3.0. Then, the structures of the simulated complex were deleted the water and atom, and selected the Dock Proteins (ZDOCK) of macromolecules. Next, run the process for several minutes. Next, we selected the result with the highest cluster versus ZDock score and further performed the docking optimization configuration root mean square deviation using refine docked proteins. The docking configuration with the lowest score was selected for the equilibrium stage and carried out for molecular dynamics. Finally, the hydrogen bond between hFDH and Aβ of the simulated Aβ/hFDH complex was further analyzed using the PyMOL 1.7 software.
2.15. Liquid chromatography-tandem with mass spectrometry for the identification of the disulfide bond formation in Aβ/hFDH complexes
Human FDH (0.29 μg/μL) in 10 mM sodium phosphate buffer (pH 7.5, buffer A) was treated with Aβ42 for 24 hours. The protein samples were then digested with chymotrypsin or trypsin (Roche Diagnostics, Indianapolis, IN) at an enzyme-to-substrate ratio of 1:40 (w/w) in 100-μL NH4HCO3 buffer at 37°C overnight. To map the interpeptide disulfide linkage, the chymotryptic digestion mixture was separated using high-performance liquid chromatography and the fraction containing the disulfide-linked peptide was reduced with 20 mM dithiothreitol (DTT) at 56°C for 30 min and alkylated with 50 mM N-ethylmaleimide for 30 min. The resulting reaction mixture was then subjected to liquid chromatography-tandem with mass spectrometry analyses as described previously [15].
2.16. Statistical analysis
In the MWM experiment, measures of performance during acquisition trials (i.e., escape latency) were averaged for each day for each animal. To determine the difference between different days, data were analyzed using repeated-measures analysis of variance, with day as a within-subjects factor and treatment as a between-subjects factor. The difference between the treatment groups within each day were analyzed with one-way analysis of variance, and Fisher's least significant difference was used for post hoc comparisons. SPSS 16.0 (SPSS Inc., Chicago, IL, USA) was used for all analyses. For other experiments, statistical significance was determined by means of Student's t-test (for independent or dependent samples, as appropriate) with P < .05 (two-tailed) considered to be statistically significant. All data are reported as mean ± standard errors.
3. Results
3.1. Red light at 630 nm smashes Aβ deposition associated with the least heating effects
To avoid the heat-induced headache or hemorrhage induced by light irradiation in clinical trials, we used a 1-cm bone (equal to the thickness of human skull) to mimic human head treated by phototherapy with 2-cm distance and compared the heating effects of low levels of laser light at 630, 680, and 810 nm for 40 minutes in a sealed box (Fig. 1A). Near-infrared (NIR) or red light (RL) over 650 nm has a strong side effect “heating effect,” [23,24] and sometimes resulted in headache, sleep disturbances, and insomnia [25]. We found that 40-minute illumination of 680 and 810 nm elevated the temperature of bone from 37°C to ~38 and ~40°C, respectively, which was approached to the temperature at which a high fever occurs (Fig. 1B). Therefore, 630-nm RL of LED was selected to apply for phototherapy on AD mice in this study.
Fig. 1.

Two-month LED-RL treatment reduces Aβ deposition associated with low heating effects. (A) Detection of the heating effects on 1-cm bone illuminated by low levels of laser light at 630, 680, and 810 nm for 40 minutes in a sealed box. (B) The changes in the temperature of bone (n = 3, P < .01). (C, D) Detection of the light penetration ratio into the brain and liver using spectrometer. (E, F) Representative immunohistochemical images of SPs stained with 4G8 antibody (E, brown) and quantification of SPs (F) in the cortex. Scale bar, 500 μm. n = 3–6 sections from 3–4 mice each. Con: wild C57BL/6 mice; AD-4M: 4-month-old APP/PS1 mice; AD-6M: 6-month-old APP/PS1 mice; RL + AD-6M: 6-month-old APP/PS1 mice with 2 months of RL illumination. (G, H) Representative immunohistochemical images of SPs (green) stained by Th S (G) and quantification of SP (H). The data are expressed as the mean ± standard deviation (s.e.m.). **P < .01. Abbreviations: AD, Alzheimer's disease; RL, red light; SP, senile plaque; Th S, thioflavin S.
To investigate whether RL at 630 nm penetrates into the skull and abdomen of mice, LED-RL was applied to illuminate APP/PS1 transgenic mice for consecutive two months, and sunlight lamp was used as a light control. Approximately 49% and 43% of the light penetrated into the mandibular region and liver, respectively (Fig. 1C, D and Supplementary Fig. 1).
Because Aβ deposition in the ECS induced neuron death, we investigate whether vibration photons of RL could prevent or slow down the formation of Aβ-mediated SPs. The AD mice at the age of 4 months were illuminated with LED-RL for consecutive 2 months. The results of staining 4G8 antibody showed that AD mice at 6 months of age exhibited higher levels of plaque formation (5.32 ± 0.23 vs. 3.87 ± 0.14; 3.47 ± 0.16; P < .01) than 4-month-old AD mice (Fig. 1E, F). However, 2 months of LED-RL treatment significantly decreased the numbers of SPs in 6-month-old AD mice (5.32 ± 0.23 vs. 0.7 ± 0.02; P < .01) (Fig. 1E, F).
Using Th-S dye to detect the formation of SP, we found that there was significantly increased numbers of SPs in AD mice at 6 months of age compared with 4-month-old AD mice (from 2.48 ± 0.16 to 4.73 ± 0.24, P < .01) (Fig. 1G, H). However, LED-RL treatment significantly decreased the number of SPs (4.73 ± 0.24 vs. 1.33 ± 0.11; P < .01; Fig. 1G, H). Meanwhile, the sizes of SP were also markedly diminished after LED-RL illumination in 6-month-old AD mice (Fig. 1G). These results indicate that RL treatment reduces age-related SP deposition in vivo.
3.2. Red light at 630 nm reduces aging-associated FA accumulation by activating FDH
Previously, we reported that FA was abnormally accumulated in brains of AD patients and in the brains of AD animal models [17]. FA was found to promote Aβ40 aggregation in vitro [26]. To examine brain FA metabolism in AD mice, a FA fluorescence probe, RFAP-1, was used to image the levels of FA using an in vivo animal imaging system [16] (Fig. 2A–C). After 2 months of LED-RL treatment, FA fluorescence intensity in the whole brain of 6-month-old AD mice was significantly reduced (from 189.32 % to 121.67 %; P < .01) (Fig. 2D, E). To confirm aforementioned results, FA concentrations were further quantified by high-performance liquid chromatography with a fluorescence detector. LED-RL treatment decreased brain FA levels in both the brain and liver of AD mice (n = 6, P < .01) (Fig. 2F and Supplementary Fig. 2A). We selected liver to be illuminated because FDH is widely distributed in the liver and rapidly functionally degrades FA [27]. FDH activity was markedly reduced in 6-month-old AD mice compared with 4-month-old AD mice; however, LED-RL treatment significantly increased FDH activity in the brain and liver of these AD mice (n = 6, P < .01; Fig. 2G and Supplementary Fig. 2B). Notably, brain FA levels were positively correlated with the numbers of Aβ plaques (Fig. 2H). These data suggest that LED-RL illumination enhances FA metabolism and reduces Aβ deposition.
Fig. 2.

Two-month LED-RL treatment decreases FA accumulation in APP/PS1 mice. A–E. Representative in vivo animal images with the FA fluorescence probe RFAP-1 (A) by computed tomography (CT) (B) or fluorescence photography (C) and quantification of the brain FA fluorescence (D, E) images. n = 6 mice each. Con: wild C57BL/6 mice; AD-4M: 4-month-old APP/PS1 mice; AD-6M: 6-month-old APP/PS1 mice; RL + AD-6M: 6-month-old APP/PS1 mice with 2 months of RL illumination. (F) Quantitative assessment of brain FA levels in the brain detected by high-performance liquid chromatography (HPLC), n = 8. (G) Quantitative results of brain FDH activity analyzed using the FDH kit, n = 8. (H) A positive relationship between FA level and plaque number in the cortex. The data are expressed as the mean ± standard deviation (s.e.m.). **P < .01. Abbreviations: FA, formaldehyde; FDH, formaldehyde dehydrogenase; RL, red light.
3.3. Red light at 630 nm activates FDH by dissociating Aβ-binding with FDH
Our aforementioned data indicated that the higher FA levels were associated with the more numbers of Aβ plaques in the brains, suggesting that Aβ most likely disturbs FA metabolism. FDH inactivity leads to FA accumulation [28,29]; we speculated that Aβ42 inhibits hFDH activity. To investigate whether Aβ directly inactivates FDH and leads to FA generation, Aβ42 at different concentrations were added into the culture medium of N2a cells. We found that RL at 630 nm could improve FDH activity in N2a cells (Fig. 3A), which was also our previous study of FDH in the pure protein solutions [15]. However, Aβ incubation induced a dose-dependent FDH inactivity and FA accumulation intracellularly; as expected, LED-RL treatment reversed Aβ-inhibited FDH activity (n = 6, P < .01) (Fig. 3A, B). Thus, Aβ42 may directly inhibit FDH activity.
Fig. 3.

LED-RL treatment reverses Aβ-binding with FDH and improves FDH activity in the pure FDH solutions. (A) Quantitative assessment of FDH activity in the cultured N2a cells analyzed by ELISA; n = 8. (B) Quantitative results of intracellular FA content detected by HPLC; n = 8. (C) The crystal structure of cysteine residues binding with catalytic and structural Zn2+ (PDB: 1M5C). (D) ASP1 (D, yellow) residue of Aβ42 was connected with the GLN96 (Q, purple) residue of hFDH simulated by molecular simulation. (E) Aβ42-induced model of disulfide bond formation between CYS97 and CYS100 residues of hFDH. (F, G) Quantitative assessment of the modification in CYS97, CYS100, and CYS111 of hFDH detected by liquid chromatography-tandem with mass spectrometry (LC-MS/MS). -SH represents free cysteines; MTHIO labeling indicates reversible modifications, and SOxH represents irreversible oxidative modifications. (H) The model of LED-RL disassembly of the Aβ/FDH complex. The data are expressed as the mean ± standard deviation (s.e.m.). **P < .01. Abbreviations: LED-RL, light-emitting diode with red light; FDH, formaldehyde dehydrogenase; RL, red light.
To test aforementioned speculation, we simulated the structure of Aβ42-binding with FDH. The three-dimensional crystal structure of hFDH showed that the cysteine 45 (CYS45) residue bound to catalytic Zn2+ and that CYS97, CYS100, CYS103, and CYS111 residues were connected to structural Zn2+ (Fig. 3C). The simulated Aβ42-hFDH complex showed a hydrogen bond formation between ASP1 (D, yellow) of Aβ42 and GLN96 (Q, purple) of hFDH. GLN96 was connected with CYS97/CYS100 of hFDH (Fig. 3D, Supplementary Fig. 3 and Supplementary Table 1). The results suggest that Aβ42 binding GLN96 led to disulfide (S-S) bond formation between CYS97 and CYS100 (Fig. 3E).
To identify the simulated results, we extracted and purified hFDH as our previous report [15]. Using the liquid chromatography-tandem mass spectrometry, we found that Aβ42 increased S-S bond formation between CYS97 and CYS100 by ~1.4% (Fig. 3F) but reduced S-S bond formation between CYS103 and CSY111 by ~5.9% (Fig. 3G and Supplementary Tables 2–5). CYS111 is connected with catalytic ARG115, which is essential for FDH activity [30]. These data indicate that the breakage of S-S bonds between CYS103 and CSY111 induced by Aβ42 leads to the dissociation of catalytic ARG115, which then inactivates hFDH. However, LED-RL illumination reduced Aβ42-induced formation of S-S bonds between CYS97 and CYS100 and partially rescued S-S bond formation between CYS103 and CYS111 of hFDH (Fig. 3F–H). These data indicate that 630-nm RL could reverse Aβ-inactivated FDH.
3.4. Red light at 630 nm reduces FA-promoted Aβ deposition in vitro and in vivo
To address whether FA directly facilities Aβ aggregation and SP formation, FA at different concentrations was added into the solutions of pure Aβ. We found that incubation of FA with Aβ for 48 hours induced a dose-dependent increase in Aβ fibril formation as assessed by transmission electron microscopy (Fig. 4A). However, LED-RL treatment degraded Aβ fibrils in vitro (Fig. 4B).
Fig. 4.

LED-RL illumination prevents FA-facilitated Aβ deposition in vitro and in vivo. (A, B) Representative transmission electron microscope images depicting Aβ fibril formation without (A) or with (B) LED-RL treatment. Scale bar, 2 μm. (C) The theoretically simulated model of FA-binding with Aβ42 at 18 valine (18V, purple), 19 phenylalanine (19F, cyan), and 22 glutamic acid (22E, blue) by three H-bonds (yellow line). (D) Quantitative assessment of FA-induced Aβ42 aggregation examined by thioflavin T (TH T) dye; n = 6 for each sample. (E–H) Representative immunohistochemical images stained with an antibody against 4G8 (E) or by thioflavin S (Th S) (G) and quantification of brain senile plaque formation (F, H) in the hippocampus and cortex of these four groups of mice, respectively. Con: Wild-type mice; AD: APP/PS1 mice; (AD + FA): APP/PS1 mice injected with FA; (RL + AD + FA): AD mice injected with FA and illuminated with red light. Scale bar, 500 μm. n = 3–6 sections from 3–4 mice each. The data are expressed as the mean ± standard deviation (s.e.m.). **P < .01. Abbreviations: LED-RL, light-emitting diode with red light; FDH, formaldehyde dehydrogenase; RL, red light.
To explore the mechanism underlying FA-enhanced Aβ assembly, the FA-Aβ binding structure was simulated. The three-dimensional crystal structure of Aβ (PDB ID: 1ZOQ) was obtained from PubMed. We found that FA was bound with the residues of valine 18 (18V, purple), phenylalanine 19 (19F, cyan), and glutamic acid 22 (22E, blue) by three H-bonds (yellow line) (Fig. 4C). The mutation in residue 22 from glutamic acid (E) to proline (P) is known to lead to a marked increase in Aβ aggregation [31] and suggests that the site of 22E is a critical residue for determining Aβ assembly. Theoretically, FA-binding with 22E could enhance Aβ aggregation.
Moreover, to examine the structures of β-sheets of FA-induced Aβ aggregation, the solutions of Aβ or Aβ mixed with FA were added with Thioflavin T (Th T) dye. We found that LED-RL illumination before and after FA incubation in Aβ solution had the same effects on degrading Aβ β-sheet formation (n = 6, P < .01; Fig. 4D). These data again confirm that FA accelerates Aβ aggregation.
To examine whether FA directly enhances Aβ aggregation in vivo, 4G8 antibody and Th S staining were used to detect neuritic plaques, respectively. The results showed that FA injection significantly increased numbers of SP in AD mouse brains compared with non-FA injection AD mice (from 8.78 ± 1.02 to 16.79 ± 2.41, P < .01; Fig. 4E–H). However, LED-RL treatment significantly decreased the number of SPs (16.79 ± 2.41 vs. 4.33 ± 1.12; P < .01; Fig. 4E–H). Thus, the vibration photons could reduce Aβ aggregation outside of neurons in the cortex.
3.5. Red light at 630 nm smashes Aβ deposition in the ECS and rescues neuron death
To examine the effects of Aβ and LED-RL on the volume of ECS outside of neurons in the cortex, the changes in ECS were used to quantify with double-staining method with Th S (staining SP green) and 4′,6-diamidino-2-phenylindole (a nuclear dye). The results showed that AD mice exhibited a larger ECS volume, which was associated with greater numbers of SPs located in the ECS and less neurons in the cortex than that in wild-type (WT) mice (Fig. 5A). Interestingly, after 2 months of LED-RL irradiation, the sizes and numbers of SPs were markedly decreased; meanwhile, the numbers of neurons around SPs were increased in AD mice (Fig. 5A).
Fig. 5.

Two-month LED-RL treatment reduces Aβ-blocked ECS and neuron death. (A) Representative immunohistochemical images of the ECS stained with thioflavin S for senile plaques (green) and with the nuclear stain 4′,6-diamidino-2-phenylindole (DAPI; blue); n = 3–6 sections from 3–4 mice each. Scale bar, 25 μm. (B) Representative immunohistochemical images of the ECS stained with 4G8 antibody for senile plaques (brown) and with hematoxylin-eosin for nuclear acid (purple) in the cortex; n = 3–6 sections from 3–4 mice each. Scale bar, 25 μm. (C) Experimental flow chart of MRI for WT mice, APP/PS1 mice (AD), and AD mice illuminated with red light (RL + AD). (D) The Gd-DTPA signal (white, indicated by pinkish red arrow) representing ISF flowed from CN to V3 in the brains of mice was visualized by tracer-based magnetic resonance imaging (MRI) for consecutive 4 hours. (E) The model of ISF-CSF cycle: The interstitial fluid (ISF, red) flows from the prefrontal cortex, CN, to the third ventricle (V3) and poured into the cerebrospinal fluid (CSF, blue). Finally, CSF was flowed into nasal lymphatics (NL) where the substances were exchanged with blood. F-H. Quantification of the local diffusion rate (F), half-life (G) and tortuosity (H) of ISF flow from the cortex into the cerebrospinal fluid (CSF), n = 3 per group. The data are expressed as the mean ± standard deviation (s.e.m.). **P < .01. Abbreviations: CN, caudate nucleus; ECS, extracellular space; MRI, magnetic resonance imaging; WT, wild type.
To test the relationship between SPs and cortical neuron death, we used another double-staining method with hematoxylin-eosin dye (dyeing nucleic acid to purple) and antibody-4G8 (staining SP to brown). The results showed that AD mice had large-sized SP (brown) between two cortical neurons associated with neuronal death (a karyopyknosis in the neurons, purple) that were not evident in WT mice (Fig. 5B). However, after 2 months of LED-RL treatment, the morphology of neurons was recovered to normal fusiform in AD mice (Fig. 5B). Thus, vibration photons could rescue neuron viability.
To observe the changes in the ECS of the cortex in the mice after 2 months of RL illumination, a probe of gadolinium-diethylenetriamine pentaacetic acid (Gd-DTPA) was injected into the caudate nucleus in the prefrontal lobe and then examined by a real-time monitoring system of magnetic resonance imaging for consecutive 4 hours (Fig. 5C). This imaging technique is based on the principle that free water molecules labeled by Gd-DTPA display high signals in the ISF. When Gd-DTPA spreads into the ECS, it is accompanied by a gradual decrease in the signal intensity and an increase in the distribution area [32]. In this study, AD mice showed a slower velocity of Gd-DTPA diffusion than WT mice, as the white signal (red arrow) in the brains was still detectable at 4th hour imaged by magnetic resonance imaging. However, RL illumination improved the Gd-DTPA diffusion, as the Gd-DTPA signal was disappeared in the group of AD with LED-RL treatment (RL + AD) at 4th hour, similar to the WT mice (Fig. 5D). This result indicates that Gd-DTPA is directionally diffused from the superficial cortex- caudate nucleus into the deep brain- the 3th ventricle (V3) (Fig. 5E), which is consistent with previous report [32].
To further quantify the dynamic changes in the ECS of the brains, we compared the critical parameters- local diffusion rate (D#), half-life of Gd-DTPA (t1/2,) and tortuosity (λ). Compared with WT mice, AD mice had a slower local diffusion rate (2.19 ± 0.14 vs. 3.01 ± 0.03, n = 3, P < .01), a longer half-life of Gd-DTPA (55.83 ± 8.58 vs. 18.43 ± 1.56, n = 3, P < .01), and a larger tortuosity (2.20 ± 0.06 vs. 1.88 ± 0.039, n = 3, P < .01) (Fig. 5F–H). However, after 2 months of RL treatment, AD mice exhibited a higher local diffusion rate (2.84 ± 0.043 vs. 2.19 ± 0.14, n = 3, P < .01), a shorter half-life of Gd-DTPA (23.31 ± 3.66 vs. 55.83 ± 8.58, n = 3, P < .01), and a smaller tortuosity (1.75 ± 0.05 vs. 2.20, n = 3, P < .01) than AD mice without LED-RL treatment (Fig. 5F–H). These data demonstrate that vibration photons could scavenge Aβ-blocked ECS, which may be contributes to the rescue of ISF flow.
3.6. Red light at 630 nm recovers Aβ-obstructed ISF flow and alleviates memory deficits
A smooth flow of ISF in the ECS is required for maintaining brain functions [5], we speculated that vibration photons-smashes SP in the ECS might improve ISF flow and cognitive functions. Since free water molecules labeled by Gd-DTPA display high signals in the ISF [32], we examined the changes in the speed of ISF flow by magnetic resonance imaging. The results showed that Gd-DTPA in WT mice diffused more intensively and rapidly than in AD mice in the maximum and next sagittal continuous layer of the frontal cortex; this was based on the fact that it had a shorter half-time of Gd-DTPA (P < .01). These data indicated that Aβ indeed obstructs ISF flow from the superficial to the deep cortex (vertical direction), and it pushes ISF diffusion around neurons (horizontal direction) (Fig. 6A, B). However, AD mice treated with LED-RL exhibited a more intensive and rapid diffusion than AD mice without RL illumination because the half-time was markedly reduced in the former compared with the latter (P < .01), indicating that scavenging Aβ-blocked ECS could recover ISF flow from the superficial to deep cortex (vertical direction), (Fig. 6B, C). Hence, Aβ-obstructed ISF flow could induce neuron death in the deep cortex.
Fig. 6.

Two-month LED-RL treatment rescues Aβ-obstructed ISF and memory functions. (A–C) The changes in the flow of ISF imaged by in vivo tracer-based MRI was calculated as the tracer's abnormal diffusion and distribution in the maximum and next sagittal continuous layer of the frontal cortex of WT mice (A), a group of 6-month-old APP/PS1 mice without RL illumination (AD) (B), and another group of 6-month-old APP/PS1 mice after two-month RL illumination (RL + AD) (C), respectively. The flow maps of ISF in the cortex in these three kinds of mice were showed at the bottom. (D) Quantitative assessment of escape latencies in mice assayed by the Morris water maze with or without two-month RL illumination (n = 10, per group). (E, F) Representative swim time (E) and distances (F) spent per quadrant during the Morris water maze test. n = 10. (G) A negative relationship between time in target quadrant and the half-time of Gd-DTPA diffusion in the ECS. The data are expressed as the mean ± standard deviation (s.e.m.). **P < .01. Abbreviations: 6M, 6 months; AD, Alzheimer's disease; ECS, extracellular space; ISF, interstitial fluid; MRI, magnetic resonance imaging; LED-RL, light-emitting diode with red light; WT, wild type.
To address whether vibration photon–rescued ISF flow contributes to memory improvement in the AD mice model, the MWM test was performed to investigate the behaviors of spatial memory. We found that 4-month-old AD mice without LED-RL treatment exhibited longer escape latency and shorter time in target quadrant than WT mice. However, one-month of LED-RL treatment on APP/PSI mice slightly improved the ability of spatial learning compared with AD mice without treatments (n = 10, P > .05, Supplementary Fig. 4). Notably, the results of the MWM test revealed a significant effect of treatment—day 3 (F (2, 27) = 8.34, P = .005), day 4 (F (2, 27) = 10.51, P = .001), day 5 (F (2, 27) = 6.79, P = .002), and day 6 (F (2, 27) = 8.91, P = .002), indicating that 2-month LED-RL treatment rescued the ability of spatial learning in AD mice (Fig. 6D). In the probe trial on the last day of testing, LED-RL treatment significantly improved the ability of spatial recall in the AD mice, as these mice spent more time and traveled further distances when searching for the platform in the third quadrant where the platform had been removed (P < .01, Fig. 6E, F). In addition, we found that there was a negative relationship between time in target quadrant and the half-time (t1/2) of Gd-DTPA. This result suggests that Aβ-obstructed ISF flow contributes neuron death and memory deficits; however, LED-RL could enhance ISF flow and cognition.
4. Discussion
In the present study, we found that Aβ induced FDH inactivity and FA accumulation; FA in turn accelerated Aβ-mediated ECS blockage and ISF disorders. However, vibration photons from LED-RL at 630 nm smashed Aβ deposition in the ECS and improved FDH activity, which led to FA degradation, recovered ISF flow, and reversed memory deficits in the AD animal model. Hence, this phototherapy may be potentially used to treat patients with AD (Fig. 7).
Fig. 7.

The mechanism of that 630-nm red light recovers Aβ-obstructed ISF and ameliorates cognitive deficiency in Alzheimer's disease by smashing Aβ-blocked ECS. Briefly, RL at 630 nm not only directly destroyed Aβ-mediated SP but also activated FDH and degraded FA to reduce FA-facilitated Aβ deposition in the ECS of cortex. Subsequently, it could recover ISF flow and reverse memory deficits in AD model mice. Abbreviations: AD, Alzheimer's disease; SP, senile plaques (brown); the smashed SP (white star); RL, red light; ECS, extracellular space; ISF, interstitial fluid (red line); FA, formaldehyde; FDH, formaldehyde dehydrogenase. The live neuron (blue), the apoptotic neuron (purple), and the dead neuron (gray).
Recently, photobiomodulation with NIR light at 600–1070 nm has been rapidly developed to the treatment of patients with AD [33] and traumatic brain injury [34]. Interestingly, NIR treatment can reduce the size and number of Aβ plaques in APP/PS1 mice and improve cognitive function in patients with dementia [35]. However, NIR or RL over 650 nm has been found to induce a strong side effect “heating effect” (the temperature of bone is over 38°C, i.e., fever) [24], which may be potentially related to headache or hemorrhage in patients with AD. In fact, some side effects of NIR have been reported in clinic, such as irritability, headache, eye strain, sleep disturbances, and insomnia [25]. In the present study, we also found that 40-minute illumination of 680 and 810 nm elevated the temperature of 1-cm bone in a sealed box; therefore, 630-nm RL without heating effect was selected for phototherapy on AD mice.
An interaction between FA-promoted Aβ assembly and Aβ-inactivated FDH was investigated in this study. There was a vicious circle between FA generation and Aβ deposition. In agreement with this finding, excess FA has been observed in the brains of Aβ-related AD transgenic mice and also in postmortem hippocampi from patients with AD [17]. FA itself also directly facilitated Aβ deposition in the ECS. In addition, brain aging processes lead to reduced FDH expression and therefore increased FA accumulation [28,29]. Excess FA can directly induce mitochondrial toxicity [36,37], tau hyperphosphorylation, neuronal fibril tangle formation [38], and spatial memory deficits in WT mice [17]. These data indicate that FA elicited both Aβ-dependent and Aβ-independent neurotoxicity, suggesting that scavenging FA should be taken into account for developing AD drugs for Aβ clearage.
The exchange between ISF flow in the ECS and ISF–cerebrospinal fluid (CSF) in the superficial cortex has been widely explored [39,40]. The blockage of ECS in the cortex has been found to induce the accumulation of ISF in the deep brain [32]. This accumulation manifests as a slight decline in ISF flow velocity, which leads to a marked increase in the volume fraction [41]. Obstruction of the superficial cortical ECS blocks ISF flow from the superficial to the deep brain. Notably, the ISF flow of brain tissue and the CSF bathing the central neuronal system are integral to the lymphatic system to carry out waste clearance and medicine delivery (Fig. 5E) [42]. This is inevitable that the less neuroactive substances reached their target receptors in the membrane of neurons leading to the slower formation of memory information, if ISF flow is obstructed [4]. ISF flow and CSF play a critical pathological role in the onset of AD [43]. In this study, Aβ deposition in the ECS directly blocked ISF flow from the superficial cortex-caudate nucleus into the deep brain, to V3 and then disturbed the ISF-CSF cycle between the cortex and hippocampus in AD mice. Notably, LED-RL illumination reversed these effects. Our findings provide direct evidence that Aβ-blocked ISF flow contributes to the onset of AD. These findings also provide a plausible explanation for the failure of medicine delivery into the deep brain for the treatment of AD in recent decades.
RL at 630 nm is widely used in traffic lights because the human eye is substantially sensitive to 630-nm RL [44]. FDH (also named ADH3) is distributed in the retina [45] and transfers retinol to the retina, which is required for visual sensation [46]. In fact, our previous study had found that FDH in hippocampal neurons was sensitive to 630-nm RL [15]. The phototherapy using low-level laser lights is able to break the secondary structure of Aβ in vitro [14]. In this study, LED-RL illumination not only directly reduced Aβ-mediated ECS blockage but also enhanced FDH activity and attenuated FA-facilitated Aβ toxicity. Equally important, LED-RL could inhibit the phosphorylated tau-related molecular pathway quantified by antibody p-tau181, PP2A, and GSK-3β, increased microtubule-associated protein (MAP)-2 immunoreactivity, and reduced GFAP-positive reactive astrocytes and CD45-positive reactive microglia (Supplementary Material and Supplementary Fig. 5A–I). Subsequently, phototherapy reversed memory deficits in APP/PS1 mice. More importantly, we also found that LED-RL at 630 nm had a strong penetration rate into the human cortex (approximately 48%; Supplementary Fig. 6).
In summary, this phototherapy of LED-RL reduces Aβ-obstructed ISF flow by smashing Aβ deposition in the ECS and thereby reverses cognitive deficits in an AD mouse model. This finding offers a promising opportunity to translate into treatments for patients with AD.
Research in context.
-
1.
Systematic review: The literature was reviewed using PubMed and abstracts and presentations at national meetings, including those of the Society for Neuroscience and the Society for Research on the therapeutic effects of light in Alzheimer's disease (AD). Relevant articles are cited appropriately.
-
2.
Interpretation: Review of the literature revealed that AD is associated with Aβ aggregation in the extracellular space (ECS) of cortex and Aβ indeed impairs cognition. A smooth flow of interstitial fluid (ISF) in the ECS is required for maintaining brain functions. However, pharmacological therapies to treat AD targeting Aβ have failed over 100 years. Low levels of laser light can disassemble Aβ. These findings led to the hypothesis that light-smashed Aβ in the ECS would recover ISF flow and attenuate memory deficits in an AD mouse model. Treatment with 630-nm red light could degrade Aβ deposition and rescue cognitive functions. Therefore, the current work opens a promising opportunity to translate the findings presented here into AD patient treatment.
-
3.
Future directions: To further test the hypothesis, several directions for further studies are proposed, including further exploring (1) Whether red light enhances medicine delivery or not? (2) Which is the most suitable size for medicines penetrating into the ECS? and (3) Whether red light combined with medicines improves cognition or not.
Acknowledgments
The authors thank Prof. Lei Liu of Capital Medical University for his comments and Prof. Christopher J. Chang of University of California for kindly providing the RFAP-1 probe. This work was supported by the Beijing Brain Initiative of Beijing Municipal Science & Technology Commission Z181100001518104; the NSFC 61625102, 61827810, and 81571044 and HTRDC 2016YFC1305903 and 2016YFC1306302; 973 Program, 2015CB856402; the Beijing Natural Science Foundation of China 7172022; the Scientific Research Common Program of Beijing Municipal Commission of Education KM201510025014; and the Major Projects Fund of Beijing Institute for Brain Disorders ZD2015-08, China. W.S. was the holder of the Tier 1 Canada Research Chair in Alzheimer's Disease. Y.Z. is the recipient of Michael Smith Foundation for Health Research Post-Doctoral Fellowship Award.
Author contributions: H.H. and Z.T. conceived the study. W.S., H.H., and Z.T. designed the study and supervised all analyses. XY, YZ, WS, and ZT wrote the manuscript. R.H. and B.S. contributed to study design and experiments. X.Y., Y.M., H.L., L.A., Y.L., C.D., G.G., H.Y., B.S., and R.L., performed experiments. H.H. and Z.T. performed the data analyses. All authors reviewed the manuscript.
Footnotes
The authors declare that they have no competing financial interests.
Supplementary data related to this article can be found at https://doi.org/10.1016/j.trci.2019.09.007.
Contributor Information
Weihong Song, Email: weihong@mail.ubc.ca.
Hongbin Han, Email: hanhongbin@bjmu.edu.cn.
Zhiqian Tong, Email: tzqbeida@ccmu.edu.cn.
Supplementary Data
References
- 1.Sykova E., Nicholson C. Diffusion in brain extracellular space. Physiol Rev. 2008;88:1277–1340. doi: 10.1152/physrev.00027.2007. [DOI] [PMC free article] [PubMed] [Google Scholar]
- 2.Cserr H.F., DePasquale M., Nicholson C., Patlak C.S., Pettigrew K.D., Rice M.E. Extracellular volume decreases while cell volume is maintained by ion uptake in rat brain during acute hypernatremia. J Physiol. 1991;442:277–295. doi: 10.1113/jphysiol.1991.sp018793. [DOI] [PMC free article] [PubMed] [Google Scholar]
- 3.Metzler-Baddeley C., Jones D.K., Belaroussi B., Aggleton J.P., O'Sullivan M.J. Frontotemporal connections in episodic memory and aging: a diffusion MRI tractography study. J Neurosci. 2011;31:13236–13245. doi: 10.1523/JNEUROSCI.2317-11.2011. [DOI] [PMC free article] [PubMed] [Google Scholar]
- 4.Dityatev A., Schachner M., Sonderegger P. The dual role of the extracellular matrix in synaptic plasticity and homeostasis. Nat Rev Neurosci. 2010;11:735–746. doi: 10.1038/nrn2898. [DOI] [PubMed] [Google Scholar]
- 5.Xie L., Kang H., Xu Q., Chen M.J., Liao Y., Thiyagarajan M. Sleep drives metabolite clearance from the adult brain. Science. 2013;342:373–377. doi: 10.1126/science.1241224. [DOI] [PMC free article] [PubMed] [Google Scholar]
- 6.Lehmenkuhler A., Sykova E., Svoboda J., Zilles K., Nicholson C. Extracellular space parameters in the rat neocortex and subcortical white matter during postnatal development determined by diffusion analysis. Neuroscience. 1993;55:339–351. doi: 10.1016/0306-4522(93)90503-8. [DOI] [PubMed] [Google Scholar]
- 7.Berezin V., Walmod P.S., Filippov M., Dityatev A. Targeting of ECM molecules and their metabolizing enzymes and receptors for the treatment of CNS diseases. Prog Brain Res. 2014;214:353–388. doi: 10.1016/B978-0-444-63486-3.00015-3. [DOI] [PubMed] [Google Scholar]
- 8.Ly P.T., Wu Y., Zou H., Wang R., Zhou W., Kinoshita A. Inhibition of GSK3beta-mediated BACE1 expression reduces Alzheimer-associated phenotypes. J Clin Invest. 2013;123:224–235. doi: 10.1172/JCI64516. [DOI] [PMC free article] [PubMed] [Google Scholar]
- 9.Zhang Y., Song W. Islet amyloid polypeptide: another key molecule in Alzheimer's pathogenesis? Prog Neurobiol. 2017;153:100–120. doi: 10.1016/j.pneurobio.2017.03.001. [DOI] [PubMed] [Google Scholar]
- 10.Zhang S., Cai F., Wu Y., Bozorgmehr T., Wang Z., Zhang S. A presenilin-1 mutation causes Alzheimer disease without affecting Notch signaling. Mol Psychiatry. 2018 doi: 10.1038/s41380-018-0101-x. [Epub ahead of print] [DOI] [PubMed] [Google Scholar]
- 11.Zhang S., Wang Z., Cai F., Zhang M., Wu Y., Zhang J. BACE1 cleavage site selection critical for amyloidogenesis and Alzheimer’s pathogenesis. J Neurosci. 2017;37:6915–6925. doi: 10.1523/JNEUROSCI.0340-17.2017. [DOI] [PMC free article] [PubMed] [Google Scholar]
- 12.Cummings J., Lee G., Ritter A., Zhong K. Alzheimer's disease drug development pipeline: 2018. Alzheimers Dement (N Y) 2018;4:195–214. doi: 10.1016/j.trci.2018.03.009. [DOI] [PMC free article] [PubMed] [Google Scholar]
- 13.Sykova E., Vorisek I., Antonova T., Mazel T., Meyer-Luehmann M., Jucker M. Changes in extracellular space size and geometry in APP23 transgenic mice: a model of Alzheimer’s disease. Proc Natl Acad Sci U S A. 2005;102:479–484. doi: 10.1073/pnas.0408235102. [DOI] [PMC free article] [PubMed] [Google Scholar]
- 14.Son G., Lee B.I., Chung Y.J., Park C.B. Light-triggered dissociation of self-assembled beta-amyloid aggregates into small, nontoxic fragments by ruthenium (II) complex. Acta Biomater. 2018;36:147–155. doi: 10.1016/j.actbio.2017.11.048. [DOI] [PubMed] [Google Scholar]
- 15.Zhang J., Yue X., Luo H., Jiang W., Mei Y., Ai L. Illumination with 630 nm red light reduces oxidative stress and restores memory by photo-activating catalase and formaldehyde dehydrogenase in SAMP8 mice. Antioxid Redox Signal. 2018;30:1432–1449. doi: 10.1089/ars.2018.7520. [DOI] [PubMed] [Google Scholar]
- 16.Brewer T.F., Chang C.J. An Aza-cope reactivity-based fluorescent probe for imaging formaldehyde in living cells. J Am Chem Soc. 2015;137:10886–10889. doi: 10.1021/jacs.5b05340. [DOI] [PubMed] [Google Scholar]
- 17.Tong Z., Zhang J., Luo W., Wang W., Li F., Li H. Urine formaldehyde level is inversely correlated to mini mental state examination scores in senile dementia. Neurobiol Aging. 2011;32:31–42. doi: 10.1016/j.neurobiolaging.2009.07.013. [DOI] [PubMed] [Google Scholar]
- 18.Ly P.T., Cai F., Song W. Detection of neuritic plaques in Alzheimer's disease mouse model. J Vis Exp. 2011;53:2831. doi: 10.3791/2831. [DOI] [PMC free article] [PubMed] [Google Scholar]
- 19.Tjernberg L.O., Callaway D.J., Tjernberg A., Hahne S., Lilliehöök C., Terenius L. A molecular model of Alzheimer amyloid beta-peptide fibril formation. J Biol Chem. 1999;274:12619–12625. doi: 10.1074/jbc.274.18.12619. [DOI] [PubMed] [Google Scholar]
- 20.Luo W., Li H., Zhang Y., Ang C.Y. Determination of formaldehyde in blood plasma by high-performance liquid chromatography with fluorescence detection. J Chromatogr B Biomed Sci Appl. 2001;753:253–257. doi: 10.1016/s0378-4347(00)00552-1. [DOI] [PubMed] [Google Scholar]
- 21.Tong Z., Han C., Luo W., Li H., Luo H., Qiang M. Aging-associated excess formaldehyde leads to spatial memory deficits. Sci Rep. 2013;3:1807. doi: 10.1038/srep01807. [DOI] [PMC free article] [PubMed] [Google Scholar]
- 22.Godoy L., Gonzàlez-Duarte R., Albalat R. S-Nitrosogluthathione reductase activity of amphioxus ADH3: insights into the nitric oxide metabolism. Int J Biol Sci. 2006;2:117–124. doi: 10.7150/ijbs.2.117. [DOI] [PMC free article] [PubMed] [Google Scholar]
- 23.Ayrapetyan S. The role of cell hydration in realization of biological effects of non-ionizing radiation (NIR) Electromagn Biol Med. 2015;34:197–210. doi: 10.3109/15368378.2015.1076443. [DOI] [PubMed] [Google Scholar]
- 24.Henderson T.A., Morries L.D. Near-infrared photonic energy penetration: can infrared phototherapy effectively reach the human brain? Neuropsychiatr Dis Treat. 2015;11:2191–2208. doi: 10.2147/NDT.S78182. [DOI] [PMC free article] [PubMed] [Google Scholar]
- 25.Terman M., Terman J.S. Bright light therapy: side effects and benefits across the symptom spectrum. J Clin Psychiatry. 1999;60:799–808. [PubMed] [Google Scholar]
- 26.Chen K., Maley J., Yu P.H. Potential inplications of endogenous aldehydes in beta-amyloid misfolding, oligomerization and fibrillogenesis. J Neurochem. 2006;99:1413–1424. doi: 10.1111/j.1471-4159.2006.04181.x. [DOI] [PubMed] [Google Scholar]
- 27.Teng S., Beard K., Pourahmad J., Moridani M., Easson E., Poon R. The formaldehyde metabolic detoxification enzyme systems and molecular cytotoxic mechanism in isolated rat hepatocytes. Chem Biol Interact. 2001;130–132:285–296. doi: 10.1016/s0009-2797(00)00272-6. [DOI] [PubMed] [Google Scholar]
- 28.Qiang M., Xiao R., Su T., Wu B B., Tong Z., Liu Y. A novel mechanism for endogenous formaldehyde elevation in SAMP8 mouse. J Alzheimers Dis. 2014;40:1039–1053. doi: 10.3233/JAD-131595. [DOI] [PubMed] [Google Scholar]
- 29.Mei Y., Jiang C., Wan Y., Lyu J., Jia J., Wang X. Aging-associated formaldehyde-induced norepinephrine deficiency contributes to age-related memory decline. Aging Cell. 2015;14:659–668. doi: 10.1111/acel.12345. [DOI] [PMC free article] [PubMed] [Google Scholar]
- 30.Engeland K., Hoog J.O., Holmquist B., Estonius M., Jornvall H., Vallee B.L. Mutation of Arg-115 of human class III alcohol dehydrogenase: a binding site required for formaldehyde dehydrogenase activity and fatty acid activation. Proc Natl Acad Sci U S A. 1993;90:2491–2494. doi: 10.1073/pnas.90.6.2491. [DOI] [PMC free article] [PubMed] [Google Scholar]
- 31.Morimoto A., Irie K., Murakami K., Masuda Y., Ohigashi H., Nagao M. Analysis of the secondary structure of beta-amyloid (Abeta42) fibrils by systematic proline replacement. J Biol Chem. 2004;279:52781–52788. doi: 10.1074/jbc.M406262200. [DOI] [PubMed] [Google Scholar]
- 32.Teng Z., Wang A., Wang P., Wang R., Wang W., Han H. The effect of aquaporin-4 knockout on interstitial fluid flow and the structure of the extracellular space in the deep brain. Aging Dis. 2018;9:808–816. doi: 10.14336/AD.2017.1115. [DOI] [PMC free article] [PubMed] [Google Scholar]
- 33.Johnstone D.M., Moro C., Stone J., Benabid A.L., Mitrofanis J. Turning on lights to stop neurodegeneration: the potential of near infrared light therapy in Alzheimer's and Parkinson's disease. Front Neurosci. 2015;9:500. doi: 10.3389/fnins.2015.00500. [DOI] [PMC free article] [PubMed] [Google Scholar]
- 34.Dong T., Zhang Q., Hamblin M.R., Wu M.X. Low-level light in combination with metabolic modulators for effective therapy of injured brain. J Cereb Blood Flow Metab. 2015;35:1435–1444. doi: 10.1038/jcbfm.2015.87. [DOI] [PMC free article] [PubMed] [Google Scholar]
- 35.Berman M.H., Halper J.P., Nichols T.W., Jarrett H., Lundy A., Huang J.H. Photobiomodulation with near infrared light helmet in a pilot, placebo controlled clinical trial in dementia patients testing memory and cognition. J Neurol Neurosci. 2017;8:176. doi: 10.21767/2171-6625.1000176. [DOI] [PMC free article] [PubMed] [Google Scholar]
- 36.Tang X.Q., Ren Y.K., Zhou C.F., Yang C.Y., Gu H.F., He J.Q. Hydrogen sulfide prevents formaldehyde-induced neurotoxicity to PC12 cells by attenuation of mitochondrial dysfunction and pro-apoptotic potential. Neurochem Int. 2012;61:16–24. doi: 10.1016/j.neuint.2012.04.011. [DOI] [PubMed] [Google Scholar]
- 37.Tang Y., Kong X., Xu A., Dong B., Lin W. Development of a two-photon fluorescent probe for imaging of endogenous formaldehyde in living tissues. Angew Chem Int Ed Engl. 2016;55:3356–3359. doi: 10.1002/anie.201510373. [DOI] [PubMed] [Google Scholar]
- 38.Lu J., Miao J., Su T., Liu Y., He R. Formaldehyde induces hyperphosphorylation and polymerization of Tau protein both in vitro and in vivo. Biochim Biophys Acta. 2013;1830:4102–4116. doi: 10.1016/j.bbagen.2013.04.028. [DOI] [PubMed] [Google Scholar]
- 39.Iliff J.J., Wang M., Zeppenfeld D.M., Venkataraman A., Plog B.A., Liao Y Y. Cerebral arterial pulsation drives paravascular CSF-interstitial fluid exchange in the murine brain. J Neurosci. 2013;33:18190–18199. doi: 10.1523/JNEUROSCI.1592-13.2013. [DOI] [PMC free article] [PubMed] [Google Scholar]
- 40.Holter K.E., Kehlet B., Devor A., Sejnowski T.J., Dale A.M., Omholt S.W. Interstitial solute transport in 3D reconstructed neuropil occurs by diffusion rather than bulk flow. Proc Natl Acad Sci U S A. 2017;114:9894–9899. doi: 10.1073/pnas.1706942114. [DOI] [PMC free article] [PubMed] [Google Scholar]
- 41.Haj-Yasein N.N., Vindedal G.F., Eilert-Olsen M., Gundersen G.A., Skare Ø., Laake P. Glial-conditional deletion of aquaporin-4 (Aqp4) reduces blood-brain water uptake and confers barrier function on perivascular astrocyte endfeet. Proc Natl Acad Sci U S A. 2011;108:17815–17820. doi: 10.1073/pnas.1110655108. [DOI] [PMC free article] [PubMed] [Google Scholar]
- 42.Abbott N.J., Pizzo M.E., Preston J.E., Janigro D., Thorne R.G. The role of brain barriers in fluid movement in the CNS: is there a 'glymphatic' system? Acta Neuropathol. 2018;135:387–407. doi: 10.1007/s00401-018-1812-4. [DOI] [PubMed] [Google Scholar]
- 43.Weller R.O. Pathology of cerebrospinal fluid and interstitial fluid of the CNS: significance for Alzheimer disease, prion disorders and multiple sclerosis. J Neuropathol Exp Neurol. 1998;57:885–894. doi: 10.1097/00005072-199810000-00001. [DOI] [PubMed] [Google Scholar]
- 44.Wood B., Rea M.S., Plitnick B., Figueiro M.G. Light level and duration of exposure determine the impact of self-luminous tablets on melatonin suppression. Appl Ergon. 2013;44:237–240. doi: 10.1016/j.apergo.2012.07.008. [DOI] [PubMed] [Google Scholar]
- 45.Graymore C.N., Power J., Kissun R.D. Coenzyme dependency of alcohol dehydrogenase in the retina of the rat. III. Effect of light-and dark adaptation on the redox state of the pyridine nucleotides. Exp Eye Res. 1974;19:163–166. doi: 10.1016/0014-4835(74)90032-3. [DOI] [PubMed] [Google Scholar]
- 46.Gonzalez-Duarte R., Albalat R. Merging protein, gene and genomic data: the evolution of the MDR-ADH family. Heredity (Edinb) 2005;95:184–197. doi: 10.1038/sj.hdy.6800723. [DOI] [PubMed] [Google Scholar]
Associated Data
This section collects any data citations, data availability statements, or supplementary materials included in this article.