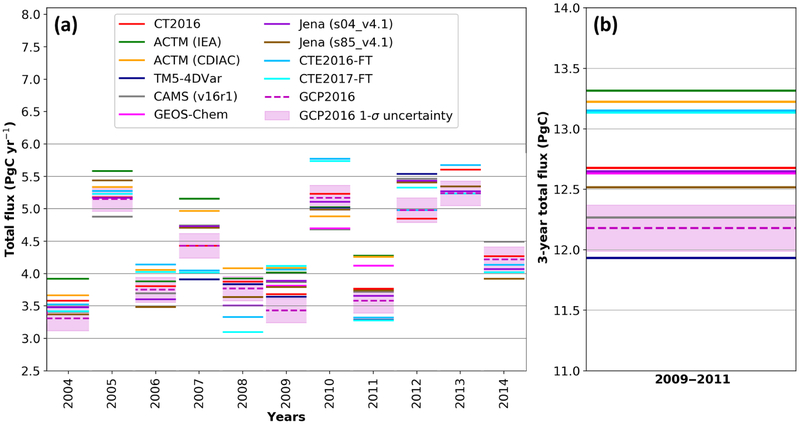
Figure 5.
Modeled total flux (lines), equal to whole-atmosphere growth rate, that is the difference between the global FF emissions and the land and ocean fluxes. Atmospheric growth rate from GCP2016, derived from atmospheric CO2 measurements made in the marine boundary layer by the NOAA ESRL flask network (Masarie and Tans, 1995; Dlugokencky and Tans, 2018) and GCP2016 assigned uncertainty (pink bands). (b) Shows the sum of the total flux for the 3 years (2009 to 2011).

