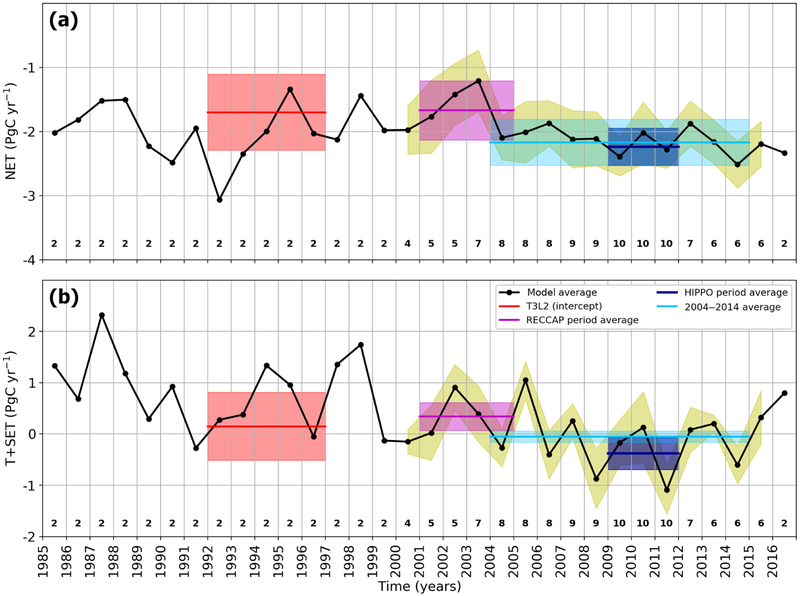
Figure 6.
Time series of annual land fluxes for the NET (a) and the T+SET (b). The black line represents the model mean and standard deviation derived from available simulations; the number of simulations is shown by the numbers below the curve. The standard deviation is shown only if there are more than two model simulations available. Estimates from the specific period (Table 2) are added as multi-year average and standard deviation (shaded area).

