Abstract
Vertical column density (VCD) of nitrogen dioxide (NO2) was measured using Pandora spectrometers at six sites on the Korean Peninsula during the Megacity Air Pollution Studies-Seoul (MAPS-Seoul) campaign from May to June 2015. To estimate the tropospheric NO2 VCD, the stratospheric NO2 VCD from the Ozone Monitoring Instrument (OMI) was subtracted from the total NO2 VCD from Pandora. European Centre for Medium-Range Weather Forecasts (ECMWF) reanalysis wind data was used to analyze variations in tropospheric NO2 VCD caused by wind patterns at each site. The Yonsei/SEO site was found to have the largest tropospheric NO2 VCD (1.49 DU on average) from a statistical analysis of hourly tropospheric NO2 VCD measurements. At rural sites, remarkably low NO2 VCDs were observed. However, a wind field analysis showed that trans-boundary transport and emissions from domestic sources lead to an increase in tropospheric NO2 VCD at NIER/BYI and KMA/AMY, respectively. At urban sites, high NO2 VCD values were observed under conditions of low wind speed, which were influenced by local urban emissions. Tropospheric NO2 VCD at HUFS/Yongin increases under conditions of significant transport from urban area of Seoul according to a correlation analysis that considers the transport time lag. Significant diurnal variations were found at urban sites during the MAPS-Seoul campaign, but not at rural sites, indicating that it is associated with diurnal patterns of NO2 emissions from dense traffic.
Keywords: Pandora, NO2, MAPS-Seoul
INTRODUCTION
Nitrogen dioxide (NO2) is an important chemical species in both tropospheric and stratospheric chemistry (e.g., Crutzen, 1979; Brasseur et al., 1998). NO2 mainly affects air quality in the troposphere through its role in chemical processes with ozone (O3) and other trace gases (e.g., Seinfeld, 1988; Solomon et al., 1999; IPCC, 2007; Choi et al, 2008, 2009). In addition, long-term exposure to high concentrations of NO2 causes respiratory and cardiovascular diseases (e.g., Chitano et al, 1995; Bayram et al, 2001; von Klot et al, 2005). Emission sources of NO2 differ between the troposphere and stratosphere (Lee et al, 1997; Barton and Atwater, 2002; Galloway et al, 2004). In the stratosphere, the main source of NO2 is oxidation of nitrous oxide (N2O) and other sources include lightning and biomass burning (e.g., Liley et al, 2000; Barthe et al, 2007; Allen et al, 2010; Bucsela et al, 2013). In the troposphere, anthropogenic activities, including fossil fuel combustion and vehicle emissions, are the dominant sources of NO2, along with some contributions from soil emissions and lightning (Zhang et al, 2003; Hudman et al, 2007; Choi et al., 2008, 2009). Because of the diversity of nitrogen oxides chemical reactions and emission sources, spatial distributions of NO2 typically show regional differences. For these reasons, accurate observations of the spatial distribution of NO2 are important.
Several measurement platforms for tropospheric gases, including NO2, have been developed in recent decades. In particular, tropospheric column NO2 is widely monitored using ground- and satellite-based platforms that make use of the spectral absorption features of NO2. For example, the Brewer spectrophotometer can estimate total column NO2 using direct solar radiation at several specific wavelengths (e.g., Brewer et al, 1973; Kerr et al, 1988, 1989; Cede et ah, 2006; Diemoz et al, 2014). In addition, several instruments have been used to measure NO2 column densities using differential optical absorption spectroscopy (DOAS) methods (e.g., Boer t al. 2004; Castellanos et al., 2015; Chimot et al., 2016) applied to sunlight scattered along the zenith (Van Roozendael et al., 1997; Liley et al., 2000) or scattered in multiple directions (e.g., Sinreich et al., 2005; Irie et al., 2008; Lee et al., 2009a, b).
Recently, the Pandora spectrometer was developed by Goddard Space Flight Center (GSFC) at the National Aeronautics and Space Administration (NASA) for the estimation of trace gases using direct sunlight (Herman et al., 2009; Cede, 2011). The Pandora system is an array detector spectrometer with a temperature control system. A solar tracking system is also included to allow constant direct-sunlight observations. Using this optical system, the Pandora instrument can continuously observe direct radiance with high temporal resolution. This instrument has been used to obtain the total column amount of trace gases, including O3 and NO2 (Herman et al., 2009; Tzortziou et al., 2012).
In South Korea, the first two Pandora instruments were installed in 2012 at Yonsei University in Seoul and Pusan National University in Busan for trace gas observations during the Distributed Regional Aerosol Gridded Observation Networks-North East Asia (DRAGON NE-Asia) campaign. Since the initial installations, several instruments were installed additionally in different regions in Korea. The main purpose of Pandora network in Korea was to conduct observations for the Megacity Air Pollution Studies-Seoul (MAPS-Seoul; May to June, 2015) and Korea-United States Air Quality Study (KORUS-AQ; May to Ju Korea aimed to monitor and understand air quality aq/content/KORUS-AQ_Science_Overview_0). It also supports planned satellite mission for the Geostationary Environmental Monitoring Spectrometer (GEMS; Kim 2012), designed to study atmospheric chemical composition and reaction mechanisms over East Asia (Kim et al., 2017). Measurements from Pandora instruments in South Korea have been utilized for multi-year analyses and the validation of total O3 measurements (Baek et al, 2017; Kim et al., 2017). Although the data quality of total O3 from the Pandora spectrometers differs by instrument, the difference in total O3 between Pandora and other instruments has been less than 2% in all comparison studies to date (Baek et al., 2017; Kim et al., 2017).
Because variations in total O3 can primarily be attributed to changes in the stratosphere, the pattern of total O3 density shows a weak dependence on regional or local emissions near the observation sites. In contrast, NO2 column is affected primarily by vehicle emissions, industrial activities, and local short-range transport in the troposphere. Although some previous work analyzed the effect of the long-range transport of NO2 (e.g., Donnelly et al., 2015), the lifetime of NO2 near the surface is on the order of hours to days (Seinfeld and Pandis, 2012), indicating that a careful approach is required for analyses of the effects of regional-scale transport on variations in NO2 concentrations.
Thus, the objective of this study is to investigate the effects of local air-mass transport from NO2 sources on vertical column densities (VCD) of tropospheric NO2 from Pandora observations. As a preliminary study for the KORUS-AQ campaign, we analyzed the regional characteristics of NO2 measurements at six Pandora sites obtained during the MAPS-Seoul campaign while considering wind patterns and the locations of regional emission sources. Using these findings, we report the characteristics of NO2 VCD during the MAPS-Seoul campaign from May 18 to June 14, 2015 in South Korea.
DATA AND ANALYS
Variations in tropospheric NO2 VCD were analyzed at six Pandora sites. Also, the characteristics of NO2 transport during the MAPS-Seoul campaign were investigated using the wind information from European Centre for Medium-Range Weather Forecasts (ECMWF) reanalysis data. To evaluate the characteristics of transport in the troposphere at the Pandora observation sites, we obtained tropospheric NO2 VCD by subtracting Ozone Monitoring Instrument (OMI) stratospheric NO2 VCD from Pandora total N02 VCD.
NO2 from Pandora
The Pandora spectrometer system is configured with mounting systems for sun-tracker and sky-scanner controls, and a temperature stabilizing system for radiometric calibration (e.g., Herman et al., 2009; Tzortziou et al., 2012, 2013). The Pandora instruments in Korea are direct-sun (DS) spectrometer systems with a spectral range of 280–525 nm (spectral resolution: 0.42– 0.52 nm), and are used to measure the absorption spectra of trace gases (Baek et al., 2017). The first two Pandora spectrometers in Korea were installed at Yonsei University and Pusan National University in March 2012 to measure total column NO2 and O3. These instruments participated in the DRAGON-NE Asia campaign in South Korea at that time. Since the initial installations, six Pandora observation sites came into operation over the Korean Peninsula as part of the MAPS-Seoul campaign. Table 1 summarizes the locations and altitudes of the Pandora observation sites operated during the campaign, and Figure 1 shows their locations with a ten-year (2005–2014) mean tropospheric NO2 VCD in Dobson Units (DU; 1 DU = 2.69 × 10¹⁶ molecules/cm2) from Level 3 OMI NO2 product (OMN02d) in May and June, and mean surface wind reanalysis data from ECMWF for the same period.
Table 1.
Location and altitude of each Pandora site during the MAPS-Seoul campaign.
| Site | NIER /BYI |
Yonsei /SEO |
HUFS /Yongin |
KMA /AMY |
GIST /Gwangju |
PNU /Busan |
|---|---|---|---|---|---|---|
| Longitude (°E) | 124.631 | 126.934 | 127.265 | 126.330 | 126.843 | 129.083 |
| Latitude (°N) | 37.965 | 37.564 | 37.338 | 36.538 | 35.226 | 35.235 |
| Altitude (m) | 136 | 88 | 167 | 47 | 52 | 71 |
Figure 1.
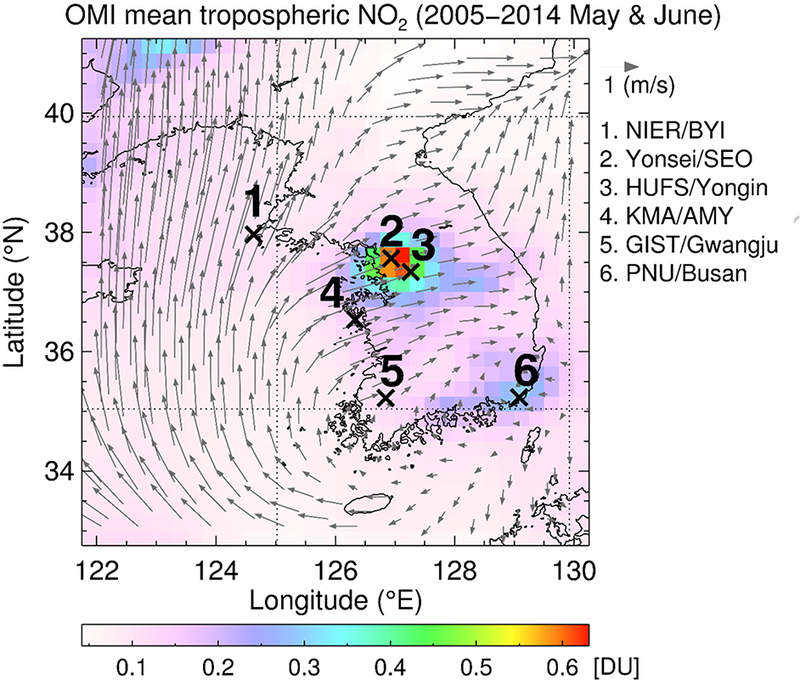
Locations of the Pandora sites on the Korean Peninsula with a ten-year (2005–2014) mean tropospheric NO2 VCD from OMI in May and June, and mean surface wind reanalysis data from ECMWF for the same period.
Total NO2 VCD was retrieved using the spectral fitting method described by Herman et al. (2009). For the analysis, we used Pandora level-3 data, which includes the normalized root-mean square error (normalized RMS), uncertainties in the NO2 column, and the index of the filter wheel position. Threshold values for quality control that we used were 0.05 DU for both normalized RMS and uncertainties in the NO2 column, respectively.
Pandora provides total NO2 VCD every 80 seconds (e.g., Tzortziou et al, 2012; Yun et al, 2013). We converted the Pandora total NO2 VCDs to hourly values by averaging over window every hour. In this procedure, the resultant hourly data which have less than three points in their windows (~5% of total measurable points in an hour) were excluded. Total VCD includes both stratospheric and tropospheric NO2. However, tropospheric NO2 VCD usually dominates total NO2 VCD variations near urban and industrial areas. To accurately estimate tropospheric NO2 VCD from Pandora observations, stratospheric NO2 information is required. For this information, we used the OMI standard product, which is explained in detail in the following sub-section. Thus, tropospheric NO2 VCD was estimated for the MAPS-Seoul campaign at each observation site, and the number of data points at each site is listed in Table 2. Because of problems with the tracker cable on the Pandora instrument at the Yonsei/SEO site beginning May 29, the number of valid data points at this site was less than half the number of data points at the other five Pandora observation sites.
Table 2.
The statistics of tropospheric NO2 VCD at each Pandora site during the MAPS-Seoul campaign. (Unit: DU).
| Site | NIER /BYI |
Yonsei /SEO |
HUFS /Yongin |
KMA /AMY |
GIST /Gwangju |
PNU /Busan |
|---|---|---|---|---|---|---|
| Average | 0.09 | 1.49 | 0.67 | 0.18 | 0.26 | 0.72 |
| Standard deviation | 0.06 | 0.68 | 0.49 | 0.14 | 0.14 | 0.39 |
| Maximum (Time) | 0.45 (May 21st, 09:00) |
4.70 (May 28th, 14:00) |
2.65 (May 29th, 15:00) |
0.95 (May 28th, 09:00) |
1.02 (June 2nd, 17:00 |
2.04 (June 1st, 11:00) |
| Minimum (Time) | −0.07 (June 2nd, 14:00) |
0.60 (May 20th, 08:00) |
0.09 (May 31st, 13:00) |
0.03 (June 5st, 15:00) |
0.07 (May 28th, 07:00) |
0.15 (June 12th, 07:00) |
| Number of data points | 251 | 88 | 272 | 211 | 238 | 256 |
The six Pandora sites were selected to include both urban and rural areas on the Korean Peninsula. Figure 2 shows the topography (in color) of the regions around the observation sites. Baengnyeongdo site operated by National Institute of Environmental Research (NIER) (NIER/BYI; Figure 2a) and the Anmyeondo site operated by Korean Meteorological Agency (KMA) (KMA/AMY; Figure 2d) are located in coastal areas far from industrial and urban regions. The NIER/BYI site is on an island located in northwest South Korea and is the closest site to China. KMA/AMY is also located in the western coastal region of Korea. The NIER/BYI an KMA/AMY sites are relatively free from the urban pollution and therefore were background sites in this study. The Busan (operated by Pusan National University) (PNU/Busan; Figure 2f) site and the Gwangju (operated by Gwangju Institute of Science and Technology; GIST) (GIST/Gwangju; Figure 2e) site are located on the them part of the urban areas in Busan and Gwangju, respectively. These two cities are respectively the 2nd and 6th most populous cities in South Korea. The Seoul (operated by Yonsei University) (Yonsei/SEO; Figure 2b) site and the Yongin (operated by Hankuk University of Foreign Studies; HUFS) (HUFS/Yongin; Figure 2c) site are located in the Seoul metropolitan area (SMA); however, these two sites have different characteristics. The Yonsei/SEO site is at the center of the Seoul urban area, while the HUFS/Yongin site is in a suburban area 40 km southeast and downwind of Seoul. Therefore, the HUFS/Yongin site is expected to be affected by transport from the urban area of Seoul.
Figure 2.
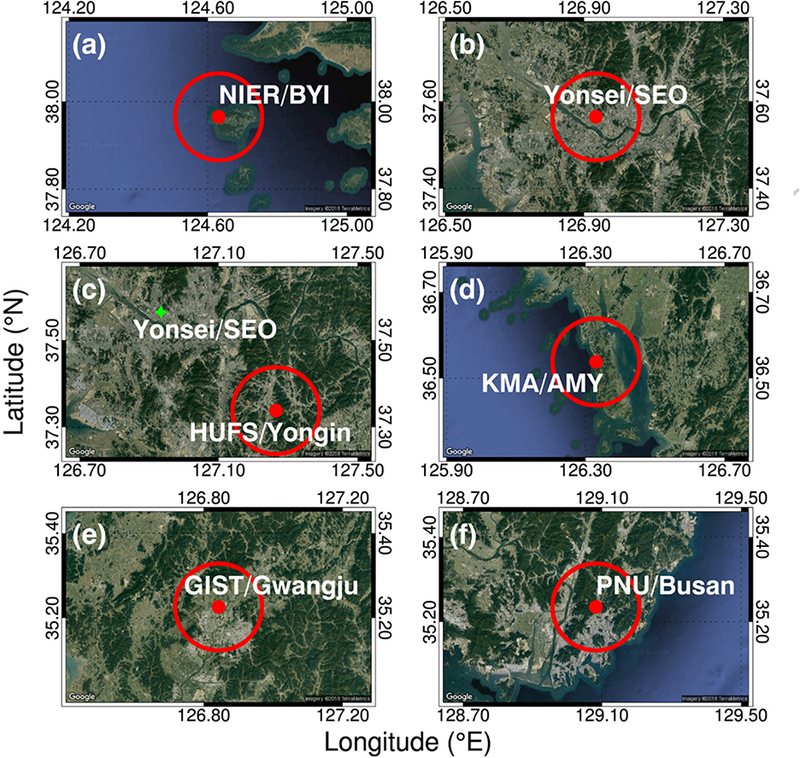
Local characteristics of the Pandora sites at (a) NIER/BYI, (b) Yonsei/SEO, (c) HUFS/Yongin, (d) KMA/AMY, (e) GIST/Gwangju, and (f) PNU/Busan. The radius of each red circle is 0.125°, representing the resolution of the wind field we employed, and the center of it indicates the location of each Pandora (red dot). The location of Pandora at Yonsei/SEO is marked in green on (c).
Stratospheric NO2 from OMI
The OMI instalment was designed to observe total column amounts of several trace gases including NO2, and thus aid analyses of air quality and assessments of the climate effects of changes in chemical composition. OMI was launched in 2004 onboard the Aura satellite and measures backscattered solar light in the ultra violet (UV)-visible range (270–500 nm) using three different channels (two UV and one visible; e.g., Levelt et al., 2006; Buchard et al., 2008). The nominal spatial resolution is from 13 × 24 km2 (at nadir) to 28 × 150 km2 (at the edge of the swath). Because the Aura is a sun-synchronous satellite with a 98° inclination angle, daily values over the Korean Peninsula from OMI were obtained from data from one or two overpasses per day in the afternoon. The nadir 13 × 24 km2 pass was obtained close to 13:30 local time.
The NO2 VCD from OMI is based on the level-2 standard product of NASA’s version 3 OMI NO2 (OMN02) dataset. For the retrieval of NO2, spectral radiance data from 405 to 465 nm in the visible spectrum were used to estimate slant column amounts (Bucsela et al, 2013). As part of improvements to the retrieval algorithm between versions 2 and 3, chemical transport model simulations with time-dependent emissions were adopted to account for variations in the vertical profiles for air mass factor calculations (Ialongo et al, 2016; Krotkov et al, 2017). The OMN02 provides total, tropospheric, and stratospheric NO2 VCD. Thus, OMI stratospheric NO2 data can be used to estimate the tropospheric NO2 VCD from Pandora observations. Stratospheric NO2 is affected by chemical reactions and lightning activity (Noxon, 1979; Zhang et al, 2000; Wenig et al., 2004) and thus varies spatiotemporally. We sampled the stratospheric NO2 VCD from OMI for each Pandora station, and thus the tropospheric NO2 VCD from Pandora data was calculated as
| (1) |
where VCDPAN.TroP, VCDPAN.Tot, and VCDOMI.strat are the tropospheric and total NO2 VCD from Pandora, and the stratospheric NO2 VCD from OMI, respectively.
For spatial co-location with Pandora, we selected the OMI pixels within 20 km from each Pandora site. While the Pandora total NO2 VCD was calculated for each hour, OMI values occur only once daily, in the afternoon. This is one potential error source for using OMI to estimate tropospheric NO2 VCD from the Pandora observations. In this study, we assumed the temporal and spatial distribution of stratospheric NO2 was stable throughout the day and over the 20 km window. This approach is adapted from previous studies (e.g. Knepp et al, 2013; Kollonige et al, 2017) which estimated tropospheric NO2 VCD by subtracting OMI stratospheric NO2 VCD from Pandora total column NO2 observations, assuming constant stratospheric NO2 column on a daily basis under polluted conditions. In less polluted regions, such as NIER/BYI in this study, negative tropospheric NO2 values can occur occasionally with this method. In addition, during the stratosphere-troposphere separation procedure for OMI NO2 standard product, the stratospheric NO2 VCD is smoothed interpreting smaller-scale features than approximately 300 km in the initial estimate as tropospheric (Bucsela et al., 2013). Thus, assuming negligible spatial NO2 VCD observed from Pandora and sampled stratospheric NO2 VCD from OMI for each site during the MAPS-Seoul campaign. Tropospheric NO2 dominates total NO2 VCD in the SMA (at Yonsei/SEO and HUFS/Yongin), and PNU/Busan, as can be inferred from Figure 1. Despite showing lower levels of total NO2 compared to those sites, the amounts and variability of NO2 in the stratosphere at NIER/BYI, KMA/AMY, and GIST/Gwangju are relatively small in comparison to total, allowing stratospheric NO2 VCD to be assumed constant on a daily basis. However, there were days for which no data from OMI were available within 20 km from a ground-based observation site. In this case, the averaged OMI stratospheric NO2 VCD for that particular site over the course of the campaign period was used (red dots in Figure 3b).
Figure 3.
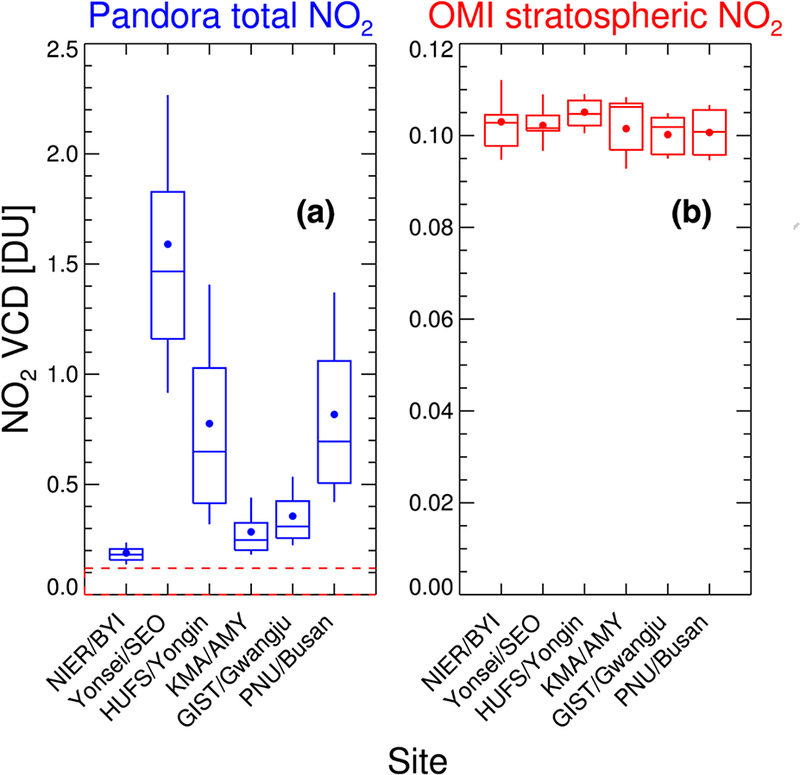
(a) Total VCD of NO2 observed from Pandora and (b) sampled stratospheric NO2 from OMI at each site during the MAPS-Seoul campaign. Box-and-whisker plots show 10, 25, 50, 75, and 90 percentiles, and the dots indicate the means. The red box with broken lines in (a) represents the y-axis range of (b).
Wind data
To analyze the transport characteristics of NO2 at the observation sites, we used the wind speed and wind direction at the surface. Because surface wind varies significantly with surface conditions over small spatial scales, high-resolution wind information is required. For the wind analysis, U and V (west-east and south-north, respectively) wind components at 10 m altitude from ECMWF reanalysis interim data (hereafter ERA-Interim) were used in this study (Dee et al, 2011; http://apps.ecmwf.int/datasets/). To decrease local surface-condition effects on wind, the ECMWF ERA-Interim were used at the highest available horizontal resolution, 0.125° x 0.125°.
The U and V wind components from ERA-Interim were interpolated to the latitude and longitude of the respective Pandora sites. Then we converted them to the wind speed and direction at each site. The original reanalysis data have a temporal resolution of 6 hours. Thus, wind information was interpolated to a 1-hour resolution from the original 6-hour resolution after the spatial interpolation, for temporal co-location with the NO2 data.
RESULTS AND DISCUSSION
Figure 4 shows a time series of hourly-based tropospheric NO2 VCD from the Pandora observations. During the MAPS-Seoul campaign period, tropospheric NO2 VCDs at NIER/BYI and KMA/AMY were remarkably low, ranging from −0.07 to 0.45 DU and from 0.03 to 0.95 DU, respectively. However, large NO2 VCDs were observed, up to 4.70 DU at Yonsei/SEO and 2.04 DU at PNU/Busan. While the difference between the maximum and minimum during the whole campaign period was less than 1 DU at NIER/BYI and KMA/AMY, a variation of 3.96 DU was observed in a single day on May 28 at Yonsei/SEO. Tropospheric NO2 VCD was always below 0.45 DU at the NIER/BYI site because of the large distance from emission sources. At the NIER/BYI site, the tropospheric NO2 VCD temporarily increased on May 19 and 21, but otherwise remained small and constant. Negative values were found at this site, which were generated by subtraction of OMI stratospheric NO2 VCD larger than Pandora total NO2 VCD. However, the number of them was less than 2% of the total data points. In a diurnal scale, variations in tropospheric NO2 were clearly observed at the Yonsei/SEO, HUFS/Yongin, and PNU/Busan sites, which are the sites nearest to large urban areas. However, the diurnal cycle in tropospheric NO2 VCD at GIST/Gwangju was not as strong. It was similar to what was observed at KMA/AMY and NIER/BYI, although the GIST/Gwangju site is located near an urban area (see also Figure 9).
Figure 4.
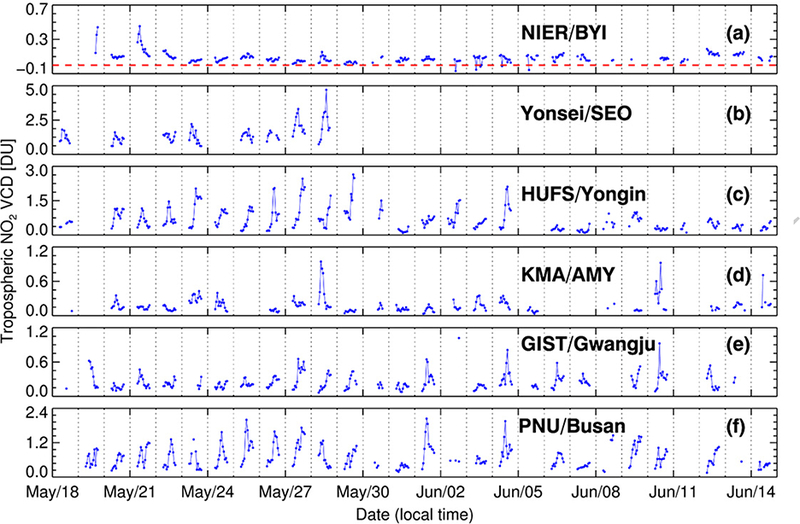
Tropospheric NO2 VCDs obtained from Pandora observations at the (a) NIER/BYI, (b) Yonsei/SEO, (c) HUFS/Yongin, (d) KMA/AMY, (e) GIST/Gwnagju, and (f) PNU/Busan sites during the MAPS-Seoul campaign. The red broken line in (a) indicates 0 DU.
Figure 9.
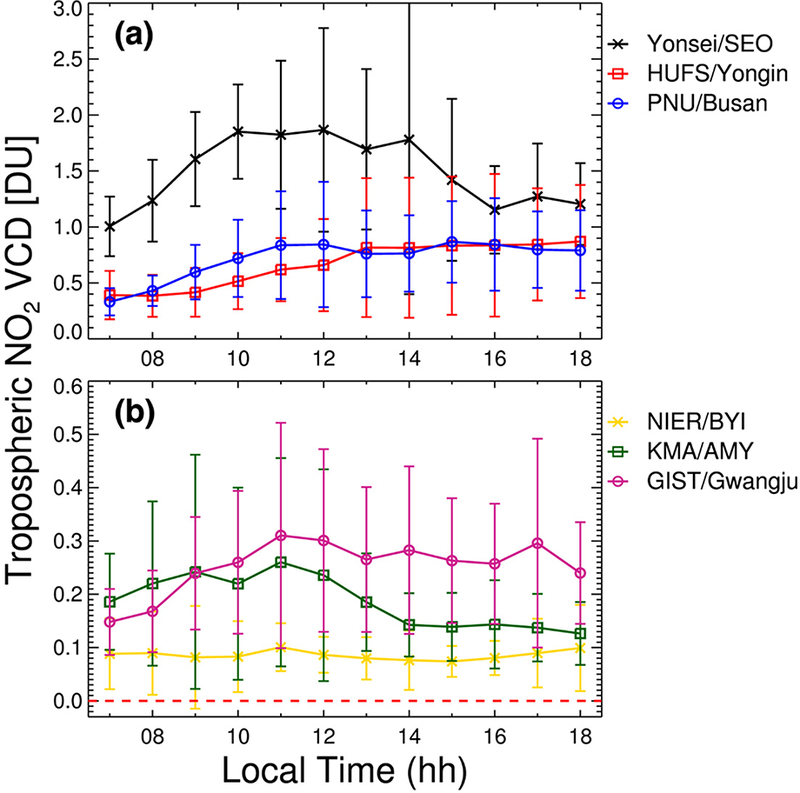
Diurnal variations in tropospheric NO2 at (a) Yonsei/SEO, HUFS/Yongin, and PNU/Busan, and (b) GIST/Gwangju, NIER/BYI and KMA/AMY, based on hourly averaged data. The error bars represent the standard deviations; the red broken line in (b) indicates 0 DU.
Table 2 and Figure 5 present details of the hourly tropospheric NO2 VCDs during the MAPS-Seoul Campaign. The Yonsei/SEO site showed the maximum mean tropospheric NO2 VCD (1.49 ± 0.68 DU) among the six sites during the campaign period. Even the minimum tropospheric NO2 VCD at this site was 0.60 DU, which is larger than the maximum value of tropospheric NO2 VCD at the NIER/BYI site (0.45 DU), representing the huge NO2 emissions in Seoul. In addition, the HUFS/Yongin and PNU/Busan sites had similar tropospheric NO2 VCD levels. The HUFS/Yongin site had the third largest average tropospheric NO2 VCD (0.67 ± 0.49 DU), following PNU/Busan (0.72 ± 0.39 DU), indicating that huge local emissions in Seoul also lead to high NO2 concentrations around the SMA. The NO2 VCD in the troposphere at GIST/Gwangju (0.26 ± 0.14 DU) was comparable to that in KMA/AMY (0.18 ± 0.14 DU). Although the GIST/Gwangju site is located in an urban area, levels of tropospheric NO2 VCD resembled those at the suburban and rural sites, because the industrial region around Gwangju is small. As can be seen from the box-and-whisker plots in Figure 5, all the sites are sk positive direction. From the results so far, the statistics of tropospheric NO2 were identified for each of the Pandora sites during the MAPS-Seoul campaign. However, even if the distribution of tropospheric NO2 VCDs is similar between sites, major contributors to the amounts may differ by local emissions and transport patterns.
Figure 5.
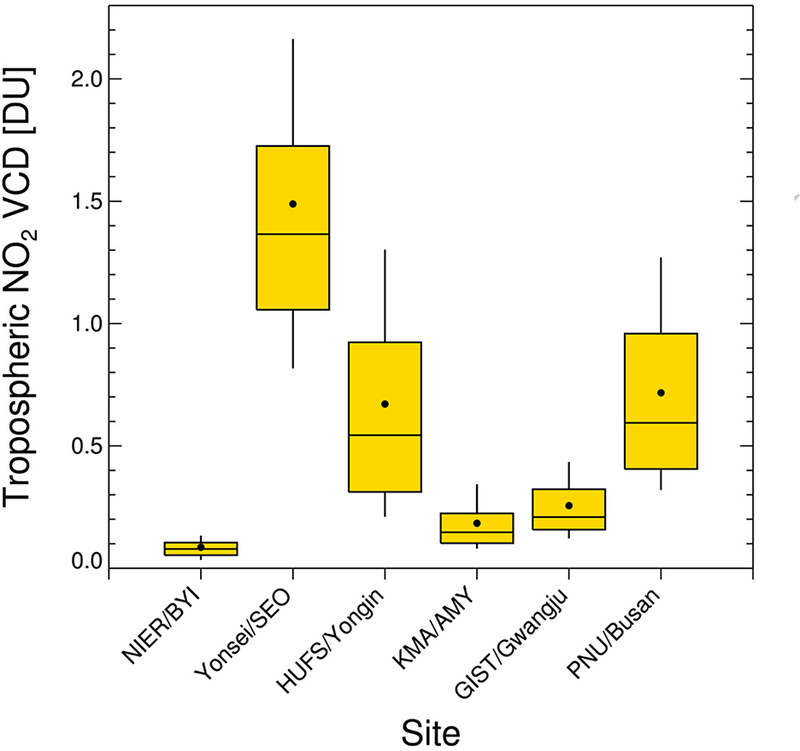
Tropospheric NO2 VCD at each Pandora site. Box-and-whisker plots show 10, 25, 50, 75, and 90 percentiles, and the dots indicate the means.
For better understanding of major contributors to tropospheric NO2 VCD at each site, we need to examine the NO2 VCD change in accordance with the wind pattern. Figure 6 shows polar plots of tropospheric NO2 VCD, along with wind speed and direction at the six Pandora sites. Because of the regional characteristics of wind and the short campaign period, it is likely that not all wind patterns in South Korea are included in the analysis (e.g., seasonal wind pattern). However, this analysis indicates how wind pattern affects the regional characteristics of tropospheric NO2 during the MAPS-Seoul campaign. In most cases, the wind speed did not exceed 10 m/s at the observation sites, and westerly wind was dominant over easterly wind. This is consistent with the general wind pattern over the Korean peninsula in May and June (see Figure 1). Despite the limited number of observed wind patterns, Figure 6 clearly shows a change in tropospheric NO2 VCD as the wind field changes. At all the Pandora observation sites, remarkably high tropospheric NO2 VCDs at each site were found for specific wind fields. However, these wind field characteristics differ among the observation sites.
Figure 6.
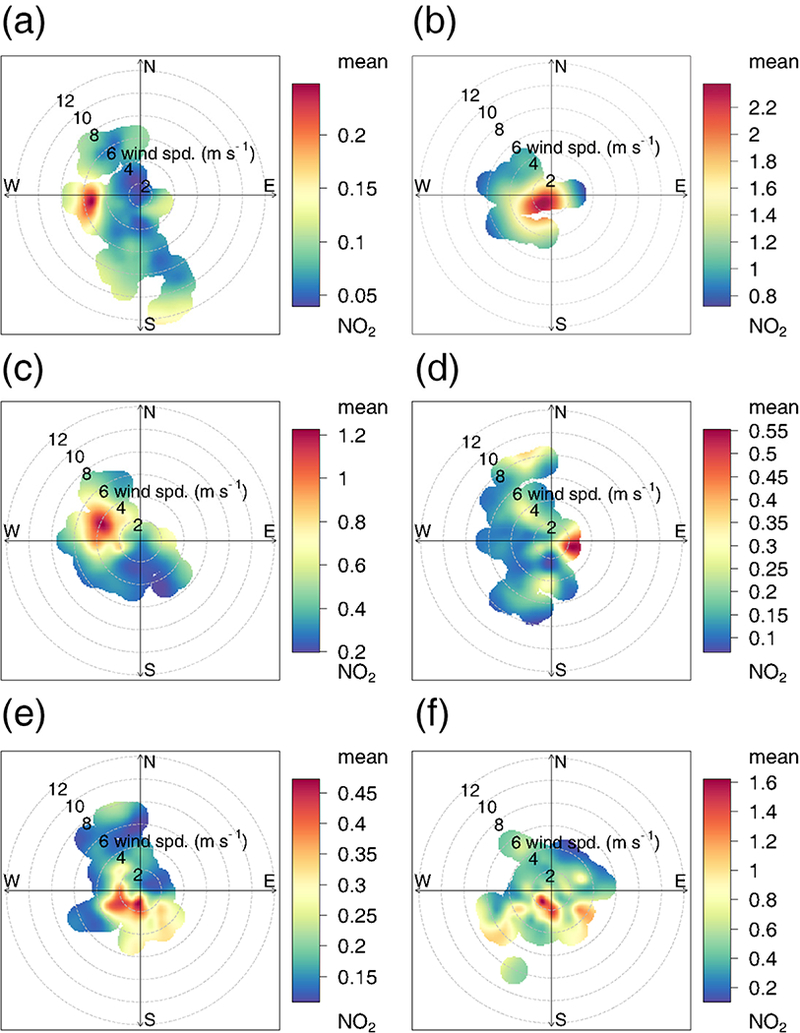
Polar plots of tropospheric NO2 VCD for the (a) NIER/BYI, (b) Yonsei/SEO, (c) HUFS/Yongin, (d) KMA/AMY, (e) GIST/Gwangju, and (f) PNU/Busan sites, along with wind conditions during the MAPS-Seoul campaign (Unit: DU).
At two urban sites, Yonsei/SEO (Figure 6b) and PNU/Busan (Figure 6f), high tropospheric NO2 VCD values were found under conditions of southerly wind with low wind speed (<4 m/s). The GIST/Gwangju (Figure 6e) site also showed high VCD values under these wind conditions, but the change in NO2 VCD was smaller and may not be significant. This finding indicates that local NO2 Yonsei/SEO and PNU/Busan during the campaign period.
Specific wind fields at the NIER/BYI (Figure 6a) and KMA/AMY (Figure 6d) sites were also associated with high NO2 VCD: westerly wind with speeds of 4–6 m/s for NIER/BYI, and easterly wind with speeds of 2–4 m/s for KMA/AMY. These two observation sites are in rural areas with weak local emissions. Therefore, high VCD values can be attributed to transport. However, the NO2 transport patterns differ between the two sites. As seen in Figure 2, NIER/BYI borders the yellow sea on the west, while the regions to the east of the KMA/AMY site are land surfaces. Therefore, high concentrations of NO2 at the NIER/BYI site are thought to be due to trans-boundary transport (e.g., Lee et al, 2014), while those at the KMA/AMY site are attributed to the transport of domestic (Korean) emissions near the observation sites. Large domestic sources of NO2 around the KMA/AMY site include power plants and industrial activity. The KMA/AMY site is close to many power plants that provide power to the SMA, as well as several chemical plants. For this reason, easterly wind patterns change the characteristics of the KMA/AMY site from a classical rural site to those resembling an industrial site.
At the HUFS/Yongin site, high tropospheric NO2 VCD values were found under northwesterly wind conditions with wind speeds of 2–6 m/s, as shown in Figure 6c. The HUFS/Yongin site is located on the southeast side of Seoul, making it downwind of Seoul during westerly wind conditions. Under these conditions, the air quality of the surrounding area is dominated by emissions from Seoul. Figure 6c indicates that transport of pollutants from Seoul affected tropospheric NO2 measurements at the HUFS/Yongin site during the MAPS-Seoul campaign. To further assess transport from Seoul to the HUFS/Yongin site, Figure 7 shows a time series of tropospheric NO2 VCD along with wind field data at the HUFS/Yongin site during the MAPS-Seoul campaign. Enhanced tropospheric NO2 VCDs and high wind speed were highly connected under westerly wind conditions. Otherwise, low tropospheric NO2 values were observed under conditions of weak wind speed or southwesterly winds. Considering the direction of Seoul from the HUFS/Yongin site (Figure 2c), those wind directions causing high tropospheric NO2 VCD at HUFS/Yongin (~ 285°−345°) indicate that the HUFS/Yongin site was highly affected by NO2 transport from Seoul.
Figure 7.
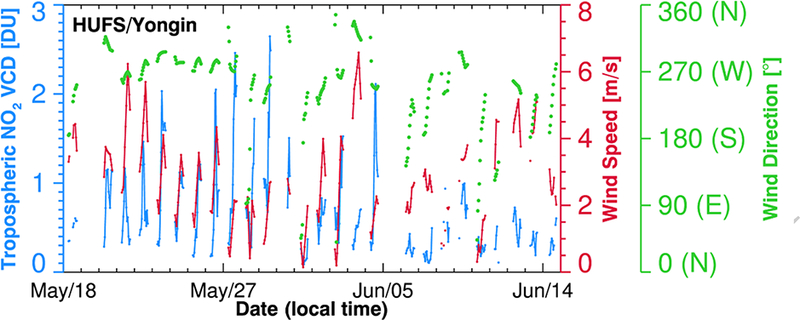
Time series of tropospheric NO2 VCD, wind speed, and wind direction at the HUFS/Yongin site.
Figure 8 shows the correlation of tropospheric NO2 VCDs between the HUFS/Yongin and Yonsei/SEO sites with consideration of the time difference. Because the distance between the Yonsei/SEO and HUFS/Yongin sites is about 40 km, the transport of NO2 from Yonsei/SEO to HUFS/Yongin can be assessed using a time lag analysis between data from the two observation sites. For this assessment, tropospheric NO2 VCD data were selected only for northwesterly wind conditions (a wind direction of 270°−360°) at HUFS/Yongin, based on the relative location of the HUFS/Yongin site from the Yonsei/SEO site. A 3-hour time lag was used on the hourly HUFS/Yongin data for the lag correlation analysis shown in Figure 8. In Figure 8a, no correlation was observed before adjusting for the time lag. Therefore, the tropospheric NO2 VCDs observed at the same time at the two sites were not significantly related. After adjusting for the 3-hour time lag, however, a significant positive correlation was found with a correlation coefficient (r) of 0.44 (Figure 8b). The time lag analysis indicated that tropospheric NO2 in Seoul affects that at the HUFS/Yongin site within a few hours. As shown in Figure 6c, high tropospheric NO2 VCDs at the HUFS/Yongin site were found when the wind was northwesterly at 2–6 m/s. Based on the distance between the two observation sites (~40 km) and the wind speed when tropospheric NO2 concentrations were high at the HUFS/Yongin site, an air mass in Seoul would take 2–5 hours to flow to the HUFS/Yongin site.
Figure 8.
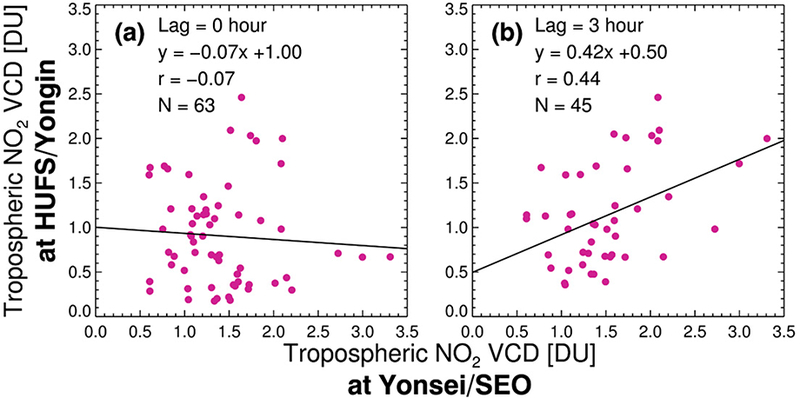
Scatter plots tropospheric NO2 VCDs between the Yonsei/SEO and HUFS/Yongin sites (a) without consideration of time lag, and (b) with a time lag of 3 hours under northwesterly wind conditions at the HUFS/Yongin site.
Figure 9 shows the average and standard deviation of hourly tropospheric NO2 VCD during the MAPS-Seoul campaign. Because the Pandora instrument uses solar radiation, the temporal observation range is from 7:00 to 18:00, local time. In Figure 9a, a diurnal pattern of tropospheric NO2 VCDs is clearly seen for Yonsei/SEO. At Yonsei/SEO, NO2 concentrations were high from 9:00 to 14:00. After high concentrations during the day, NO2 VCD decreased in the late afternoon. At the HUFS/Yongin site, however, the diurnal pattern of tropospheric NO2 VCD was different from that in Yonsei/SEO. The tropospheric NO2 VCD in the afternoon was higher than in the morning. Because of the lower transportation density around the HUFS/Yongin site, no effects on NO2 VCD due to transportation during the morning rush hour were observed. The significant increase in NO2 VCD during the afternoon may have been caused by N02 advection from Seoul, because the temporal change in tropospheric NO2 VCD at HUFS/Yongin was highest between 12:00 and 13:00, 3 hours after VCD peaked in Yonsei/SEO. At PNU/Busan, NO2 was high around noon, but was small compared with that observed at Yonsei/SEO, despite being a populous region. For the three regions in Figure 9a, the diurnal variations in tropospheric NO2 VCD can be readily explained. However, an explanation of the diurnal variations in the remaining three regions (Figure 9b) is more challenging because these three sites are strongly affected by wind field changes related to emission sources in the vicinity (KMA/AMY and GIST/Gwangju) and trans-boundary transport (NIER/BYI). At NIER/BYI, GIST/Gwangju, and KMA/AMY, we detected small diurnal variability in tropospheric NO2 VCD during the MAPS-Seoul campaign.
SUMMARY
NO2 VCDs were observed at six Pandora observation sites on the Korean Peninsula during the MAPS-Seoul campaign from May to June 2015. To analyze NO2 concentrations in the troposphere, we estimated the tropospheric NO2 VCD at the six Pandora sites by subtracting OMI stratospheric NO2 VCD from Pandora total NO2 VCD. During the MAPS-Seoul campaign period, large differences in tropospheric NO2 VCD were found between urban and rural sites. Two urban sites, Yonsei/SEO and PNU/Busan, had large maximum tropospheric NO2 VCD values of 4.70 DU and 2.04 DU, respectively. However, tropospheric NO2 VCD at the NIER/BYI site was always below 0.45 DU because of its large distance from emission sources. At the sites within the SMA (Yonsei/SEO and HUFS/Yongin), mean values of tropospheric NO2 VCD were significantly larger than those at the other sites except for PNU/Busan. This indicates that regional emissions near Seoul significantly contribute to high NO2 concentrations in the SMA. The tropospheric NO2 VCD at GIST/Gwangju was comparable to that at KMA/AMY, even though the GIST/Gwangju site is located near an urban area.
To understand major contributors to tropospheric NO2 VCD at each of the observation sites, the wind field (wind speed and direction) from reanalysis data at each site was analyzed in comparison with the change in NO2 VCD. Using this method, high tropospheric NO2 VCDs at each site were found to be related with specific wind speeds and directions. At Yonsei/SEO and PNU/Busan, high tropospheric NO2 VCD values were directly attributed to large local emissions. At the rural sites, the increase of NO2 VCDs result primarily from trans-boundary transport (NIER/BYI) or transport from domestic emissions near the observation site (KMA/AMY). Because the location of HUFS/Yongin site is usually downwind of Seoul, high tropospheric NO2 VCDs were found under conditions in which the wind blows directly from Seoul (i.e., strong northwesterly wind). In addition, tropospheric NO2 VCD between the HUFS/Yongin and Yonsei/SEO sites was significantly correlated when a 3-hour time lag was included. This time lag is similar to the estimated transport time between the two sites, based on the distance between the two sites and the wind speed at which high tropospheric NO2 VCD occurred. Therefore, it seems clear that the high tropospheric NO2 VCD at HUFS/Yongin site can be directly attributed to emissions in Seoul.
Diurnal patterns in tropospheric NO2 VCD are evident in Yonsei/SEO and HUFS/Yongin from daytime Pandora measurements, but no significant patterns were observed for NIER/BYI,KMA/AMY, and GIST/Gwangju. Although the Yonsei/SEO and HUFS/Yongin sites show diurnal variations in tropospheric NO2 VCD, the nature of the variations differs between the two sites. At Yonsei/SEO, high NO2 VCDs were found from 9:00 to 14:00. The HUFS/Yongin site did not show peaks in the morning, but high NO2 VCDs were observed throughout the afternoon because of NO2 transport from Seoul.
Tropospheric NO2 VCD was analyzed at each site using Pandora observations. Throughout the campaign period, the SMA had higher NO2 VCD than other areas in general. The lowest NO2 value was observed at NIER/BYI. The relationship between NO2 VCD and wind field was analyzed to investigate the effects of regional emissions and transport on the observation sites.
The HUFS/Yongin site was significantly affected by the transport of emissions from Seoul. Although several notable results were obtained during this work, the analysis was limited to the period of the MAPS-Seoul campaign. Therefore, further analyses of variations in tropospheric NO2 using data that span several years are required in the future.
ACKNOWLEDGMENTS
This subject is supported by Korea Ministry of Environment (MOE) as “Public Technology Program based on Environmental Policy (2017000160001)”. We thank the site managers for installing and operating Pandora spectrometers in Korea during the MAPS-Seoul campaign period.
REFERENCES
- Allen D, Pickering K, Duncan B, Damon Μ (2010). Impact of lightning NO emissions on North American photochemistry as determined using the Global Modeling Initiative (GMI) model, J. Geophys. Res, 115: D22301, doi: 10.1029/2010JD014062. [DOI] [Google Scholar]
- Baek K, Kim JH, Herman JR, Haffner DP, and Kim J (2017). Validation of Brewer and Pandora measurements using OMI total ozone, Atmos. Env, 160: 165–175. [Google Scholar]
- Barthe C, Pinty J-P, and Mari C (2007). Lightning-produced NOx in an explicit electrical scheme tested in a Stratosphere-Troposphere Experiment: Radiation, Aerosols, and Ozone case study, J. Geophys. Res, 112: D04302, doi: 10.1029/2006JD007 [DOI] [Google Scholar]
- Barton PK, and Atwater JW (2002). Nitrous Oxide Emissions and the Anthropogenic Nitrogen in Wastewater and Solid Waste, J. Environ. Eng, 128(2): 137–150. [Google Scholar]
- Bayram H, Sapsford RJ, Abdelaziz ΜM, and Khair OA (2001). Effect of ozone and nitrogen dioxide on the release of proinflammatory mediators from bronchial epithelial cells of nonatopic nonasthmatic subjects and atopic asthmatic patients in vitro, J. Allergy Clin. Immunol, 107(2): 287–294. [DOI] [PubMed] [Google Scholar]
- Boersma KF, Eskes HJ, and Brinksma EJ (2004). Error analysis for tropospheric NO2 retrieval from space, J. Geophys. Res, 109: D04311, doi: 10.1029/2003JD003962. [DOI] [Google Scholar]
- Brasseur GP, Hauglustaine DA, Walters S, Rasch PJ, Muller JF, Granier C, and Tie XX (1998). MOZART, a global chemical transport model for ozone and related chemical tracers 1: Model description, J. Geophys. Res, 103(D21): 28,265–28,289. [Google Scholar]
- Brewer AW, McElroy CT, and Kerr JB (1973). Nitrogen dioxide concentrations in the atmosphere, Nature, 246(5429): 129–133. [Google Scholar]
- Buchard V, Brogniez C, Auriol F, Bonnel B, Lenoble J, Tanskanen A, Bojkov B, and Veefkind P (2008). Comparison of OMI ozone and UV irradiance data with ground-based measurements at two French sites, Atmos. Chem. Phys, 517–4528. [Google Scholar]
- Bucsela EJ, Krotkov NA, Celarier EA, Lamsal LN, Swartz WH, Bhartia PK Boersma KF, Veefkind JP, Gleason JF, and Pickering KE (2013). A new stratospheric and tropospheric NO2 retrieval algorithm for nadir-viewing satellite instruments: applications to OMI, Atmos. Meas. Tech, 6: 2607–2626, doi: 10.5194/amt-6-2607-2013. [DOI] [Google Scholar]
- Castellanos P, Boersma KF, Torres O, and de haan JF (2015). OMI tropospheric NO2 air mass factors over South America: effects of biomass burning aerosols, Atmos. Meas. Tech, 8: 3831–3849. [Google Scholar]
- Cede A (2011). Manual for Pandora Software Suite Version 1.3.
- Cede A, Herman J, Richter A, Krotkov N, and Burrows J (2006). Measurements of nitrogen dioxide total column amounts using a Brewer double spectrophotometer in direct sun mode, J. Geophys. Res, Ill: D05304, doi: 10.1029/2005JD006585. [DOI] [Google Scholar]
- Chimot J, Vlemmix T, Veefkind JP, de Haan JF, and Levelt PF (2016). Impact of aerosols on the OMI tropospheric NO2 retrievals over industrialized regions:how accurate is the aerosol correction of cloud-free scenes via a simple cloud model?, Atmos. Meas. Tech, 9, 359–382. [Google Scholar]
- Chitano P, Hosselet J, Mapp C, and Fabbri L (1995). Effect of oxidant air pollutants on the respiratory system: insights from experimental animal research, European respiratory journal, 8(8): 1357–1371. [DOI] [PubMed] [Google Scholar]
- Choi Y, Wang Y, Zeng T, Cunnold D, Yang E-S, Martin R, Chance K, Thouret V, and Edgerton E (2008). Springtime transitions of NO2, CO, and O3 over North America: Model evaluation and analysis,J. Geophys. Res, 113: D20311, doi: 10.1029/2007JD009632. [DOI] [Google Scholar]
- Choi Y, Kim J, Eldering A, Osterman G, Yung YL, Gu Y, and Liou KN (2009). Lightning and anthropogenic NOx sources over the United States and the western North Atlantic Ocean: Impact on OLR and radiative effects, Geophys. Res. Lett, 36: L17806, doi : 10.1029/2009GL039381. [DOI] [Google Scholar]
- Crutzen PJ (1979). The role of No and NO2 in the chemistry of the troposphere and stratosphere, Ann. Rev., Earth Planet. Sci, 7: 443–472. [Google Scholar]
- Dee DP, Uppala SM, Simmons AJ, Berrisford P, Poli P, Kobayashi S, Andrae U, Balmaseda MA, Balsamo G, Bauer P, Bechtold P, Beljaars ACM, van de Berg L, Bidlot J, Bormann N, Delsol C, Dragani R, Fuentes M, Geer AJ, Haimberger L, Healy SB, Hersbach H, Holm EV, Isaksen L, Kâllberg P, Köhler M, Matricardi M, McNally AP, Monge-Sanz BM, Morcrette J-J, Park B-K, Peubey C, de Rosnay P, Tavolato C, Thépaut J-N and Vitart F (2011). The ERA-Interim reanalysis: configuration and performance of the data assimilation system. Q.J.R. Meteorol. Soc, 137: 553–597. doi: 10.1002/qj.828 [DOI] [Google Scholar]
- Diemoz H, Siani AM, Redonas A, Savastiouk V, McElroy CT, Navarro-Comas M, and Hase F (2014). Improved retrieval of nitrogen dioxide (NO2) column densities by means of MKIV Brewer spectrophotometers, Atmos. Meas. Tech, 7: 4009–4022. [Google Scholar]
- Donnelly AA, Broderick BM, and Misstear BD (2015). The effect of long-range air mass transport pathways on PM 10 and NO2 concentrations at urban and rural background sites in Ireland: Quantification using clustering techniques, J. Environ. Sei. and Health, Part A, 50(7): 647–658. [DOI] [PubMed] [Google Scholar]
- Galloway JN, Dentener FJ, Capone DG, Boyer EW, Howarth RW, Seitzinger SP, Asner GP, Cleveland CC, Green PA, Holland EA, Karl DM, Michaels AF, Porter JH, Townsend AR, and Voeroesmarty CJ (2004). Nitrogen cycles: past, present, and future, Biogeochemistry, 70: 153–226. [Google Scholar]
- Herman J, Cede A, Spinei E, Mount G, Tzortziou M, and Abuhassan N (2009). NO2 column amounts from ground-based Pandora and MFDOAS spectrometers using the direct sun DOAS technique: Intercomparisons and application to OMI validation, J. Geophys. Res, 114(D13): D13307, doi: 10.1029/2009JD011848. [DOI] [Google Scholar]
- Hudman RC, Jacob DJ, Turquety S, Leibensperger EM, Murray LT,Wu S, Gilliland AB, Avery M, Bertram TH, Brune W, Cohen RC, Dibb JE, Flocke FM, Fried A, Holloway J, Neuman JA, Orville R, Perring A, Ren X, Sachse GW, Singh ΗB, Swanson A, and Wooldridge PJ (2007). Surface and lightning sources of nitrogen oxides over the United States: magnitudes, chemical evolution, and outflow, J. Geophys. Res, 112: D12S05, doi: 10.1029/2006JD007912. [DOI] [Google Scholar]
- Ialongo F, Herman J, Krotkov N, Lamsal L, Boersma KF, Hovila J, and Tamminen J 2016). Comparison of OMI NO2 observations and their seasonal and weekly cycles with ground-based measurements in Helsinki. Atmos. Meas. Tech, 9(10): 5203–5212. [Google Scholar]
- Intergovernmental Panel on Climate Change (IPCC) (2007). Contribution of Working Group I to the Fourth Assessment Report of the Intergovernmental Panel on Climate Change, in Climate Change 2007: The Physical Science Basis, edited by Solomon S et al. , 996 pp., Cambridge Univ. Press, Cambridge, U. K. [Google Scholar]
- Irie H, Kanaya Y, Akimoto H, Tanimoto H, Wang Z, Gleason JF, and Bucsela EJ (2008). Validation of OMI tropospheric NO2 column data using MAX-DOAS measurements deep inside the North China Plain in June 2006: Mount Tai Experiment 2006, Atmos. Chem. Phys, 8: 6577–6586, 10.5194/acp-8-6577-2008 [DOI] [Google Scholar]
- Kerr JB (1989). Ground-based measurements of nitrogen dioxide using the Brewer spectrophotometer, in: Ozone in the Atmosphere, Vol. 1, 340 pp. [Google Scholar]
- Kerr JB, Asbridge IA, and Evans WFJ (1988). Intercomparison of total ozone measured by the Brewer and Dobson spectrophotometers at Toronto, J. Geophys. Res, 93: 11129–11140. [Google Scholar]
- Kim J (2012). GEMS (Geostationary Environmental Monitoring Spectrometer) onboard the GeoKOMPSAT to monitor air quality in high temporal and spatial resolution over Asia-Pacific Region, in: EGU General Assembly Conference Abstracts, Vol. 14, 4051 pp. [Google Scholar]
- Kim J, Kim J, Cho H-K, Herman J, Park SS, Lim HK, Kim J-H, Miyagawa K, and Lee YG (2017). Intercomparison of total column ozone data from the Pandora Spectrophotometer with Dobson, Brewer and OMI measurements over Seoul, Korea, Atmos. Meas. Tech, 10, 3661–3676, 10.5194/amt-10-3661-2017. [DOI] [Google Scholar]
- Knepp T, Pippin M, Crawford J, Chen G, Szykman J, Long R, Cowen L, Cede A, Abuhassan N, Herman J, Delgado R, Compton J, Berkoff T, Fishman J, Martins D, Stauffer R, Thompson A, Weinheimer A, Knapp D, Montzka D, Lenschow D, Neil D (2015). Estimating surface NO2 and SO2 mixing ratios from fast-response total column observations and potential application to geostationary missions, J. Atmos. Chem, 72:261–286. [DOI] [PMC free article] [PubMed] [Google Scholar]
- Kollonige DE, Thompson AM, Josipovic M, Tzortziou M, Beukes JP, Burger R, Martins DK, van Zyl PG, Vakkari V & Laakso L (2017). OMI satellite and ground-based Pandora observations and their application to surface NO2 estimations at terrestrial and marine sites. Journal of Geophysical Research: Atmospheres, 122, doi: 10.1002/2017JD026518. [DOI] [Google Scholar]
- Krotkov NA, Lamsal LN, Celarier EA, Swartz WH, Marchenko SV, Bucsela EJ, Chan KL, Wenig M, and Zara M (2017). The version 3 OMI NO2 standard product, Atmos. Meas. Tech, 10:3133–3149. [Google Scholar]
- Lee DS, Koehler J, Grobler E, Rohrer F, Sausen R, Gallardo-Klenner L, Olivier JGJ, Dentener FJ, and Bouwman AF (1997). Estimations of global NOx emissions and their uncertainties, Atmos. Env, 31(12): 1735–1749. [Google Scholar]
- Lee H, Irie H, Kim YJ, Noh Y, Lee C, Kim Y, and Chun KJ (2009a). Retrieval of aerosol extinction in the lower troposphere based on UV MAX-DOAS measurements, Aerosol Sei. Technol, 43(5): 502–509. [Google Scholar]
- Lee H, Kim YL, Jung J, Lee C, Heue Κ-P, Platt U, Hu M, and Zhu T (2009b).Spatial and temporal variations in NO2 distributions over Beijing, China me; differential optical absorption spectroscopy, J. Env., Manage, 90(5): 1814–1823. [DOI] [PubMed] [Google Scholar]
- Lee H-J, Kim S-W, Brioude J, Cooper OR, Frost GJ, Kim C-H, Park RJ, Trainer M, and Woo J-H (2014), Transport of NOx in East Asia identified by satellite and in situ measurements and Lagrangian particle dispersion model simulations, J. Geophys. Res, doi: 10.1002/2013JD021185. [DOI] [Google Scholar]
- Levelt PF, Van den Oord GH, Dobber MR, Malkki A, Visser H, De Vries J, Stammes P, Lundell JO, and Saari H (2006). The ozone monitoring instrument, IEEE Trans. Geosci. An drem. Sens,44: 1093–1101. [Google Scholar]
- Liley JB, Johnston PV, McKenzie RL, Thomas AJ, and Boyd IS (2000). Stratospheric N02 variations from a long time series at Lauder, New Zealand, J. Geophys. Res, 105(D9): 11,633–11,640. [Google Scholar]
- Noxon JF (1979). Stratospheric NO2 global behavior, J. Geophys. Res, 84(C8): 5067–5076. [Google Scholar]
- Seinfeld JH (1988). Ozone air quality models, JAPCA, 38(5): 616–645. [DOI] [PubMed] [Google Scholar]
- Seinfeld JH, and Pandis SN (2012). Atmospheric chemistry and physics: from air pollution to climate change, John Wiley & Sons, 225 pp. [Google Scholar]
- Sinreich R, Friess U, Wagner T, and Platt U (2005). Multi axis differential optical absorption spectroscopy (MAX-DOAS) of gas and aerosol distributions, Faraday Discuss, 130: 153–164. [DOI] [PubMed] [Google Scholar]
- Solomon S, Portmann RW, Sanders RW, Daniel JS, Madsen W, Bartram B, and Dutton EG (1999). On the role of nitrogen dioxide in the absorption of solar radiation, J. Geophys. Res, 104(D10): 12047–12058. [Google Scholar]
- Tzortziou M, Herman JR, Cede A and Abuhassan N (2012). High precision, absolute total column ozone measurements from the Pandora spectrometer system: Comparisons with data from a Brewer double monochromator and Aura OMI, J. Geophys. Res, 117(D16): D16303, doi : 10.1029/2012JD017814. [DOI] [Google Scholar]
- Tzortziou M, Herman JR, Cede A, Loughner CP, Abuhassan N, and Naik S (2013). Spatial and temporal variability of ozone and nitrogen dioxide over a major urban estuarine ecosystem, J. Atmos. Chem, 72: 287–309. [Google Scholar]
- Van Roozendael M, de Maziere M, Hermans C, Simon PC, Pommereau JP, Goutail F, Tie XX, Brasseur G and Granier C (1997). Ground-based observations of stratospheric NO2 at high and midlatitudes in Europe after the Mount Pinatubo eruption, J. Geophys. Res, 102 (D15): 19,171–19,176. [Google Scholar]
- von Klot S, Peters A, Aalto P, Bellander T, Berglind N, D’Ippoliti D, Elosua R, Hörmann A, Kulmala M, and Lanki T (2005). Ambient air pollution is assock :ed with increased risk of hospital cardiac réadmissions of myocardial infarction survivois in five European cities, Circulation, 112(20): 3073–3079. [DOI] [PubMed] [Google Scholar]
- Wenig M, Kuhl S, Beirle S, Bucsela E, Jahne B, Platt, El. GJ, Wagner T (2004). Retrieval and analysis of stratospheric NO2 from the Global Ozone Monitoring Experiment, J. Geophys. Res, 109(D4): doi: 10.1029/2003JD003652. [DOI] [Google Scholar]
- Yun S, Lee H, Kim J, Jeong U, Park SS, and Herman J (2013). Inter-comparison of NO2 column densities measured by Pandora and OMI over Seoul, Korea, Kor. J. Rem. Sens, 29: 663–670. [Google Scholar]
- Zhang R, Sanger NT, Orville RE, Tie X, Randei W, Williams ER (2000). Enhanced NOx by lightning in the upper troposphere and lower stratosphere inferred from the UARS Global NO2 measurements, Geophys. Res. Lett, 27(5): 685–688. [Google Scholar]
- Zhang X, Helsdon JH, and Farley RD (2003). Numerical modeling of lightning-produced NOx using an explicit lightning scheme: 2. Three dimensional simulation and expanded chemistry, J. Geophys. Res, 108(D18): 4580, doi: 10.1029/2002JD003225. [DOI] [Google Scholar]


