Abstract
A large fraction of ions observed in electrospray liquid chromatography–mass spectrometry (LC–ESI-MS) experiments of biological samples remain unidentified. One of the main reasons for this is that spectral libraries of pure compounds fail to account for the complexity of the metabolite profiling of complex materials. Recently, the NIST Mass Spectrometry Data Center has been developing a novel type of searchable mass spectral library that includes all recurrent unidentified spectra found in the sample profile. These libraries, in conjunction with the NIST tandem mass spectral library, allow analysts to explore most of the chemical space accessible to LC–MS analysis. In this work, we demonstrate how these libraries can provide a reliable fingerprint of the material by applying them to a variety of urine samples, including an extremely altered urine from cancer patients undergoing total body irradiation. The same workflow is applicable to any other biological fluid. The selected class of acylcarnitines is examined in detail, and derived libraries and related software are freely available. They are intended to serve as online resources for continuing community review and improvement.
Graphical Abstract
The comparison of metabolomic patterns from liquid chromatography coupled to mass spectrometry is recognized as a promising new approach to characterize the health state of a subject.1–5 However, there are many challenges confronting the analysis of metabolomic data. Among them, the identification of molecules is a major bottleneck. In fact, the annotation of unknown metabolic signals has been called the most difficult challenge in metabolomics.2 A recent paper illustrates the difficulties of annotating molecular features having true biological significance.4 Moreover, in most cases, multivariate statistical differentiation of the case versus control samples has little value if the metabolites responsible for any differences are not known.
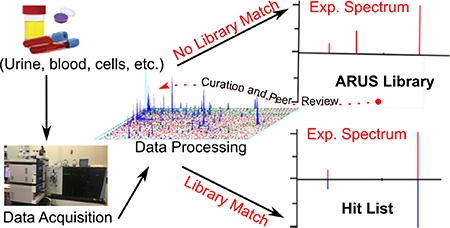
To assist in the identification problem, our group has developed a novel type of mass spectral library, one that includes all recurrent unidentified mass spectra in a material.6–8 Unlike traditional spectral libraries, which consist of reference spectra of known compounds derived from neat standards, these libraries are derived from recurring spectra of unknown identity in the target material itself, where spectra are extracted, clustered, and where possible annotated prior to entry into a library. Building the library itself follows a similar methodological procedure to the one described for libraries of neat compounds, though with a different set of spectrum and measurement annotation.
The general procedure for library building is as follows. First, the spectral libraries are generated from experimental data obtained in multiple replicate runs for each sample over a wide range of experimental conditions. This leads to the generation of a substantial number of product ion spectra for commonly occurring ions. Then spectra are compared using spectral similarity9 and clustered10 to generate consensus spectra.11 Next, spectra are annotated using a novel procedure, also developed in our group, the so-called hybrid search.12,13
NIST supports accurate and comparable measurements by certifying and providing over 1300 Standard Reference Materials (SRM) with well-characterized composition or properties or both (http://www.nist.gov/srm/program_info.cfm), including several biological materials, such as human plasma and urine. These materials can be used to generate representative mass spectral data from complex samples. As expected, while using available spectral libraries, such as METLIN14 or the NIST tandem mass spectral library,15 a substantial portion of the recorded spectra are not reliably identified. Here we discuss our methodology for building spectral libraries of unidentified but annotated recurrent spectra using tandem mass spectral data derived from NIST urine SRM samples. Then, we demonstrate the utility of this approach by analyzing an extreme case, urine samples of patients undergoing total-body-irradiation.
METHODS
Standard Reference Materials, Sample Preparation, and LC–MS Analysis
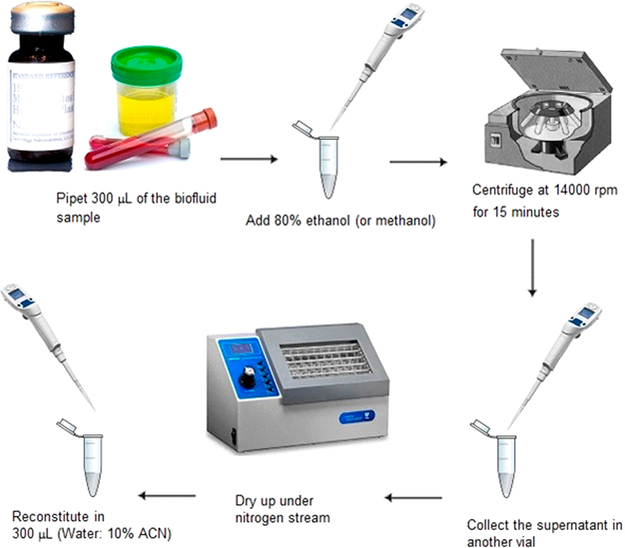
NIST has developed a variety of standard reference materials (SRMs) that are commercially available, well-characterized pooled samples representative of a diverse population. Seven urine SRMs materials were used for developing the recurrent unidentified spectral libraries (Table 1). The sample preparation and methods were similar to methods described in previous work7,8 (see also the Supporting Information). A simplified workflow depicting the experimental procedure is shown in Scheme 1. The first step was protein precipitation by ethanol (or methanol). This was followed by centrifugation, collection of supernatant, drying under nitrogen, and reconstitution in water/acetonitrile (v/v, 90:10). Most LC runs were performed using reversed phase chromatography with C18 stationary phases, 30 min gradient with mobile phase A being 0.1% (v/v) formic acid in water and mobile phase B 0.1% (v/v) formic acid in acetonitrile. We also have performed 140 runs using normal phase LC–MS analysis using hydrophilic interaction liquid chromatography (HILIC) columns following previous work.16
Table 1.
NIST Urine Standard Reference Materials (SRM)
| Standard Reference Material (SRM) | brief description |
|---|---|
| 3667 | creatinine in frozen human urine |
| 3671 | nicotine metabolites in human urine (frozen, 3 levels) |
| 3672 | organic contaminants in smokers’ urine (frozen) |
| 3673 | organic contaminants in nonsmokers |
| 3674 | organic contaminants in fortified smokers |
Scheme 1.
Simplified Overview of the Experimental Procedure to Prepare Samples for Liquid Chromatography–Mass Spectrometry Analysis
Most mass spectra were recorded on a Fusion Lumos Orbitrap (Thermo Scientific Corporation) using two varieties of fragmentation: so-called “Higher Energy Collision Dissociation” (HCD, a beam-type collisional activation), and ion trap fragmentation (IT-FT), both using the Orbitrap for high mass accuracy spectra detection. A wide energy range was covered in HCD fragmentation using both positive and negative modes. In most cases, five replicates of each sample were acquired, each at seven different HCD collision energies. Data processing was carried out using in-house and publicly available software sources, such as XCMS online and its Rversion.17,18 In-house software was used for clustering, building consensus spectra and annotating spectra, as well as for building spectral libraries. Library search identifications were performed with the new version of the NIST Tandem Library and Search Program (June 2017 version).
Data Preprocessing
The raw data was processed using the NIST pipeline, an in-house suite of programs for monitoring LC–MS performance19,20 and for comparison purposes using XCMS.17,18 The NIST pipeline software performs a library search for a full LC–MS/MS data file. It connects tandem spectra for MS1 data and performs a range of data analysis functions such as abundance, peak width, and spectral purity determination and can compare runs to report variations. While it was initially developed for proteomics analysis of peptides by data dependent acquisition, the software has evolved for small and intermediate-sized molecule analysis by electrospray dynamic data acquisition. This software contains multiple component applications which are controlled by a Perl program. It starts by processing raw mass spectrometry data files and sequentially passes the data through several programs that perform MS1 data analysis (ProMS), identification by library matching (NIST MS Search program 2.3), and performance metrics for LC–MS analysis (NIST_metrics, see ref 19). Finally, a component program was used to generate the MSP files (NIST spectral format) containing all recurrent unidentified spectra.
Spectral Similarity, Clustering, and Consensus Spectrum Building
Spectral similarity was based on a weighted dot product9 between library reference and user spectra
where A is the base-peak normalized abundance. Spectra obtained under the same fragmentation conditions were clustered by m/z precursor ion values using a simple density-based clustering algorithm.10 Dot products are calculated for each pair of spectra. The spectral scan with the greatest number of matches was assigned as the cluster seed, spectra matching the seed are considered belonging to that cluster (details can be found in ref 10). The upper limit for mass accuracy was 10 ppm and the dot product threshold 0.7. The process ends by generating a “consensus” spectrum by taking the medians of m/z and abundance values. Typically, consensus spectra could contain hundreds of individual spectral scans. It is worth mentioning that for data from beam-type instruments, consensus spectra were generated for six or more collision energy values ranging from low parent ion conversion to full fragmentation.
MS/MS Hybrid Searches
This method is called a “hybrid” because it combines matching both ion m/z and mass losses from the precursor ion (neutral losses for singly charged ions).12,13 It is used to identify tandem mass spectra of compounds that differ from library compounds by a single “inert” chemical group. Peaks containing this group will, of course, be shifted by the mass of this group, as will the mass of the molecule that contains this group. This difference, termed DeltaMass, is used to shift the product ions in the library spectrum that contain the modification, thereby allowing library product ions that contain the unexpected modification to match the query spectrum. Peaks that match before or after shifting are treated equally, and if a single peak matches both before and after shifting, the abundance is partitioned. The dot product and score between the hybrid spectrum and the unknown are then calculated according to the equation above (see refs 12 and 13 for details). The hybrid search is implemented in the MS Search Program and can be used interactively or in a batch run.
Spectral Library Building
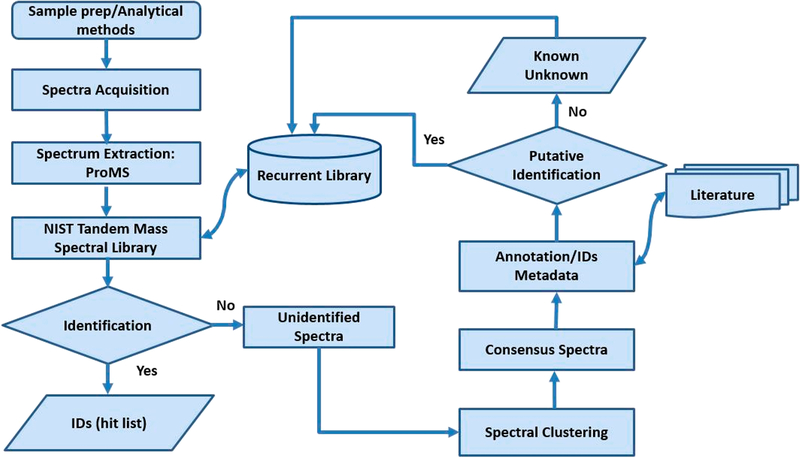
The workflow for building recurrent spectral libraries is summarized in Figure 1. It involves (i) sample preparation and optimization of analytical methods, (ii) spectral extraction and identification procedures, (iii) collecting all unidentified recurrent spectra, (iv) clustering similar spectra, (v) finding consensus spectra, and (vi) applying a putative identification to annotate spectra using the hybrid search12,13 and literature information. First, the nontargeted profiling of the urine SRMs is performed using a variety of experimental conditions and at least three good quality replicates, and all unidentified spectra are extracted. Then, similar spectra with the same precursor m/z and fragmentation conditions are clustered using a spectrum similarity score.9 Then, the consensus spectra are annotated using the hybrid search.
Figure 1.
Workflow for building spectral libraries of recurrent spectra.
Following the annotation process the spectra in the library are classified as annotated recurrent unidentified spectra (ARUS) or known-unknowns with a cluster designation and description. Each single consensus spectrum is accompanied by relevant metadata such as sample and processing conditions, exact mass, retention time (RT), relative MS1 intensity, MSn spectra, and a putative identification derived from the combined annotation information. The presence of coeluting species and in-source ions will be discussed in the last section.
RESULTS AND DISCUSSION
Standard Reference Materials and Data Acquisition Results
The purpose of this brief section is to place in context the large variability of MS1 data prompting the necessity of the ARUS library and other tools to minimize its impact in metabolomics studies. The data acquisition conditions were optimized using the NIST pipeline on repeated runs of a sample and correcting in subsequent runs the problems identified by fluctuations in key metrics.19 Thus, the repeatability of the chromatographic results and metabolite coverage were used for optimizing gradient LC parameters and MS settings, such as initial isocratic hold, gradient time, purging and re-equilibration time, injection volume, ion source parameters, MS1 and MS2 resolution, mass range, and the number of MS2 scans following each MS1 scan in the data-dependent runs.
Table 1 shows the NIST urine SRMs used in this work, including a brief description. More information about any of these materials can be found in the Certificate of Analysis issued by NIST (https://www.nist.gov/srm).
Our workflow involved repeated measurements on SRMs to acquire multiple spectra for consensus spectrum creation for each ion. We completed more than 1000 runs of urine, using these SRM samples and different activation methods, i.e., HCD at six different normalized collision energies and ion-trap (IT-FT) in a Ultimate 3000/Orbitrap Fusion-Lumos LC–MS system. It included 518 HCD runs in positive mode, 267 HCD runs in negative mode, 160 IT-FT runs in positive mode and 165 in negative mode. Unless otherwise specified, most analyses were derived from high-resolution Orbitrap spectra.
The data acquisition plan included several replicates organized in batches as described in the Methods section and in previous publications.7,8 As a measure of repeatability we typically used the relative standard deviation (RSD) of the intensities of each ion across experiments. Using the same LC–MS instrumentation, the same material experiments were repeatable and no more than five replicates were necessary to find thousands of ions with RSD below 2%. However, intensity fluctuations were more pronounced when comparing just slightly different matrixes. For example, the extracted peaks from the LC–MS analysis of seven samples of different urine SRMs using the Ultimate 3000/Orbitrap Fusion-Lumos LC–MS system, only 4327 out of 63818 extracted ions from all samples have RSD less than 20%. These significant intensity fluctuations and the fact that the reproducibility of retention times across different chromatographic setups and methods is still poor21–23 make clear the need for implementing data processing and analysis tools for avoiding uncertainty, particularly regarding low abundance components. The ARUS library provides a reliable tool to make comparisons between samples and laboratories.
Normal MS/MS Library Search Performance
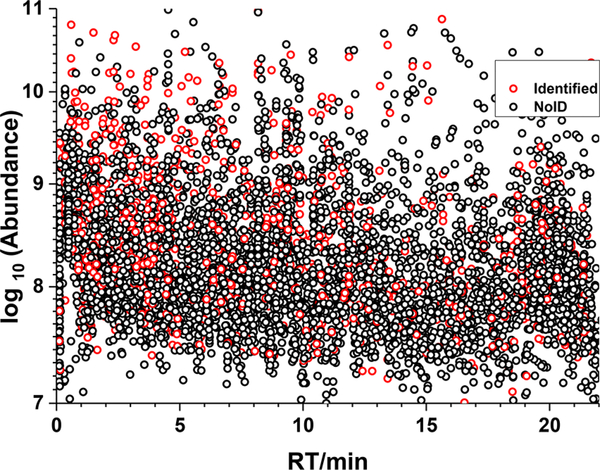
As commonly noted,1–8 a large fraction of compounds present in biological fluids, such as urine, cannot be identified by current methods. This is illustrated in Figure 2 which shows identified (red) and unidentified (black) ions in an LC–MS/MS run of a urine reference material (SRM 3667) in a plot of log abundance against retention time. Ions were located using the NIST ProMS program24,25 and identified using the NIST MS Search 2.3 program with the NIST 2017 tandem mass spectral library. Precursor and product ion mass tolerances were 20 and 40 ppm, respectively, using a minimum score threshold of 600. ProMS identified isotope clusters for all ions, charge states, RT, monoisotopic m/z, and signal intensity (peak areas derived from all observable isotope peaks) for each ion detected in all LC–MS/MS runs.
Figure 2.
Nontargeted global metabolite profile of a single sample of SRM 3667, “Creatinine in Urine”. Identified MS2-sampled ions (red circles), unidentified MS2-sampled ions (black circles).
Only 13% of the MS-sampled ions generated significant scores and hence were tentatively identified using the current NIST tandem mass library, without ambiguity. The black dots show that nearly 90% of detected ions could not be identified. For a comprehensive review of identification criteria see refs 26 and 27. Some prominent spectral features and many low abundance components remain unidentified. It is worth mentioning that the NIST 2017 library contains 13 808 compounds,28 118 082 precursor ions (approximately 80% positive ions, 20% negative ions), for a total of 574 826 spectra. Therefore, it appears unlikely that simply increasing the coverage of the library will lead to the identification of a significantly larger fraction of ions soon. The analysis of complex samples usually presents many complicating factors, in-source ion fragments, modifications, contaminants, artifacts, matrix effects, etc. To overcome this identification challenge, we describe here the construction of a new kind of tandem mass spectral library that includes all recurrent unidentified spectra (RUS) found in a material. In principle, used in conjunction with the NIST tandem mass spectral library, these libraries greatly expand all the chemical space accessible to mass spectrometry analysis for a given material.
Spectrum Annotation
Unidentified clustered spectra were annotated to the degree possible using the hybrid search and a separate analysis of in-source fragments. In this way, a large fraction of good quality spectra can be partially identified at least until the library become more comprehensive and increasingly useful. Even in the worst case, where no compound identification information can be derived from a spectrum, future determinations of such spectra will connect to these earlier experiments where the spectra were obtained and once an identification is made it can be added to the library. Even if the spectrum is identified as an artifact, this annotation would be valuable in future studies to aid in the exclusion of these spectra.
The present annotation procedure for the recurrent unidentified spectra is based primarily on results of hybrid searches. All consensus spectra included in the ARUS library were searched against the NIST 2017 tandem mass spectral library using the hybrid search algorithm with a minimum score threshold of 700. The following nomenclature was included within compound names in the library: Name_-Adduct Type_Score_DeltaMasss_Formula_LibID, where Name, DeltaMass, Score and Formula are derived from the best hit in a hybrid search. LibID is a sequential number assigned to spectra in the archive. In case of not matching, known-unknown “Names” were simply given as cluster numbers. Also, see pseudocode showing the class definitions in the Supporting Information). “Recurrent” denotes other identification with names not matching predefined compound name fragments.
Illustration of Hybrid Search Results
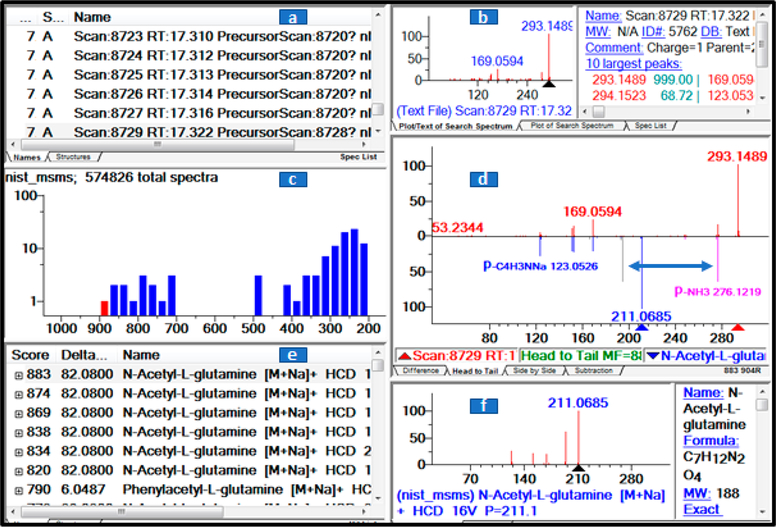
As an example of the use of the hybrid search, Figure 3 shows a library match (highest score) to a glutamine derivative. The experimental spectrum was extracted from a LC–MS/MS run of a urine SRM 3667 sample. In the reference spectrum, unshifted peaks are colored blue, shifted peaks are pink, and peaks prior to shifting are gray.
Figure 3.
Hybrid search results for a spectrum from a urine SRM 3667 sample matching multiple library matches of glutamine derivatives. The NIST library browser shows data in six windows: (a) spectrum list, (b) measured spectrum, (c) histogram of the distribution of scores (top match in red), (d) spectral comparison, (e) match list, and (f) library annotation.
The precursor mass difference, DeltaMass is shown as a blue double arrow and the m/z values of the reference and experimental spectra are shown as blue and red triangles, respectively. The name for this compound in the library is N-Acetyl-L-glutamine_[M + H]+_Score = 877_DeltaMasss = 82.0757_Form = C7H12N2O4_LibID = 127769. (The formula C6H10 corresponds to a mass difference of 82.078.) It also shows multiple high scoring hits validating the same compound class. In other words, multiple hits to the same class increase the confidence of the hybrid identification.
Hybrid Search and Chemical Class Identification
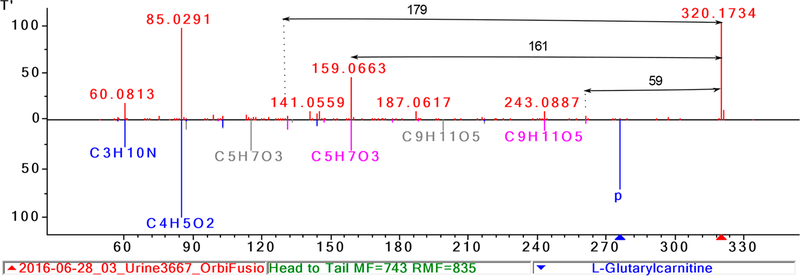
Shown in Figure 4 is an example that illustrates the usefulness of information derived from the hybrid search results. Characteristic peaks and neutral losses are shown in Figure 4 for the family of carnitines. The experimental spectrum shows prominent peaks at m/z values 60, 85, and 144 and neutral losses of 59, 161, and in this case, it also shows a neutral loss at 179, corresponding to the simultaneous loss of the carnitine backbone in addition to the loss of H2O from the OH group along the fatty acid chain from a hydroxylated carnitine.
Figure 4.
Illustrating a hybrid search resulting in multiple library matches to carnitine derivatives. Important neutral losses are shown with black arrows.
Hydroxylated and diacid carnitines represent subclasses of carnitines and can be distinguished by specific neutral losses (see Table SI_1). The hybrid search correctly matches the experimental spectrum to several carnitine derivatives. In this case, the specific oxo-carnitine, C5-oxo-carnitine, can be found based on the rationalization of the DeltaMass, characteristic peaks, specific neutral losses and prior information about the compound.27 This example illustrates the utility of the hybrid search in elucidating fragmentation reactions. Three more examples of compound annotation are given in the Supporting Information.
Tandem Mass Spectral Libraries of Annotated Recurrent Unidentified Spectra (ARUS)
As mentioned before, we have extracted recurrent unidentified tandem mass spectra from approximately 1 000 runs for the 7 urine reference materials shown in Table 1. About 540 compounds have been identified using the NIST tandem mass spectral library (see Table SI_2 for identifications in a single run). As described earlier, unidentified recurrent spectra were extracted, clustered, and converted to consensus spectra, each of which had no matching spectrum in the library (score below 600). The library contains 94 558 HCD spectra of positive ions, 30 000 negative ion spectra, 15 835 IT-FT ion trap spectra of positive ions, and 13 847 IT-FT spectra of negative ions. The HCD spectra were recorded at six different collision energies. The urine ARUS library now contains approximately 8 000 different ions (this estimation is based on hybrid search results), about 15-fold greater than the number of different identified precursor ions. A multitable in the Supporting Information (Table SI_2), using this library, shows all matched spectra for a positive and negative ionization mode run of SRM 3667 from both normal and hybrid searches (1055 different compounds).
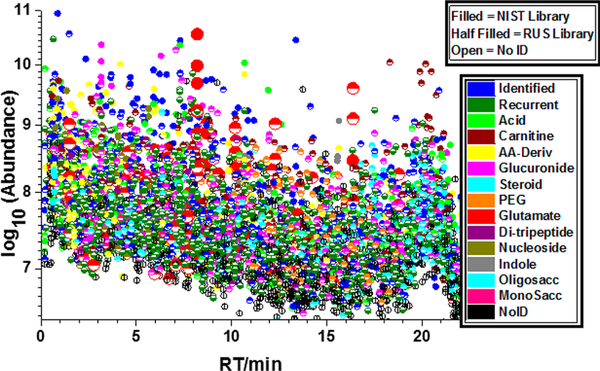
To illustrate the potential for classification by using the ARUS library, Figure 5 shows the results for the above positive ionization run (see Spectrum Annotation for the chemical-name based classification method). Roughly half of the matched compounds (scores above 700) have been coarsely classified in as follows: glucuronides (5%), acylcarnitines (8%), amino acids and related compounds (5%), PEGs (4%), glutamates (3%), nucleosides (2%), sugars (2%), steroids (2%), and others (31%). In addition, about 13% of the components have been directly identified using the NIST MS/MS spectral library. Searching single runs against the current libraries (NIST MS/MS and ARUS) typically match more than 80% of the spectra. Manual examination suggests that the other 20% is composed primarily of low-quality spectra.
Figure 5.
Chemical classes in a single run of urine SRM 3667 (positive mode). For example, out of 136 glutamate ions (larger red circles),18 were found as direct matches to the NIST MS/MS Library and 118 as matches to the urine recurrent library.
As a specific example of class identifications made by the hybrid search we present a more thorough analysis of acylcarnitines (Supporting Information). There are several reasons to pay particular attention to this group, acylcarnitines are relatively well-known, ionize well using electrospray, their relative retention times are fairly stable with an RSD within the series better than 3% and these compounds are very relevant to the clinical laboratory. A separate library for this family can be found at http://chmdatafnx.chemref-838.nist.gov/dokuwiki/doku.php?id=chemdata:nist17:carnitine). This library uses literature data29 and our own data and considers isomers, retention, fragmentation, and abundances. A recent database has been published containing exact mass, retention time, and MS/MS information on 753 acylcarnitines.30
Getting Started with the ARUS Library and Potential Applications
To run the ARUS library, download the installation program for the NIST Search Software and the library from the NIST Website (https://chemdata.nist.gov/). The installation of the search program is straightforward; however, a detailed manual can be found on the Website. A copy of the library must be present in the folder “MSSEARCH” before opening the browser.
In general, this type of library can be useful in many usual tasks of omics studies (i) answering where, how often, and in what conditions certain ions are observed, (ii) assigning class ID for compounds not in current tandem mass spectral libraries or not commercially available, (iii) connecting samples in an unambiguous way for control-case studies or interlaboratory comparisons (each molecular feature is represented by a spectrum in the library). The library is offered without warranty and will be in continuous development in the future (http://chmdatafnx.chemref-838.nist.gov/dokuwiki/doku.php?id=chemdata:arus). Eventually, data from other instruments such as Agilent and Waters QTOF was also collected. Although no systematic comparison has been made between data from different instruments, the library coverage for all instruments is similar. However, mass accuracy and ranges need to be adjusted accordingly in order to yield similar library scores for the same ions.
ARUS Library Performance
In this section, we compare the performance of the urine ARUS MS/MS library using single runs of pooled and individual patient samples.
Pooled Samples
The ARUS library was derived from pooled urine SRMs, therefore, should reflect the most common urine components. However, it is not obvious that these pooled samples would be representative of all samples or experimental conditions. The first test of the ARUS library was performed on random selected single runs of the seven SRMs used to build the library.
Section A of Table 2 shows the total number of quality spectra extracted from each SRM sample run, the number of spectra matched to the urine ARUS library (percent of matched compounds in parentheses), and the number of identifications of three major chemical classes in urine, glucuronides, carnitines, and steroids. After eliminating redundant identifications, about 50% of the total number of spectra in a single run (48–52% in the present examples) were consistently matched to the ARUS library, even though these samples have slightly different degrees of dilution (as observed from differences in the creatinine levels). The lower end of this range corresponds to SRM 3674. This SRM is the same urine pool as SRM 3673, except that it was spiked with hydroxypolycyclic aromatic hydrocarbons (hydroxy-PAHs) and it could influence the ionization efficiency of certain components. As expected, these results showed a significant ion coverage for all pooled samples (≈50% of all ions). The specific coverage of three different chemical classes showed there were no significant composition biases between pooled samples as it should be because the SRMs are derived from healthy individuals and pooled in similar conditions.
Table 2.
Number of Metabolites Belonging to Selected Major Chemical Classes Found in Single Runs of Different Urine Samples Using the Urine ARUS Library: (A) Pooled Samples and (B) Individual Patient Samplesa
| chemical classes |
|||||
|---|---|---|---|---|---|
| pooled sample | number of spectra | library hits (%) | glucuronides | carnitines | steroids |
| A | |||||
| SRM 3667 | 13160 | 6668 (51) | 310 | 366 | 68 |
| SRM 3671–1 | 11020 | 5530 (50) | 295 | 358 | 55 |
| SRM 3671–2 | 11198 | 5801 (52) | 267 | 369 | 74 |
| SRM 3671–3 | 11022 | 5700 (52) | 255 | 400 | 84 |
| SRM 3672 | 10782 | 5362 (50) | 257 | 342 | 79 |
| SRM 3673 | 10751 | 5336 (50) | 229 | 292 | 62 |
| SRM 3674 | 10782 | 5173 (48) | 219 | 302 | 56 |
| B | |||||
| individual patient samples | |||||
| healthy individual | 13178 | 6573 (50) | 290 | 301 | 70 |
| TBI patient | 10420 | 4840 (46) | 188 | 258 | 49 |
Patient samples prior to hematopoietic stem cell transplantation at 4 h to 6 h postirradiation (a single dose of 1.25 Gy) and 24 h (three fractions of 1.25 Gy each) and control samples from healthy individuals.
Individual Patient Samples
Urine samples collected from patients undergoing total body irradiation (TBI) at Memorial Sloan-Kettering Cancer Center were run under the same conditions as the SRMs. (See ref 31 for details of the sample collection protocol. A material transfer agreement exists between NIST and Georgetown University approved by the NIST Human Subjects Protection Office and the GU Institutional Review Board.)
Section B of Table 2 shows that results for urine from the healthy individual are similar to that observed in pooled samples. Regarding the analysis of the TBI patient urine sample, the percent of spectra matched to the ARUS library is slightly lower (46% vs 50%) than the average represented by other samples. Another 17% of the spectra matched the NIST tandem mass spectral library. The numbers for glucuronides (188), carnitines (258), and steroids (48) are lower than the average, but still a significant percentage of these compounds present in urine was found. The TBI patient urine represents an extreme case because the degree of dilution of this urine is higher (based on the relative concentration of creatinine), and also the changes in the urinary metabolite profiles due to total body irradiation are pronounced.31 A more detailed analysis of the differences between samples of urine standard reference materials and samples from patients undergoing total body irradiation can be found in the Supporting Information.
In general, using the ARUS urine spectral library, in conjunction with the NIST MS/MS library, we have been able to annotate between 70% and 80% of the tandem spectra observed in the LC–MS/MS analysis of urine samples from individual patients.
Postfiltering Methods
Compound identification criteria in metabolomics have been extensively discussed in the literature.26,27,32–35 ARUS identifications should be considered level 3, “putatively characterized compound classes”, as defined by the Chemical Analysis Working Group of the Metabolomics Standards Initiative.35 In general, identifications cannot be considered confident if the pure compound was not directly included in a parallel experiment (or a labeled experiment) and identifications are confirmed by retention time. Therefore, for confident identification, ARUS IDs need to be verified by other means. This curation process is necessary because of the many complicating factors implicated in the identification process (see refs 8 and 27).
In this section, the ARUS library identifications reported in Table SI_2 and discussed in the previous sections were subjected to three additional procedures that we found helpful in the overall verification process.
Fragmentation Rules from Empirical Observations
A computer program (available upon request) was developed to make use of characteristic product ion peaks and neutral losses to define broad fragmentation classes in compounds of urine (see compound modifications in Table SI_1 in the Supporting Information). If found, the closest MS1 scans before and after the query spectrum were examined for related ions (according to Table SI_1). Mass differences corresponding to known chemical modifications of the component and the masses of major product ions were added or subtracted to the m/z value and searched for in the MS1 scans. A normalized score between 0 and 999 was implemented. A score closer to 999 means most peaks or neutral losses associated with this particular ion were found in the MS1 scan, on the contrary a score of 0 means there is no additional MS1 information supporting the ID. All peaks were weighted equally and normalized to one and the mass tolerance for the searches was 0.001 Da. This way, 25% of all MS2-sampled ions in the single run example discussed throughout this paper were found to be members of certain chemical classes. In fact, this information is mostly redundant, as it is frequently found making sense of the DeltaMass of hybrid searches (it means DeltaMass can be found in Table SI_1, chemical modifications of urine compounds). Therefore, this information was not used in the ARUS library (it is only shown in Table SI_2).
In-Source Ion Groups over Narrow Retention Range with Related Fragment/Precursor/Adduct Mass
A considerable number of ions found in most runs were in-source fragments, dimers and adducts derived from fragmentation and adduction. Probable in-source fragment ions were usually found by using the NIST MS Search program; it works similar to the hybrid search but without mass shifting.36 In a retention time window of 0.3 min, the MS2 spectra near the query spectrum (8 scans on each side) were also examined looking for product ions with the same m/z values observed in the MS1 scan. For example, in the single run, p-acetamidophenyl glucuronide was identified at a retention time 3.15 min. Eighteen different ions were related to this ion within a symmetric RT-window of 1 s (see in-source fragment ions in Supporting Information). Another example that shows the usefulness of this analysis was the ion at m/z 105.034 that was found 104 times along the chromatogram of the single run example (not a background ion), usually connected to phenylacetylated derivatives (mostly drugs). In the single run example, in-source fragments represented about 27% of all MS2-sampled ions. This information is particularly important to avoid redundancies in the identifications and was added to the comment field of the spectrum in the ARUS library.
Prior Information
The likelihood of correct identification is increased if the compound is already a known, detectable component of the mixture. This concept of prior probability was discussed previously.26 We have combined eight lists16,29,30,32,34,37,38 of identified compounds in metabolite profiling by LC–MS of human urine. The list in ref 32 is derived from the human metabolome database (HMDB).35 Prior probability scores for the ith components of the mixture were calculated according to . All weights (w) were considered equal and normalized to 999, thus, the score ranges from 0 to 999, the latter meaning that the compound have been previously found in all lists (L), and of course, 0 meaning that the ion is not present in any of the LC–MS metabolite lists. This PP-score is probably not very useful when dealing manually with a small number of components but could be useful in computer-based decision-support systems. Additional information is presented in the Supporting Information (Table SI_2).
Overall Quality
A quality index, based on the MS1, MS2, and prior probability information, with four levels: E, excellent; G, good; A, acceptable; and P, poor was developed for Table SI_2 and manually adjusted in some cases. Also, most identifications in Table SI_2 were accompanied by a relative extensive comment about the uncertainties and difficulties associated with a particular library match, and it could help other researchers to make a decision based on their own experience. A set of rules for assigning these four quality levels is given in the Supporting Information. Retention times were found to be too variable to be of use for identification purposes, especially considering the often-similar retention times of isomers.
CONCLUDING REMARKS
Libraries of recurrent unidentified spectra were derived from many LC–MS experiments over a range of conditions for a number of urine reference materials. Using in-house procedures, these spectra were collected, clustered, and used for generating a freely available searchable library of annotated consensus spectra (https://chemdata.nist.gov/dokuwiki/doku.php?id=chemdata:nist17#annotated_recurrent_unidentified_spectra_arus).
As more data becomes available, it is hoped that this resource will continue to evolve to become more complete and annotated, where individual entries become identified with more confidence and eventually shifted to the main library. The primary objective of this approach is simple, to confidently identify as many ions as possible from a material. However, as shown before, other applications are possible, among them probably the most important for the omics community is providing a means of connecting chemical components present in different samples and between different analytical platforms in a unique and unambiguous way.
In addition to their direct use in future urine analysis, it is hoped that these libraries will be further extended and serve as an open resource that can be used in conjunction with existing resources, such as MassBank,39 m/zCloud,40 and HMDB.41 Requisite tools for library building are publicly available also, so the libraries can be used and modified by other members of the community. The strategy outlined here is applicable to other materials and varieties of chemical analysis that generate recurrent unidentified mass spectral fingerprints.
Supplementary Material
Table SI_1: Chemical modifications of urine compounds and fragmentation pathways (XLSX)
Table SI_2: Urine metabolite identifications in a single run (XLSX)
ACKNOWLEDGMENTS
We thank Drs. Evagelia C. Laiakis and Albert J. Fornace Jr., Georgetown University, for providing urine samples from patients undergoing total body irradiation.
Footnotes
The authors declare no competing financial interest.
Certain commercial instruments are identified in this article. Such identification does not imply recommendation or endorsement by the National Institute of Standards and Technology nor does it imply that the products identified are necessarily the best available for the purpose.
ASSOCIATED CONTENT
Supporting Information
The Supporting Information is available free of charge on the ACS Publications website at DOI: 10.1021/acs.analchem.9b02977.
Sample preparation and LC–MS settings; data processing; XCMS and principal component analysis settings; hybrid search pseudocode; hybrid search examples; comparative MS analysis of urine SRM samples and urine from TBI patients; and in-source fragmentation examples (PDF)
Summary analysis of acylcarnitines in the urine recurrent library (PDF)
REFERENCES
- (1).Nicholson JK; Lindon JC Nature 2008, 455 (7216), 1054–6. [DOI] [PubMed] [Google Scholar]
- (2).Wishart DS Bioanalysis 2011, 3 (15), 1769–82. [DOI] [PubMed] [Google Scholar]
- (3).Patti GJ; Yanes O; Siuzdak G Nat. Rev. Mol. Cell Biol 2012, 13 (4), 263–9. [DOI] [PMC free article] [PubMed] [Google Scholar]
- (4).Mahieu NG; Patti GJ Anal. Chem 2017, 89 (19), 10397–10406. [DOI] [PMC free article] [PubMed] [Google Scholar]
- (5).Johnson CH; Ivanisevic J; Siuzdak G Nat. Rev. Mol. Cell Biol 2016, 17 (7), 451–9. [DOI] [PMC free article] [PubMed] [Google Scholar]
- (6).Mallard WG; Andriamaharavo NR; Mirokhin YA; Halket JM; Stein SE Anal. Chem 2014, 86 (20), 10231–8. [DOI] [PubMed] [Google Scholar]
- (7).Simón-Manso Y; Lowenthal MS; Kilpatrick LE; Sampson ML; Telu KH; Rudnick PA; Mallard WG; Bearden DW; Schock TB; Tchekhovskoi DV; Blonder N; Yan X; Liang Y; Zheng Y; Wallace WE; Neta P; Phinney KW; Remaley AT; Stein SE Anal. Chem 2013, 85 (24), 11725–31. [DOI] [PubMed] [Google Scholar]
- (8).Telu KH; Yan X; Wallace WE; Stein SE; Simón-Manso Y Rapid Commun. Mass Spectrom 2016, 30 (5), 581–93. [DOI] [PMC free article] [PubMed] [Google Scholar]
- (9).Stein SE J. Am. Soc. Mass Spectrom 1994, 5 (4), 316–23. [DOI] [PubMed] [Google Scholar]
- (10).Yang X; Neta P; Stein SE Anal. Chem 2014, 86 (13), 6393–400. [DOI] [PubMed] [Google Scholar]
- (11).Lam H; Deutsch EW; Eddes JS; Eng JK; Stein SE; Aebersold R Nat. Methods 2008, 5 (10), 873–5. [DOI] [PMC free article] [PubMed] [Google Scholar]
- (12).Burke MC; Mirokhin YA; Tchekhovskoi DV; Markey SP; Heidbrink Thompson J; Larkin C; Stein SE J. Proteome Res 2017, 16 (5), 1924–1935. [DOI] [PubMed] [Google Scholar]
- (13).Moorthy AS; Wallace WE; Kearsley AJ; Tchekhovskoi DV; Stein SE Anal. Chem 2017, 89 (24), 13261–13268. [DOI] [PMC free article] [PubMed] [Google Scholar]
- (14).Smith CA; Maille GO; Want EJ; Qin C; Trauger SA; Brandon TR; Custodio DE; Abagyan R; Siuzdak G Ther. Drug Monit 2005, 27 (6), 747–751. [DOI] [PubMed] [Google Scholar]
- (15).Mass Spectrometry Data Center. NIST/EPA/NIH Mass Spectral Library, http://www.nist.gov/srd/nist1a.cfm.
- (16).Zhang T; Creek DJ; Barrett MP; Blackburn G; Watson DG Anal. Chem 2012, 84 (4), 1994–2001. [DOI] [PubMed] [Google Scholar]
- (17).Tautenhahn R; Patti GJ; Rinehart D; Siuzdak G Anal. Chem 2012, 84 (11), 5035–9. [DOI] [PMC free article] [PubMed] [Google Scholar]
- (18).Gowda H; Ivanisevic J; Johnson CH; Kurczy ME; Benton HP; Rinehart D; Nguyen T; Ray J; Kuehl J; Arevalo B; Westenskow PD; Wang J; Arkin AP; Deutschbauer AM; Patti GJ; Siuzdak G Anal. Chem 2014, 86 (14), 6931–9. [DOI] [PMC free article] [PubMed] [Google Scholar]
- (19).Rudnick PA; Clauser KR; Kilpatrick LE; Tchekhovskoi DV; Neta P; Blonder N; Billheimer DD; Blackman RK; Bunk DM; Cardasis HL; Ham AJ; Jaffe JD; Kinsinger CR; Mesri M; Neubert TA; Schilling B; Tabb DL; Tegeler TJ; Vega-Montoto L; Variyath AM; Wang M; Wang P; Whiteaker JR; Zimmerman LJ; Carr SA; Fisher SJ; Gibson BW; Paulovich AG; Regnier FE; Rodriguez H; Spiegelman C; Tempst P; Liebler DC; Stein SE Mol. Cell. Proteomics 2010, 9 (2), 225–41. [DOI] [PMC free article] [PubMed] [Google Scholar]
- (20).Paulovich AG; Billheimer D; Ham AJ; Vega-Montoto L; Rudnick PA; Tabb DL; Wang P; Blackman RK; Bunk DM; Cardasis HL; Clauser KR; Kinsinger CR; Schilling B; Tegeler TJ; Variyath AM; Wang M; Whiteaker JR; Zimmerman LJ; Fenyo D; Carr SA; Fisher SJ; Gibson BW; Mesri M; Neubert TA; Regnier FE; Rodriguez H; Spiegelman C; Stein SE; Tempst P; Liebler DC Mol. Cell. Proteomics 2010, 9 (2), 242–54. [DOI] [PMC free article] [PubMed] [Google Scholar]
- (21).Boswell PG; Schellenberg JR; Carr PW; Cohen JD; Hegeman AD J. Chromatogr A 2011, 1218 (38), 6732–41. [DOI] [PubMed] [Google Scholar]
- (22).Boswell PG; Abate-Pella D; Hewitt JT J. Chromatogr A 2015, 1412, 52–8. [DOI] [PMC free article] [PubMed] [Google Scholar]
- (23).Abate-Pella D; Freund DM; Ma Y; Simón-Manso Y; Hollender J; Broeckling CD; Huhman DV; Krokhin OV; Stoll DR; Hegeman AD; Kind T; Fiehn O; Schymanski EL; Prenni JE; Sumner LW; Boswell PG J. Chromatogr A 2015, 1412, 43–51. [DOI] [PMC free article] [PubMed] [Google Scholar]
- (24).Dong Q; Yan X; Kilpatrick LE; Liang Y; Mirokhin YA; Roth JS; Rudnick PA; Stein SE Mol. Cell. Proteomics 2014, 13 (9), 2435–49. [DOI] [PMC free article] [PubMed] [Google Scholar]
- (25).Dong Q; Yan X; Liang Y; Stein SE J. Proteome Res 2016, 15 (5), 1472–86. [DOI] [PubMed] [Google Scholar]
- (26).Stein S Anal. Chem 2012, 84 (17), 7274–82. [DOI] [PubMed] [Google Scholar]
- (27).Blazenovic I; Kind T; Ji J; Fiehn O Metabolites 2018, 8 (2), 31. [DOI] [PMC free article] [PubMed] [Google Scholar]
- (28).Mass Spectrometry Data Center. NIST Tandem Mass Spectral Library, 2017; http://chemdata.nist.gov/mass-spc/msms-search/.
- (29).Zuniga A; Li L Anal. Chim. Acta 2011, 689 (1), 77–84. [DOI] [PubMed] [Google Scholar]
- (30).Yu D; Zhou L; Xuan Q; Wang L; Zhao X; Lu X; Xu G Anal. Chem 2018, 90 (9), 5712–5718. [DOI] [PubMed] [Google Scholar]
- (31).Laiakis EC; Mak TD; Anizan S; Amundson SA; Barker CA; Wolden SL; Brenner DJ; Fornace AJ Jr. Radiat. Res 2014, 181 (4), 350–61. [DOI] [PMC free article] [PubMed] [Google Scholar]
- (32).Contrepois K; Jiang L; Snyder M Mol. Cell. Proteomics 2015, 14 (6), 1684–95. [DOI] [PMC free article] [PubMed] [Google Scholar]
- (33).DeFelice BC; Mehta SS; Samra S; Cajka T; Wancewicz B; Fahrmann JF; Fiehn O Anal. Chem 2017, 89 (6), 3250–3255. [DOI] [PMC free article] [PubMed] [Google Scholar]
- (34).Wishart DS; Tzur D; Knox C; Eisner R; Guo AC; Young N; Cheng D; Jewell K; Arndt D; Sawhney S; Fung C; Nikolai L; Lewis M; Coutouly MA; Forsythe I; Tang P; Shrivastava S; Jeroncic K; Stothard P; Amegbey G; Block D; Hau DD; Wagner J; Miniaci J; Clements M; Gebremedhin M; Guo N; Zhang Y; Duggan GE; Macinnis GD; Weljie AM; Dowlatabadi R; Bamforth F; Clive D; Greiner R; Li L; Marrie T; Sykes BD; Vogel HJ; Querengesser L Nucleic Acids Res. 2007, 35 (Database), D521. [DOI] [PMC free article] [PubMed] [Google Scholar]
- (35).Sumner LW; Amberg A; Barrett D; Beale MH; Beger R; Daykin CA; Fan TW; Fiehn O; Goodacre R; Griffin JL; Hankemeier T; Hardy N; Harnly J; Higashi R; Kopka J; Lane AN; Lindon JC; Marriott P; Nicholls AW; Reily MD; Thaden JJ; Viant MR Metabolomics 2007, 3 (3), 211–221. [DOI] [PMC free article] [PubMed] [Google Scholar]
- (36).Yang X; Neta P; Stein SE J. Am. Soc. Mass Spectrom 2017, 28 (11), 2280–2287. [DOI] [PubMed] [Google Scholar]
- (37).Roux A; Xu Y; Heilier JF; Olivier MF; Ezan E; Tabet JC; Junot C Anal. Chem 2012, 84 (15), 6429–37. [DOI] [PubMed] [Google Scholar]
- (38).Lewis-Stanislaus AE; Li LJ Am. Soc. Mass Spectrom 2010, 21 (12), 2105–2116. [DOI] [PubMed] [Google Scholar]
- (39).European MassBank. MassBank, https://massbank.eu/MassBank/Index (accessed March 1, 2019).
- (40).HighChem LLC, Slovakia. MzCloud, https://www.mzcloud.org/ (accessed March 1, 2019).
- (41).The Metabolomics Innovation Centre (TMIC). HMDB: The Human Metabolome Database, http://www.hmdb.ca/ (accessed March 1, 2019).
Associated Data
This section collects any data citations, data availability statements, or supplementary materials included in this article.
Supplementary Materials
Table SI_1: Chemical modifications of urine compounds and fragmentation pathways (XLSX)
Table SI_2: Urine metabolite identifications in a single run (XLSX)


