Abstract
Pseudomonas aeruginosa is an important chronic suppurative otitis media (CSOM) pathogen that exhibits multiple resistances to antibiotics with increasing frequency, making patient treatment more difficult. The aim of the study is to ascertain the genetically diversity of this clinically isolated P. aeruginosa with inter simple sequence repeat (ISSR) markers. All 25 P. aeruginosa were isolated from CSOM patients by taking their ear swabs and culturing on blood agar and MacConkey agar. All strains were identified with morphological characters and biochemical testing. The antimicrobial susceptibility testing was carried out according to National Committee for Clinical Laboratory Standards. ISSR was used to study the genetic diversity of P. aeruginosa. Clinically CSOM isolated 25 P. aeruginosa were 88% Ciprofloxacin resistant and similarly resistant to other antibiotics were documented. The study has been made using ISSR marker to find out the genomic relation among the strains/populations of P. aeruginosa. The result was shown that maximum similarity (80%) was between S-11 and S-13 and minimum (28.2%) was between S-4 and S-16 with an average similarity of 53.2%. The dendogram showed a distinct separation in between all the strains/populations of P. aeruginosa. The strains/populations were broken up into two main clusters in which small one bear two strains/populations (S-4 and S-9) and another cluster have another 23 strains/populations. These 23 strains were also separated to form subcluster by having different range of small clades. The genetically diversity of pathogenic P. aeruginosa present in CSOM at our hospital indicates the coexistence different strains due to different antibiotic sensitivity patterns. The conventional culture and sensitivity methods are time consuming whereas in PCR, it will detect within 4–6 h for effective antibiotic. Basing upon the banding pattern with ISSR primers, clinicians can prescribe the effective antibiotics accordingly for CSOM patients in the same day.
Keywords: Pseudomonas aeruginosa, CSOM, Multi-resistant, ISSR, Genetical diversity
Introduction
Chronic suppurative otitis media (CSOM) is chronic inflammation of the middle ear cleft and is characterised by otorrhea, hearing loss and perforation in the tympanic membrane. The CSOM patient frequently need visit to the local physician and often prescribed multiple antibiotics in developing countries like India [1]. The CSOM has a range of clinical presentations including its common ear discharge, hearing loss to complications like fever, otalgia, vertigo, meningitis, facial nerve palsy and brain abscess. All these presentations may occur recurrently or chronically [2]. Globally, more than 700 million cases of CSOM are diagnosed each year, with 50% of affected children being under 5 years of age [3]. Recurrent CSOM occurs where a patient has 3 diagnosed CSOM episodes within 6 months or more than 4 episodes in 12 months [4] and is commonly observed in up to 65% of children by 5 years of age [4]. Irrespective of clinical presentation, CSOM is a multi-factorial disease, with many associated risk factors, including environmental, immunological deficiency, gender, age and microbial exposure [5, 6]. Several patients groups are highly susceptible to Pseudomonas aeruginosa infection with CSOM. It is also revealed that damaged mucosal epithelium at the middle ear cleft as a result of previous episodes of acute otitis media. P. aeruginosa adheres to the damaged epithelium and might form a biofilm [7]. P. aeruginosa is also incidentally causing pneumonia or bloodstream infections. P. aeruginosa pneumonia in ventilated patients is often related to mechanical injury to the respiratory epithelium, and facilitated by micro-aspiration of infected oral and gastric contents during intubation [8]. Also, primary or secondary immunodeficiency (ID) renders patients highly prone to P. aeruginosa infection. Not only is the recruitment of neutrophils a major component of the protective host response to P. aeruginosa, but T-lymphocyte-mediated immunity also appears to play an important role in host defense against P. aeruginosa [9, 10]. It is documented that > 90% P. aeruginosa were susceptible to colistin (MIC50/90, 1/2 mg/L; 99.4% susceptible), ceftazidime-avibactam (MIC50/90, 2/4 mg/L; 97.0% susceptible) and amikacin (MIC50/90, 2/8 mg/L; 97.0/93.0% susceptible [CLSI/EUCAST]). The addition of avibactam to ceftazidime increased the percentage of susceptible P. aeruginosa isolates from 84.3 to 97.0%. Multidrug (MDR) and extensive-drug resistance (XDR) phenotypes were observed among 1151 (15.4%) and 698 (9.4%) isolates, respectively; and ceftazidime-avibactam inhibited 82.1 and 75.8% of these isolates at ≤ 8 mg/L, respectively [11]. P. aeruginosa and MDR P. aeruginosa showed a very high resistance to fosfomycin (community-acquired vs. nosocomial-acquired) (81.0 vs. 84.2; 0 vs. 85.7%). A similar resistance pattern was seen with ciprofloxacin (35.2 vs. 24.0; 70.4 vs. 61.5%), levofloxacin (34.6 vs. 24.5; 66.7 vs. 64.3%), ceftazidime (15.9 vs. 30.9; 33.3 vs. 61.5%), piperacillin (24.2 vs. 29.9; 44.4 vs. 57.1%), imipenem (28.6 vs. 27.3; 55.6 vs. 50.0%), piperacillin and tazobactam (23.1 vs. 28.6; 44.4 vs. 50.0%), tobramycin (28.0 vs. 17.2; 52.0 vs. 27.3%), gentamicin (26.4 vs. 18.2; 44.4 vs. 21.4%), and meropenem (20.2 vs. 20.3; 42.3 vs. 50.0%) [12]. P. aeruginosa is frequently isolated bacteria from CSOM.As there are increasing resistance of antibiotic in chronic suppurative otitis media, we want to observe the most sensitive antibiotic pattern in present day clinical practice. Along with, the genetically diversity of this clinically isolated P. aeruginosa with inter simple sequence repeat (ISSR) markers were observed i.e. what is the different between them in genetically.
Materials Methods
Isolation and Identification of the Bacterium
Clinical samples were collected for the isolation of pathogenic P. aeruginosa from patients of outpatient departments (OPD) of Otorhinolaryngology and peripheral community health center (city including slums and adjoining villages), as well as patients admitted into wards, cabins and intensive care unit (ICU). With prescribed safety precautions, samples were transported and processed without delay. Little lots of samples were cultured in blood agar and MacConkey agar for 18–24 h for isolation and identification of the bacterium P. aeruginosa (Fig. 1) [13–15]. The standard strain of P. aeruginosa, National Collection of Type Cultures (NCTC) strain no. 10662 (β-lactamase negative), was used as the reference control.
Fig. 1.
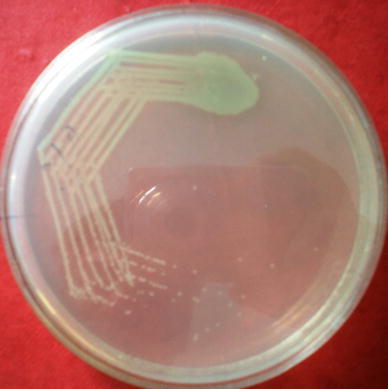
Pure culture of P. aeruginosa on nutrient agar
Antibiotic Sensitivity Test
All strains of P. aeruginosa including the standard strain were subjected to antibiotic sensitivity tests by the disc diffusion method (Table 1, Fig. 2) [16]. These were examined for zones of inhibition around each disc following the standard antibiotic susceptibility chart of the National Committee for Clinical Laboratory Standards (NCCLS) guidelines [17].
Table 1.
Antibiotic sensitivity pattern of 25 P. aeruginosa isolated from CSOM
| P. aeruginosa | CL | IPM | TOB | DOR | CTX | CIP | CXM | TGC | PB | CAZ | CFS | MRP | LE | CIT | NET | IC |
|---|---|---|---|---|---|---|---|---|---|---|---|---|---|---|---|---|
| 1 | R | S | S | S | S | R | S | R | R | R | R | R | R | R | R | R |
| 2 | S | S | S | R | S | R | R | R | S | R | R | R | R | R | R | R |
| 3 | S | R | S | R | R | R | R | R | R | S | R | R | R | R | R | R |
| 4 | R | R | S | R | R | R | R | S | R | I | R | S | S | R | R | R |
| 5 | S | R | S | S | R | R | R | R | S | R | R | R | R | R | R | R |
| 6 | S | R | R | R | R | R | R | R | S | R | S | R | S | R | S | R |
| 7 | R | R | S | S | R | R | S | S | S | I | S | S | S | R | S | S |
| 8 | S | R | S | S | R | R | S | R | S | R | R | S | S | R | S | S |
| 9 | S | R | S | S | R | R | S | R | S | R | R | S | S | R | S | S |
| 10 | R | R | R | R | R | R | R | R | S | R | R | R | S | R | R | S |
| 11 | S | R | R | R | R | R | R | R | S | R | R | R | S | R | R | S |
| 12 | S | R | S | S | R | R | R | R | S | R | R | S | S | S | S | S |
| 13 | S | R | S | S | R | R | R | R | R | R | R | R | S | S | S | R |
| 14 | R | R | R | S | R | R | R | S | R | R | R | R | S | S | S | S |
| 15 | R | R | R | S | R | R | R | R | R | R | R | R | S | S | S | S |
| 16 | S | S | S | S | S | R | R | R | S | R | R | S | S | R | R | R |
| 17 | S | R | R | R | S | R | R | R | S | R | R | S | S | S | R | R |
| 18 | S | R | R | R | R | R | R | R | S | R | R | R | S | S | R | R |
| 19 | S | R | R | R | R | R | R | R | S | R | R | S | S | S | R | R |
| 20 | S | R | R | R | R | R | R | R | S | R | S | R | S | S | R | R |
| 21 | S | R | S | R | R | R | R | R | R | R | R | S | S | S | R | R |
| 22 | S | S | S | R | R | R | R | R | R | R | R | S | S | S | R | R |
| 23 | R | R | R | R | R | S | R | S | R | R | S | S | R | R | R | S |
| 24 | R | R | R | R | R | S | R | S | R | S | S | S | R | R | R | S |
| 25 | R | R | R | R | R | S | S | R | R | S | S | S | R | R | R | S |
| R | 13 | 21 | 12 | 15 | 21 | 22 | 20 | 19 | 11 | 20 | 19 | 12 | 7 | 15 | 17 | 14 |
| S | 12 | 4 | 13 | 10 | 4 | 3 | 4 | 5 | 14 | 2 | 5 | 13 | 18 | 10 | 8 | 11 |
| R% | 52 | 84 | 48 | 60 | 84 | 88 | 80 | 76 | 44 | 80 | 76 | 48 | 28 | 60 | 68 | 56 |
CL Colistin10; IPM Imipenem10; TOB Tobramycin30; DOR Doripenem10; CTX Cefotaxime5; CIP Ciprofloxacin5; CXM Cefuroxime30; TGC Tigecyclin15; PB Polymyxin-B300u; CAZ Ceftazidime 10; CFS Cefoperazone/Sulbactam50/50; MRP Meropenem10; LE Levofloxacin5; CIT Ceftriaxone/Tazobactam 30/10; NET Netillin10; IC Imipenem/Cilastin10/10 (All antibiotics are in mcg unit)
Fig. 2.
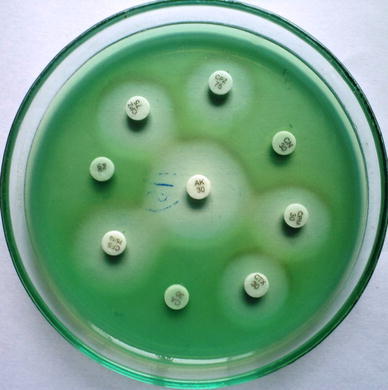
Antibiotic sensitivity pattern of P. aeruginosa
DNA Isolations, Amplifications and Image Documentations
All the 25 MDR P. aeruginosa are used for DNA isolations. The DNA isolation was carried out with HiMedia Kit methods. A good quantity of (200–600 ng) DNA was observed in all the 25 MDR bacteria (Fig. 3). For DNA amplification, 25 µL reaction was prepared with 2.5 µL 10 × buffer, 0.5 µL (200 µM), ISSR Primers 1 µL (300 ng), Taq polymerase enzyme 1 unit, DNA template 2 µL(100 ng) and 25 µL volume makeup was done with sterile distilled water. The PCR reaction in a thermocycler for 35 cycles was carried out. Then horizontal electrophoresis was done with 1.5% agarose gel in 1X TAE buffer. The gel documentation was done with Gel doc (Fig. 4). ISSR has only recently been developed as an anonymous, Random Amplification of Polymorphic DNA (RAPDs)like approach that accesses variation in the numerous micro satellite regions dispersed throughout the various genomes (particularly the nuclear genome) and circumvents the challenge of characterizing individual loci that other molecular approaches require. Micro satellites are very shot (usually 10–20 base pair) stretchers of DNA that are “hyper variable,” expressed as different variants within populations and among different species. They are characterized by mono, di, or trinucleotide repeats, e.g., AA…, or AG…, CAG…, that have 4–10 repeat units side by side. In ISSRs, we specifically target the di- and trinucleotide repeat types of microsatellite, because these are characteristic of the nuclear genome.
Fig. 3.
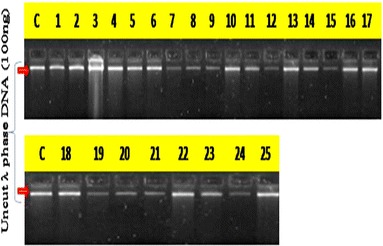
Quantification of isolated DNA from 25 P. aeruginosa by eye estimation with control (C) uncut λ phase DNA (100 ng)
Fig. 4.
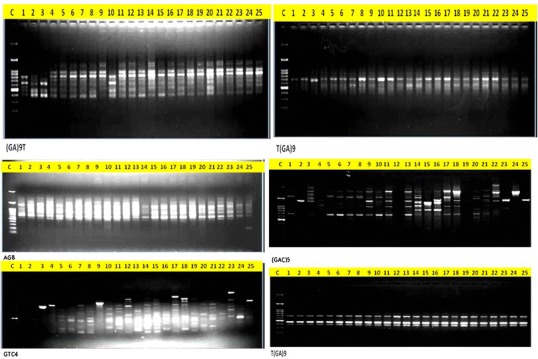
Amplification of DNA with different ISSR primers
Scoring of the Data
The data was scored as “1” for the presence and “0” for the absence of the band for each primer genotype combination for ISSR analysis. All the bands were considered to avoid over/under estimation of genetic similarity [18]. The data entry was done into a binary matrix as discrete variables.
Statistical Analysis of Data
Jaccard’s coefficient of similarity [19] was measured and phylogram based on similarity coefficients generated by unweighted pair group method using arithmetic averages (UPGMA) [20] and the Sequential agglomerative hierarchical non-overlapping (SAHN) clustering was obtained. It is known for arbitrary dissimilarity measures. Most informative primers were obtained by comparing all the primers with that of the pooled data using Mantel Z statistics [21]. Most informative primers were used for diagrammatic representation of banding pattern of 25 individuals of P. aeruginosa. The entire analysis was performed using statistical package NTSYSpc2.0e [22]. Resolving power of the ISSR primers were calculated as per the previous method [23]. Resolving power was calculated as RP = ∑IB (IB = Band informativeness) = 1 − [2 * (0.5 − p)], P is the proportion of the 25 samples containing the band. The primer index (PI) was calculated from the polymorphic information content. Polymorphic information content (PIC) was calculated as PIC = 1 − ∑P2i, Pi is the band frequency of the ith allele [24]. In the case of dendogram analysis and phylogenetic tree, the PIC was considered to be 1 − p2− q2, where p is the band frequency and q is no band frequency [25].
Dendogram
A dendrogram is a tree diagram often used to illustrate the arrangement of the clusters produced by hierarchical clustering. Dendrograms are often used in computational biology to illustrate the clustering of genes or samples, sometimes on top of heatmaps. Here, with this analysis we found the different clusters among the 25 antibiotic sensitivity pattern P. aeruginosa isolated from CSOM.
Jaccard’s Coefficient of Similarity
It is a statistic used for comparing the similarity and diversity of sample sets.
SAHN
Sequential agglomerative hierarchical non-overlapping (SAHN) clustering was obtained. It is known for arbitrary dissimilarity measures.
Result
Among the 25 strains of P. aeruginosa 52% were resistant to antibiotic colistin which is the last antibiotics for the twenty-first century. Similarly, resistance pattern of other antibiotics documented (Table 1). Different antibiotic resistance of 25 P. aeruginosa strains are taken in this study and DNA are isolated in individual strains. There are 20 different ISSR primers are used to know the genetically diversity among the 25 P. aeruginosa (Table 2).
Table 2.
ISSR primers and their annealing temperatures
| Sl no. | ISSR primers | Annealing temperature (°C) |
|---|---|---|
| 1. | (GTGC)4 | 61.9 |
| 2. | (GACAC)4 | 58.3 |
| 3. | (CT)8G | 46.8 |
| 4. | (AG)8 | 44.7 |
| 5. | (GTG)5 | 53.1 |
| 6. | (GGA)4 | 42.8 |
| 7. | (GAC)5 | 52.6 |
| 8. | (GACA)4 | 47.4 |
| 9. | (GA)9T | 48.8 |
| 10. | (CTGC)4 | 60.4 |
| 11. | (GA)8G | 46.5 |
| 12. | A(CT)8 | 47.0 |
| 13. | (GCT)8 | 69.5 |
| 14. | (AGG)6 | 57.5 |
| 15. | T(GA)9 | 50.2 |
| 16. | (CT)8A | 44.7 |
| 17. | G(CT)8 | 48.8 |
| 18. | (CCA)5 | 54.8 |
| 19. | (CGA)4 | 46.5 |
| 20. | (GACA)4G | 49.0 |
A Adinine; G Guanine; C Cytosine; T Thyamine
Jaccard’s Similarity Coefficient
On the basis of ISSR marker data Jaccard’s similarity coefficient was calculated and it was found that maximum (80%) correlation existed between populations of P. aeruginosa (S-11 and S-13) and 76.7% between P. aeruginosa (S-12 and S-15) which is found second and minimum between P. aeruginosa (S-4 and S-16) which is 28.2%. All other P. aeruginosa were correlated with each other with an average similarity of 55.0% (Fig. 5).
Fig. 5.
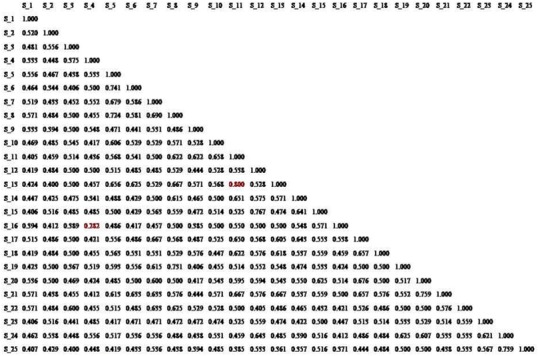
Dendogram analysis with banding pattern 25 DNA isolated from P. aeruginosa
Genomic Relationship as Revealed from the Dendogram
The dendogram (Fig. 6) divided the 25 P. aeruginosa of sample name into two distinct clusters of 23 and 2. The smaller cluster contained only two P. aeruginosa S-4 and S-9 which is separated from other 23 distinctly and the larger cluster with 23 other P. aeruginosa also divided into small clades where 2–4 P. aeruginosa and linked with each other in a single node. Both the groups shared a common node at 46% level of similarity. The smaller cluster had S-4 and S-9 with 55% of similarity. That larger group (23 P. aeruginosa) had also divided into two sub-cluster in which one cluster contained less samples (4 P. aeruginosa) and other larger group had 19 P. aeruginosa. The correlation among the 19 P. aeruginosa group had shown maximum similarity among each other than the smaller group.
Fig. 6.
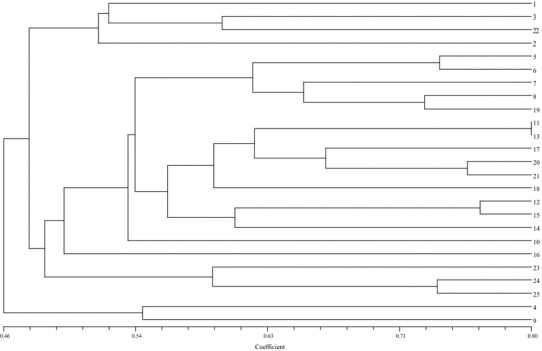
Phylogenetic tree, relationship among these 25 isolated P. aeruginosa isolated from CSOM
Discussion
Chronic suppurative otitis media (CSOM) is major health burden in the community. Clinician often fails to treat the pathogen due to different resistance pattern of bacteria like Pseudomonas aeruginosa. In this study, we have determined the genetic diversity of Pseudomonas aeruginosa strains isolated from CSOM, using ISSR analysis. The results were compared with those of antibiograms based on NCCLS. The goal of strain typing studies is to provide laboratory evidence that the epidemiologically related isolates collected during an outbreak of disease are also related genetically and thus represent the same strain. This information is helpful for understanding and controlling the spread of disease in hospital and communities [26]. In agreement with other studies, there was substantial diversity among the strains. The large numbers of genotypes suggests that most P. aeruginosa strains were derived from the patients themselves, according to the literatures [27, 28]. In this study, a few genetically related isolates detected were mostly from the different antibiotic resistant strains isolated from CSOM. However, in this study 25 strains of P. aeruginosa, 88% were resistant to ciprofloxacin which are commonly used for CSOM patients. All the 25 P. aeruginosa were isolated from CSOM and they were showing different antibiotics resistant patterns. We also had multiple different genotypes of Pseudomonas. Computer analysis of banding pattern revealed different groups of genetically related P. aeruginosa. Discrepancies were present in results of computer analysis and visual observation, which have been present in other studies as well [29]. For example, cluster four was similar at visual exam (Fig. 6), but showed 90% homology by computer analysis. To identify whether the genetically related P. aeruginosa are also epidemiologically related, in addition to comparison of the eye observation (visual exam) and Gel-Comparison, epidemiologic information should also be included [28]. ISSR method is recommended as an excellent screening method for many P. aeruginosa; this has had comparable results with the Pulsed-field gel electrophoresis (PFGE) reference method which is very expensive and time consuming [28, 30, 31]. The choice of primers for use in ISSR analysis is one of the most critical factors. We used 20 ISSR primers to observe the genetically variations among 25 isolated P. aeruginosa. In literatures, it was found that these primers were used in other studies and had comparable results with PFGE method [32]. No association was observed between genotype and antibiotype as isolates of the same genotype displayed different antibiotype and vice versa, as already shown by others [33]. The most effective antibiotic agent in our study was Levofloxacin, followed by Polymyxin-B300u although we are frequently using Ciprofloxacin in treatment of CSOM. The incidence of resistance is dependent on the patterns of antibiotic usage and is different in other countries. Sader et al. [34], in a multi-centric study, performed in Brazil, showed that Imipenem is the most active agent against P. aeruginosa followed by Ciprofloxacin. Although the accessory genome data obtained for the isolates cannot be used to identify specifically the antibiotic resistance patterns for CSOM, the reasons why isolates differed according to the various genotyping methods, variations among strains were apparent that could potentially impact on methods such as ISSR. We also observed a greater carriage of the genomic islands represented on CSOM isolates. However, this does not preclude the possibility that the P. aeruginosa isolates carried alternative unrelated islands that were not represented on the ISSR, as was shown to be the case for the genome-sequenced isolates [35]. The variation within the CSOM isolates does suggest that some divergence has occurred, even though there has not been much impact on the ability of the genotyping methods to identify them as clonal. In the context of CSOM infections, genotype-based surveillance of P. aeruginosa strains is crucial if emerging transmissible strains are to be identified before they become widespread. However, our study demonstrated that regular surveillance would be advisable in order to identify genuine transmissible strains, and that the use of ISSR in this context may be misleading.
Conclusions
With ISSR primers, P. aeruginosa DNA amplification using PCR found genetic diversity among these isolates, suggesting that cross-contamination is not very frequent in the studied hospital. ISSR primer has good discriminatory power and reproducibility which allow an understanding of the genetically variation of these bacteria in the studied CSOM patients. The conventional culture and sensitivity methods are time consuming (3–5 days) for knowing the effective antibiotics. But in PCR, it will detect within 4–6 h. Here, basing upon the banding pattern with ISSR primers, clinicians can prescribe the effective antibiotics accordingly for CSOM patients in the same day.
Acknowledgement
This work was supported by the NPDF research project file no PDF/2016/000772 on CSOM, from SERB, DST, Govt. of India, New Delhi.
Appendix: Biochemical Identification Tests
The confirmatory biochemical tests done were positive in oxidase test and the growth of colonies in King’s media. The oxidase reaction was carried out on an oxidase disc (HiMedia, disc number DD018) with an isolated colony; a change of the colour of the disc to deep purple strictly within 5–10 s at 25–30 °C was used for a confirmation of the presence of oxidase enzyme. Further, the bacterium was grown in King’s A agar medium, for pyocyanin production, which was observed after 24 h of growth. It was confirmed that blue-green pyocyanin pigments grown in King’s A medium were soluble in traces of chloroform and were found to diffuse into the surrounding medium. When the colonies confluent growth of green colonies of P. aeruginosa on nutrient agar were further grown in King’s B agar medium, fluorescein (pyoverdin) imparting a yellow tinge to the culture was observed and the coloured material was insoluble in chloroform but soluble in water; bacterial colonies developed bright red pyorubin, which was found to be water-soluble. No pyocyanin, a brown to black pigment, was seen in any of the King’s media. These tests confirmed the isolation of strains of P. aeruginosa.
References
- 1.Cripps AW, Kyd J. Bacterial otitis media: current vaccine development strategies. Immunol Cell Biol. 2003;81(1):46–51. doi: 10.1046/j.0818-9641.2002.01141.x. [DOI] [PubMed] [Google Scholar]
- 2.Kong K, Coates HLC. Natural history, definitions, risk factors and burden of otitis media. Med J Aust. 2009;191(9):s39–s43. doi: 10.5694/j.1326-5377.2009.tb02925.x. [DOI] [PMC free article] [PubMed] [Google Scholar]
- 3.Monasta L, Ronfani L, Marchetti F, Montico M, Brumatti LV, Bavcar A, et al. Burden of disease caused by otitis media: systematic review and global estimates. PLoS ONE. 2012;7(4):1–12. doi: 10.1371/journal.pone.0036226. [DOI] [PMC free article] [PubMed] [Google Scholar]
- 4.Rovers MM. The burden of otitis media. Vaccine. 2008;26(suppl 7):G2–G4. doi: 10.1016/j.vaccine.2008.11.005. [DOI] [PubMed] [Google Scholar]
- 5.Physicians AA. Otitis media with effusion. Pediatrics. 2004;113:1412–1429. doi: 10.1542/peds.113.5.1412. [DOI] [PubMed] [Google Scholar]
- 6.Massa HM, Cripps AW, Lehmann D. Otitis media: viruses, bacteria, biofilms and vaccines. Med J Aust. 2009;191(9):s44–s49. doi: 10.5694/j.1326-5377.2009.tb02926.x. [DOI] [PMC free article] [PubMed] [Google Scholar]
- 7.Wang EW, Jung JY, Pashia ME, Nason R, Scholnick S, Chole RA. Otopathogenic Pseudomonas aeruginosa strains as competent biofilm formers. Arch Otolaryngol Head Neck Surg. 2005;131:983–989. doi: 10.1001/archotol.131.11.983. [DOI] [PubMed] [Google Scholar]
- 8.Sadikot RT, Blackwell TS, Christman JW, Prince AS. Pathogen–host interactions in Pseudomonas aeruginosa pneumonia. Am J Respir Crit Care Med. 2005;171:1209–1223. doi: 10.1164/rccm.200408-1044SO. [DOI] [PMC free article] [PubMed] [Google Scholar]
- 9.Mizgerd JP, Horwitz BH, Quillen HC, Scott ML, Doerschuk CM. Effects of CD18 deficiency on the emigration of murine neutrophils during pneumonia. J Immunol. 1999;163:995–999. [PubMed] [Google Scholar]
- 10.Nieuwenhuis EE, Matsumoto T, Exley M, et al. CD1 dependent macrophage-mediated clearance of Pseudomonas aeruginosa from lung. Nat Med. 2002;8:588–593. doi: 10.1038/nm0602-588. [DOI] [PubMed] [Google Scholar]
- 11.Sader HS, Huband MD, Castanheira M, Flamm RK. Pseudomonas aeruginosa antimicrobial susceptibility results from 4 years (2012–2015) of the international network for optimal resistance monitoring program in the United States. Antimicrobial Agents Chemother. 2017;61(3):e02252-16. doi: 10.1128/AAC.02252-16. [DOI] [PMC free article] [PubMed] [Google Scholar]
- 12.Yayan J, Ghebremedhin B, Rasche K. Antibiotic resistance of Pseudomonas aeruginosa in pneumonia at a single University Hospital Center in Germany over a 10-year period. PloS ONE. 2015;10(10):e0139836. doi: 10.1371/journal.pone.0139836. [DOI] [PMC free article] [PubMed] [Google Scholar]
- 13.Forbes BA, Sahm DF, Weissfeld AS. Bailey and Scott’s diagnostics in microbiology. Maryland Heights: Elsevier; 2002. pp. 1–783. [Google Scholar]
- 14.Pseudomonas PT, Parker T, Leslie M, Collier H, editors. Principles of bacteriology, virology and immunology. 8. New York: Edward Arnold; 1990. pp. 255–273. [Google Scholar]
- 15.Sahu MC, Dubey D, Rath S, Debata NK, Padhy RN. Multidrug resistance of Pseudomonas aeruginosa as known from surveillance of nosocomial and community infections in an Indian teaching hospital. J Publ Health. 2012;20(4):413–423. doi: 10.1007/s10389-011-0479-2. [DOI] [Google Scholar]
- 16.Bauer AM, Kirby WMM, Sherris JC, Turck M. Antibiotic susceptibility testing by a standardized single disk method. Am J Clin Pathol. 1966;45:493–496. doi: 10.1093/ajcp/45.4_ts.493. [DOI] [PubMed] [Google Scholar]
- 17.Wayne PA. National committee for clinical laboratory standards. Perform Stand Antimicrobial Disc Suscept Test. 2002;12:01–53. [Google Scholar]
- 18.Gherardi M, Mangin B, Goffinet B, Bonnet D, Huguet T. A method to measure genetic distance between allogamous populations of alfalfa (Medicago sativa) using RAPD molecular markers. Theor Appl Genet. 1998;96(3–4):406–412. doi: 10.1007/s001220050756. [DOI] [PubMed] [Google Scholar]
- 19.Real R, Vargas JM. The probabilistic basis of Jaccard’s index of similarity. Syst Biol. 1996;45(3):380–385. doi: 10.1093/sysbio/45.3.380. [DOI] [Google Scholar]
- 20.Kumar S, Tamura K, Nei M. MEGA molecular evolutionary genetics analysis software for microcomputers. Bioinformatics. 1994;10(2):189–191. doi: 10.1093/bioinformatics/10.2.189. [DOI] [PubMed] [Google Scholar]
- 21.Mantel N. The detection of disease clustering and a generalized regression approach. Cancer Res. 1967;27(2 Part 1):209–220. [PubMed] [Google Scholar]
- 22.Rohlf FJ (1997) NTSYS-pc version 2.0. Exeter Software, Applied Biostatistics Incorporated
- 23.Prevost A, Wilkinson MJ. A new system of comparing PCR primers applied to ISSR fingerprinting of potato cultivars. Theor Appl Genet. 1999;98(1):107–112. doi: 10.1007/s001220051046. [DOI] [Google Scholar]
- 24.Smith JS, Chin EC, Shu H, Smith OS, Wall SJ, Senior ML, Mitchell SE, Kresovich S, Ziegle J. An evaluation of the utility of SSR loci as molecular markers in maize (Zea mays L.): comparisons with data from RFLPs and pedigree. Theor Appl Genet. 1997;95(1–2):163–173. doi: 10.1007/s001220050544. [DOI] [Google Scholar]
- 25.Ghislain M, Zhang D, Fajardo D, Huamán Z, Hijmans RJ. Marker-assisted sampling of the cultivated Andean potato Solanum phureja collection using RAPD markers. Genet Resour Crop Evol. 1999;46(6):547–555. doi: 10.1023/A:1008724007888. [DOI] [Google Scholar]
- 26.Tenover FC, Arbeit RD, Goering RV, Mickelsen PA, Murray BE, Persing DH, Swaminathan B. Interpreting chromosomal Mohammad Taheri Z, et al. 39. Tanaffos. 2008;7(1):32–39. [Google Scholar]
- 27.Speijer H, Savelkoul PH, Bonten MJ, Stobberingh EE, Tjhie JH. Application of different genotyping methods for Pseudomonas aeruginosa in a setting of endemicity in an intensive care unit. J Clin Microbiol. 1999;37(11):3654–3661. doi: 10.1128/jcm.37.11.3654-3661.1999. [DOI] [PMC free article] [PubMed] [Google Scholar]
- 28.Anthony M, Rose B, Pegler MB, Elkins M, Service H, Thamotharampillai K. Genetic analysis of Pseudomonas aeruginosa isolates from the sputa of Australian adult cystic fibrosis patients. J Clin Microbiol. 2002;40(8):2772–2778. doi: 10.1128/JCM.40.8.2772-2778.2002. [DOI] [PMC free article] [PubMed] [Google Scholar]
- 29.BAILEY & SCPTT’S. Diagnostic microbiology, 10th ed. Mosby
- 30.Loureiro MM, de Moraes BA, Mendonca VL, Quadra MR, Pinheiro GS, Asensi MD. Pseudomonas aeruginosa: study of antibiotic resistance and molecular typing in hospital infection cases in a neonatal intensive care unit from Rio de Janeiro City, Brazil. Mem Inst Oswaldo Cruz. 2002;97(3):387–394. doi: 10.1590/S0074-02762002000300020. [DOI] [PubMed] [Google Scholar]
- 31.Renders N, Römling Y, Verbrugh H, van Belkum A. Comparative typing of Pseudomonas aeruginosa by random amplification of polymorphic DNA or pulsed-field gel electrophoresis of DNA macrorestriction fragments. J Clin Microbiol. 1996;34(12):3190–3195. doi: 10.1128/jcm.34.12.3190-3195.1996. [DOI] [PMC free article] [PubMed] [Google Scholar]
- 32.Campbell M, Mahenthiralingam E, Speert DP. Evaluation of random amplified polymorphic DNA typing of Pseudomonas aeruginosa. J Clin Microbiol. 2000;38(12):4614–4615. doi: 10.1128/jcm.38.12.4614-4615.2000. [DOI] [PMC free article] [PubMed] [Google Scholar]
- 33.Pujana I, Gallego L, Martín G, López F, Canduela J, Cisterna R. Epidemiological analysis of sequential Pseudomonas aeruginosa isolates from chronic bronchiectasis patients without cystic fibrosis. J Clin Microbiol. 1999;37(6):2071–2073. doi: 10.1128/jcm.37.6.2071-2073.1999. [DOI] [PMC free article] [PubMed] [Google Scholar]
- 34.Sader HS. Antimicrobial resistance in Brazil: comparison of results from two multicenter studies. Braz J Infect Dis. 2000;4(2):91–99. [PubMed] [Google Scholar]
- 35.Stewart RM, Wiehlmann L, Ashelford KE, Preston SJ, Frimmersdorf E, Campbell BJ, Neal TJ, Hall N, Tuft S, Kaye SB, Winstanley C. Genetic characterization indicates that a specific subpopulation of Pseudomonas aeruginosa is associated with keratitis infections. J Clin Microbiol. 2011;49(3):993–1003. doi: 10.1128/JCM.02036-10. [DOI] [PMC free article] [PubMed] [Google Scholar]


