

Abstract
Low-dose computed tomography (CT) lung cancer screening is recommended by the US Preventive Services Task Force for high lung cancer–risk populations. In this study, we investigated an important factor affecting the CT dose—the scan length, for this CT exam. A neural network model based on the “UNET” framework was established to segment the lung region in the CT scout images. It was trained initially with 247 chest X-ray images and then with 40 CT scout images. The mean Intersection over Union (IOU) and Dice coefficient were reported to be 0.954 and 0.976, respectively. Lung scan boundaries were determined from this segmentation and compared with the boundaries marked by an expert for 150 validation images, resulting an average 4.7% difference. Seven hundred seventy CT low-dose lung screening exams were retrospectively analyzed with the validated model. The average “desired” scan length was 252 mm with a standard deviation of 28 mm. The average “over-range” was 58.5 mm or 24%. The upper boundary (superior) on average had an “over-range” of 17 mm, and the lower boundary (inferior) on average had an “over-range” of 41 mm. Further analysis of this data showed that the extent of “over-range” was independent of acquisition date, acquisition time, acquisition station, and patient age, but dependent on technologist and patient weight. We concluded that this machine learning method could effectively support quality control on the scan length for CT low-dose screening scans, enabling the eliminations of unnecessary patient dose.
Keywords: CT lung cancer screening, CT dose, Machine learning, Convolutional neural network, Artificial neural network
Introduction
Lung cancer is the leading cause of cancer death worldwide [1]. The large-scale National Lung Screening Trial (NLST) of more than 50,000 high-risk current and former smokers reported that low-dose computed tomography (LDCT) screening could lead to a statistically significant 20% lung cancer mortality reduction [2] compared with the traditional chest radiography screening. As a result, in the USA, the United States Preventive Services Task Force (USPSTF), National Comprehensive Cancer Network (NCCN), and American Cancer Society all recommend annual LDCT screening for this high-risk population [3–5].
Radiation dose associated with CT imaging has been studied intensively. More than 50% of the radiation exposure to the population of the USA comes from medical imaging, while half of that comes from CT [6]. The measured dose from a CT scan is directly related to the imaging technique factors (kVp, mAs, filter, etc.), the patient size, and the scan length. Technique factors are carefully set and routinely monitored to optimize dose and image quality as required by accrediting agencies such as the American College of Radiology (ACR) and The Joint Commission (TJC). The patient size is a factor that cannot be modified. The final factor, scan coverage, has not been studied as much, mainly because it is not readily measured and compared with the lung length by existing software packages.
In a typical low-dose CT lung cancer screening exam, the patient will be first scanned with a “localizer” or “scout” acquisition, which is a 2D planner image in the anterior/posterior (AP) direction (Fig. 1), lateral direction, or both. The technologist will then mark the desired slice coverage from this localizer image. For CT low-dose lung cancer scanning exams, the desired coverage is from thoracic inlet to lung bases (between the red lines in Fig. 1), i.e., only the lung length as seen on the scout image(s). However, in real-life situations, the technologist usually will add a “safe margin” to the scan length to assure complete coverage. The size of this over scanning will impact the actual dose the patient receives. No previous studies have looked at the effect of over scanning on dose for this LDCT exam.
Fig. 1.
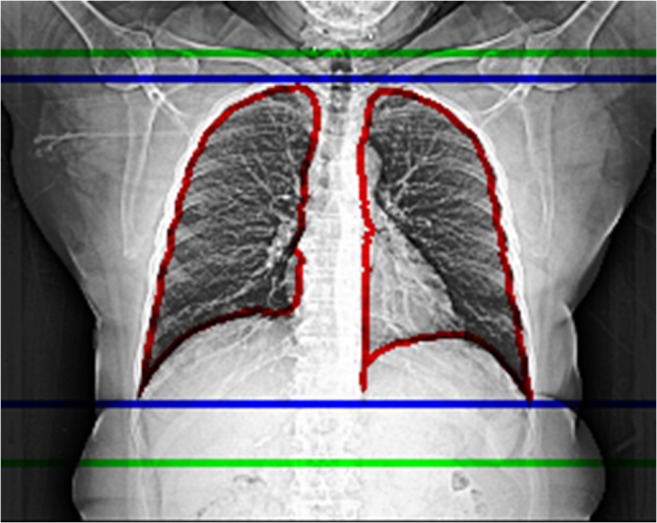
CT scout image for a 63-year-old patient. The lung segmentation from the trained model (marked with red lines), corresponding model-predicted CT scan coverage (marked with blue lines), and the actual CT scan coverage (marked with green lines). For this particular case, the desired scan coverage is 248 mm, and we observed 19.5 mm or 7.86% over-range in the upper boundary, and 47.5 mm or 19.15% over-range in the lower boundary. In total, 67 mm or 27.02% over-range is applied in this CT exam
Machine learning has been successfully applied in bioinformatics, medical imaging analysis, and natural language processing [7–9], and tremendous improvements have been observed. The fast development of machine learning techniques provided an opportunity for us to study a set of LDCT exams and analyze this important scan coverage factor. In this paper, we use a limited number of pre-segmented images to train a popular machine learning model to accurately identify the lung area and length from the localizer image. The model prediction of lung length was then compared with the actual scan coverage for all LDCT lung cancer screening exams performed between January 2015 and June 2018 in our facility. Data are further analyzed to find the key factors which may contribute to variation in scan coverage accuracy.
Materials and Methods
Clinical Images and Information
IRB approval was obtained for this HIPAA-compliant study. Seven hundred seventy LDCT lung screening exams were included in the study. All CT exams were performed at the University of Colorado Hospital between January 2015 and June 2018. The corresponding images were extracted from our Picture Archive and Communication System (PACS) using an in-house, python-based application. Study information was extracted from the hospital’s electronic medical record (EMR) system (Epic Systems Corporation, WI, USA).
For each of the CT exams, three images were extracted in Digital Imaging and Communications in Medicine (DICOM) format: the anterior-posterior (AP) localizer image and the first and last images of the spiral acquisition. The localizer images were first segmented to determine lung regions. Lung length (or “desired” scan coverage) was then calculated from this segmentation. The location information of the first and last images of the spiral acquisition was extracted from the DICOM header and used to determine the actual scan coverage.
Database queries of the EMR system were performed to retrieve clinical information, including patient age, patient weight, patient height, acquisition date and time, acquisition station, and technologist who performed the exam.
Segmentation Model and Model Training
Models were trained with a computer running Ubuntu 16.04 loaded with Keras deep learning library, with CUDA 9.1 for GPU acceleration. The computer has an Intel Xeon® processor E5-2660 processor, 16 TB hard disk space, 128 GB RAM, and 4 NVIDIA GeForce GTX 1080Ti graphics processing units (Nvidia Corporation, Santa Clara, CA).
The U-Net [10] was chosen to segment the images. The network was initially trained with the publicly available chest X-ray image dataset compiled by the Japanese Society of Radiological Technology (JSRT) [11]. This dataset contains 247 chest X-ray images and the corresponding lung-segmentation masks [12]. Initial training was performed with 100 epochs, with a learning rate of 0.001. Binary cross-entropy was selected for the loss function.
After the initial training, the model was further trained (transfer learning) with 40 randomly selected CT exams from our facility, including localizer images with the corresponding lung-segmentation masks. The masks were created by one of the authors (M.K., a certified CT technologist with 18 years of experience) through an in-house developed, python-based, software application. Transfer learning was performed with 50 epochs and a learning rate of 0.001.
All images were resized to 256 by 256 pixels for use in the training process. For both initial training and transfer learning, the images were randomly split into training sets (80%) and validation sets (20%). Real-time data augmentation was performed by applying the following random image transformations: image rotation (− 10 degree to 10 degree), image translation (25 pixels each direction), and image zooming (0–10%) for each epoch.
The output of the segmentation model is the lung mask, which has the same resolution as the input image (256 by 256 pixels). The location of the superior and inferior boundaries of the lung mask was recorded as the model predicted scan length boundaries.
Model Validation
Segmentation Accuracy
The following two metrics are used to evaluate the segmentation accuracy:
Intersection over Union (IOU): a measure of agreement between the ground truth and the estimated segmentation mask, where
-
2.
Dice coefficient: a measure of similarity between the ground truth and the segmentation mask, where
In both equations, TP, FP, and FN denote the set of pixels that are true positive, false positive, and false negative, respectively.
Scan Length Accuracy
Another validation was performed to directly test the scan length determined from the lung masks. One hundred fifty CT localizer images were randomly selected from the clinical image datasets and were shown to one of the authors (M.K.). The subject was asked to mark the upper and lower boundaries of the lung based on the best practice without safe margin. This boundary was then compared with the model predictions. The performance of the model is calculated by percentage of total error:
Statistical Analysis
The average over-range in both absolute length (mm) and in percentage of the scan length is reported. Separate results are reported for upper boundary, lower boundary, and total over-range. Standard deviation and histogram distribution for the over-range are also reported.
To analyze the factors that could possibly lead to this over-range issue, Pearson’s correlation coefficients are calculated between the percentage of over-range and factors including acquisition date, acquisition time, patient height, patient age, patient weight, and patient BMI individually. p value is reported with a two-tailed test for each correlation coefficient. Exams were performed on 3 scanners, employing 27 technologists. The ANOVA (analysis of variance) test is used to check if there is a significant difference between means by scanner or technologist. The average and standard deviation of the over-range from each are reported. To reduce the statistical error, we only included technologists who have performed more than 10 exams. A value of p < 0.05 is considered significant.
Results
Model Validation
Segmentation Accuracy
The IOU and Dice coefficients for the two models (initial training model and transfer learning model) are listed in Table 1. Significant improvement of segmentation accuracy was observed after transfer learning.
Table 1.
The IOU and Dice coefficients for models before and after transfer learning
| Before transfer learning | After transfer learning | |
|---|---|---|
| Mean IOU | 0.43 | 0.954 |
| Mean DICE | 0.522 | 0.976 |
Scan Length Accuracy
The accuracy of scan length prediction for the 150 randomly selected CT localizer images is listed in Table 2. On average, the model predicted boundary is within 2% error for the upper boundary (superior), and 3% error for the lower boundary (inferior). In total, we see the model could correctly predict the boundary of lung within 5% error.
Table 2.
Scan length accuracy
| Average error (% of scan length) | Standard deviation (% of scan length) | |
|---|---|---|
| Upper boundary | − 1.68 | 1.69 |
| Lower boundary | 2.54 | 2.31 |
| All coverage | 4.72 | 2.46 |
CT Coverage
A typical CT AP localizer image is shown in Fig. 1. The lung segmentation from the trained model (marked with red lines), corresponding model predicted CT scan coverage (marked with blue lines), and the actual CT scan coverage (marked with green lines) is also shown in Fig. 1. For this particular case, the model-predicted scan coverage is 248 mm, and we observed 19.5 mm or 7.86% over-range in the upper boundary, and 47.5 mm or 19.15% over-range in the lower boundary. In total, 67 mm or 27.02% over-range was applied in the actual CT exam for this case.
The histogram of the over-range distribution for all 770 CT exams is shown in Fig. 2, for the upper boundary, lower boundary, and total coverage, respectively. For all exams, the model-predicted lung area coverage is 252.1 mm on average with a standard deviation of 27.7 mm. The actual scan coverage is averaged at 310.6 mm with a standard deviation of 28.9 mm. We saw an average of 7% over-range scan in the upper boundary with a standard deviation of 3.1%, and an average of 16.7% over-range scan in the lower boundary with a standard deviation of 8.1%. In total, we saw an average of 23.8% over coverage with a standard deviation of 9.3%. There were no cases where a portion of the lung was excluded.
Fig. 2.

The histogram distribution for over-range of the upper boundary (a), lower boundary (b), and all coverage (c) in all 770 exams
The relationship between the percentage of over-range and the date and time of the acquisition is shown in Fig. 3 a and b. Pearson’s correlation coefficient between over-range percentage and date is − 0.0347 (p = 0.97), and the coefficient between the over-range percentage and time is − 0.00415 (p = 0.997). As one could also observe from the figures, the percentage of over-range is independent of the date, indicating the extent of over-range is consistent over the time frame of our study and is also independent of the time of the acquisition, indicating the consistency over different work shifts.
Fig. 3.

The distribution of percentage over-range over date (a) and time (b) of the acquisition. Pearson’s correlation coefficient is − 0.0347 (p = 0.97) and − 0.00415 (p = 0.997), respectively, indicating that the over-range issue does not depend on the date or time of the acquisition
Figure 4 shows the relationship between the over-range percentage and the patient height (a), age (b), weight (c), and BMI (d). Pearson’s correlation coefficients are − 0.0179 (p = 0.73), − 0.0203 (p = 0.57), 0.3027 (p < 0.001), and 0.3415 (p < 0.001), respectively, indicating that the over-range issue does not correlate with the patient height and age, but is weakly correlated with patient weight and BMI.
Fig. 4.

The distribution of percentage over-range over patient height (a), age (b), weight (c), and BMI (d). Pearson’s correlation coefficients are − 0.0179 (p = 0.73), − 0.0203 (p = 0.57), 0.3027 (p < 0.001), and 0.3415 (p < 0.001), respectively, indicating that the over-range issue is not correlated with the patient height and age, but correlated with patient weight and BMI
The average and standard deviation of over-range for each technologist are reported in Table 3. ANOVA test indicated that there is a statistically significant difference between different technologists’ performance (F = 4.4374, p < 0.001).
Table 3.
Technologist performance
| Technologist | Exam performed | Average error (% of scan length) | Standard deviation (% of scan length) |
|---|---|---|---|
| A | 14 | 27.62 | 11.26 |
| B | 11 | 20.14 | 5.58 |
| C | 33 | 22.80 | 7.15 |
| D | 17 | 25.28 | 7.31 |
| E | 11 | 27.75 | 11.28 |
| F | 17 | 20.07 | 8.97 |
| G | 27 | 23.30 | 7.05 |
| H | 35 | 21.40 | 7.05 |
| I | 11 | 19.13 | 6.74 |
| J | 14 | 22.52 | 6.86 |
| K | 15 | 16.22 | 7.97 |
| L | 13 | 21.51 | 9.17 |
| M | 25 | 24.80 | 6.27 |
| N | 26 | 27.59 | 8.23 |
| O | 13 | 28.01 | 6.93 |
| P | 56 | 21.08 | 9.83 |
| Q | 32 | 20.24 | 9.36 |
| R | 15 | 27.19 | 7.73 |
| S | 20 | 20.87 | 7.56 |
| T | 27 | 20.37 | 10.64 |
| U | 28 | 22.05 | 6.19 |
| V | 51 | 24.81 | 10.02 |
| W | 53 | 21.74 | 7.39 |
| X | 48 | 31.91 | 10.06 |
| Y | 12 | 23.66 | 4.90 |
| Z | 36 | 20.22 | 9.36 |
| AA | 13 | 33.50 | 11.78 |
The average and standard deviation of over-range for each scanner are reported in Table 4. ANOVA test indicated that there is no statistically significant difference between different scanners (F = 2.4746, p = 0.085).
Table 4.
Scanner performance
| Scanner | Exam performed | Average error (% of scan length) | Standard deviation (% of scan length) |
|---|---|---|---|
| A | 225 | 24.91 | 10.06 |
| B | 23 | 23.54 | 9.95 |
| C | 522 | 23.27 | 8.91 |
Discussion
Quality control is a very important aspect of medical imaging. By definition [13], it is performed and documented during equipment selection, installation, and acceptance testing, and by periodic evaluations performed by technologists or medical physicists. This “periodic evaluation” is usually composed of daily execution of a few quick phantom tests, and yearly, more comprehensive tests are performed by the medical physicists. As of now, quality control on every medical imaging exam is not practical. Technologists will do a basic image quality assessment before the exams are sent to the PACS system, but the judgment is usually very subjective. Machine learning techniques provide an opportunity to consider the possibility of doing “per exam” quality control. Machine learning could help us to evaluate patient positioning and movement, image appearance, and other factors of image quality.
In this paper, we are using machine learning to help with the quality control of CT scan length. Segmentation models based on U-Net were trained initially with chest X-ray images from a published dataset, and then transfer learning training was performed with a limited number of CT scout images from our local dataset to improve the model performance. After the model performance was validated by an experienced technologist, the model was applied to all 770 CT low-dose chest exams performed in our facility. On average, about 24% over-range was seen on LDCT exams, of which 16.7% came from the inferior border. It was further shown that the extent of over-range is weakly correlated with the patient weight and patient BMI, and is strongly dependent on the individual technologist.
CT scan length is defined in clinical CT protocols which are usually set by the radiologists. For different symptoms and indications, CT scan length could vary even for the same scan area. As an example, the “Chest Low Dose” exam, which we studied in this paper, requires the scan length to be “from thoracic inlet through lung bases,” while “Chest with Contrast” exam requires the scan length to be “from thoracic inlet through adrenals.” This may explain the performance of different technologists, since some technologists may get used to extend the scan length to adrenals even for the “Chest Low Dose” CT exams. Additional training of CT technologists should improve the performance and consistency in terms of CT scan length.
It is understandable that a CT technologist would like to leave some “safe margin” in order to make sure the coverage is complete. This “safe margin” is likely to be bigger for a large-size patient, since the localizer image may not reveal the location of the lungs as clearly as with a small-size patients. This may explain the results that the percentage of over-range is weakly correlated with the patient weight and patient BMI. However, an unnecessarily large safe margin does not provide additional information, since the low technique factors that are used in LDCT imaging make the images in the abdomen too noisy for meaningful diagnosis. The additional “safe margin” therefore increases patient dose, wastes radiologist’s interpretation time, and has no clinical benefits.
The quantitative relationship of the scan over-range with the patient dose is complicated and could be affected by many factors. In LDCT lung scans, the CTDIvol (reported based on 32-cm diameter CTDI phantom) must be smaller than 3.0 mGy for an average patient. Based on AAPM protocol recommendations [14], for an idealized standard sized patient and a 25-cm scan length, and using the k factor of 0.014 mSv/mGy*cm, it should result in an effective dose below 1 mSv. Based on this simplified calculation, for standard patients, effective dose was 24% (or close to 0.72 mGy) higher than necessary because of over-range issue. The actual dose delivered to the patient will depend on many factors, including the X-ray technique, scan length, patient size, chosen automatic exposure control (AEC) technique, over scan profile, patient position in the CT bore, or even the patient motion during the scan. Scan length is the factor that is independent of other dose factors and could be easily controlled by the operator. The efforts of reducing patient dose or improving image quality from optimizing other factors (as the community has done for the past years) will not be affected by the efforts of pursuing tighter control of the scan length. In addition, low-dose lung CT study is performed as a screening exam, and even small amount of dose reduction is meaningful when a large population is affected. The connection between the radiation dose and population health risks is reviewed in the Beir VII report [15].
Machine learning is a powerful tool and one could find other ways to apply it to the scan length measure. For this particular problem, we chose to first use a machine learning algorithm to segment the lung area, and then use trained model to calculate the scan length based on this segmentation. An alternate method could employ machine learning algorithms to directly define the scan length (or the upper and lower boundaries) from the CT localizer image. We chose the segmentation approach for two reasons: Machine learning–based segmentation has been successfully applied in the medical imaging field with great successes. Secondly, the segmentation map provided a valuable midway result to verify the accuracy of the model, and to understand the final model predictions in a meaningful way.
The accuracy of the model predictions of the scan length could be further improved. The lateral localizer view, acquired together with the AP view, could be used to define a more accurate lung extent. The 3D extent of the lung could be evaluated from the acquired axial slices to better understand the impact of patient motion (bulk motion and respiratory motion) on lung location. The segmentation model performance can also be further improved by introducing more training data. However, we believe our current results indicate that scan over-range is an important issue, and could be addressed by further technologist education.
Although we believe that the over-range is an important issue that needs to be addressed in the LDCT lung screening exams, the appropriate level of “safe margin” or over-range should really depend on the technologists’ comfort level. A follow-up study is planned to further educate technologists, and machine learning models will be used to monitor the performance improvement. Similar concepts and methods could also be applied to other CT exams including neuro and abdominal scans. Ideally, once the issues of a “safe margin” and improvements from the incorporation of the additional image data sources are reviewed, this technique could be implemented prior to scan initiation to auto-select the appropriate scan range.
Conclusions
Machine learning methods were applied to analyze the CT scan length for low-dose CT lung cancer screening exams. The model-predicted lung scan length on average is 252.1 mm with a standard deviation of 27.7 mm. In total, we see a 23.8% more scan coverage with a standard deviation of 9.3%, indicating a similar percentage (~ 20%) of potential dose savings for the patient. The percentage of over-range is weakly related with patient weight and BMI and is dependent on the individual technologist. However, it is independent of patient age, patient height, date and time of the acquisition, and the acquisition station.
Acknowledgments
This work is supported by the Radiology Pilot Grant from Department of Radiology, School of Medicine in University of Colorado. We would like to thank the PACS and clinical analysis team from University of Colorado Health for providing technology support.
Footnotes
Publisher’s Note
Springer Nature remains neutral with regard to jurisdictional claims in published maps and institutional affiliations.
References
- 1.World Health Organization: Estimated cancer incidence, mortality and prevalence worldwide in 2012. 2012.
- 2.National Lung Screening Trial Research Team: Reduced lung-cancer mortality with low-dose computed tomographic screening. N Engl J Med 365(5):395–409, 2011 [DOI] [PMC free article] [PubMed]
- 3.Moyer VA, Force USPST. Screening for lung cancer: U.S. Preventive Services Task Force recommendation statement. Ann Intern Med. 2014;160(5):330–338. doi: 10.7326/M13-2771. [DOI] [PubMed] [Google Scholar]
- 4.National Comprehensive Cancer Network: Lung Cancer Screening. 2018.
- 5.American Cancer Society: American cancer society guidelines for the early detection of cancer.
- 6.Mettler FA, Jr, et al. Radiologic and nuclear medicine studies in the United States and worldwide: frequency, radiation dose, and comparison with other radiation sources--1950-2007. Radiology. 2009;253(2):520–531. doi: 10.1148/radiol.2532082010. [DOI] [PubMed] [Google Scholar]
- 7.Cai T, Giannopoulos AA, Yu S, Kelil T, Ripley B, Kumamaru KK, Rybicki FJ, Mitsouras D. Natural language processing technologies in radiology research and clinical applications. Radiographics. 2016;36(1):176–191. doi: 10.1148/rg.2016150080. [DOI] [PMC free article] [PubMed] [Google Scholar]
- 8.Litjens G, Kooi T, Bejnordi BE, Setio AAA, Ciompi F, Ghafoorian M, van der Laak J, van Ginneken B, Sánchez CI. A survey on deep learning in medical image analysis. Med Image Anal. 2017;42:60–88. doi: 10.1016/j.media.2017.07.005. [DOI] [PubMed] [Google Scholar]
- 9.Ravi D, et al. Deep learning for health informatics. IEEE J Biomed Health Inform. 2017;21(1):4–21. doi: 10.1109/JBHI.2016.2636665. [DOI] [PubMed] [Google Scholar]
- 10.Ronneberger Olaf, Fischer Philipp, Brox Thomas. Lecture Notes in Computer Science. Cham: Springer International Publishing; 2015. U-Net: Convolutional Networks for Biomedical Image Segmentation; pp. 234–241. [Google Scholar]
- 11.Shiraishi J, Katsuragawa S, Ikezoe J, Matsumoto T, Kobayashi T, Komatsu KI, Matsui M, Fujita H, Kodera Y, Doi K. Development of a digital image database for chest radiographs with and without a lung nodule: receiver operating characteristic analysis of radiologists’ detection of pulmonary nodules. AJR Am J Roentgenol. 2000;174(1):71–74. doi: 10.2214/ajr.174.1.1740071. [DOI] [PubMed] [Google Scholar]
- 12.van Ginneken B, Stegmann MB, Loog M. Segmentation of anatomical structures in chest radiographs using supervised methods: a comparative study on a public database. Med Image Anal. 2006;10(1):19–40. doi: 10.1016/j.media.2005.02.002. [DOI] [PubMed] [Google Scholar]
- 13.Jeff Shepherd S, Lin P-JP, Boone JM, Cody DD, Fisher JR, Frey GD, Glasser H, Gray JE, Haus AG, Hefner LV, Holmes RL, Kobistek RJ, Ranallo FN, Rauch PL, Rossi RP, Seibert JA, Strauss KJ, Suleiman OH, Schenck JR, Thompson SK: Quality control in diagnostic radiology. American Association of Physicists in Medicine, 2002
- 14.American Association of Physicists in Medicine . Lung Cancer Screening CT Protocols. 2016. [Google Scholar]
- 15.National Research Council: Health risks from exposure to low levels of ionizing radiation: BEIR VII phase 2. Washington, DC: The National Academies Press, 2006, p. 422 [PubMed]