Abstract
An accurate identification of the retinal arteries and veins is a relevant issue in the development of automatic computer-aided diagnosis systems that facilitate the analysis of different relevant diseases that affect the vascular system as diabetes or hypertension, among others. The proposed method offers a complete analysis of the retinal vascular tree structure by its identification and posterior classification into arteries and veins using optical coherence tomography (OCT) scans. These scans include the near-infrared reflectance retinography images, the ones we used in this work, in combination with the corresponding histological sections. The method, firstly, segments the vessel tree and identifies its characteristic points. Then, Global Intensity-Based Features (GIBS) are used to measure the differences in the intensity profiles between arteries and veins. A k-means clustering classifier employs these features to evaluate the potential of artery/vein identification of the proposed method. Finally, a post-processing stage is applied to correct misclassifications using context information and maximize the performance of the classification process. The methodology was validated using an OCT image dataset retrieved from 46 different patients, where 2,392 vessel segments and 97,294 vessel points were manually labeled by an expert clinician. The method achieved satisfactory results, reaching a best accuracy of 93.35% in the identification of arteries and veins, being the first proposal that faces this issue in this image modality.
Keywords: Computer-aided diagnosis, Retinal image analysis, Vasculature, Artery/vein classification, Optical coherence tomography
Introduction
The human eye is an anatomical part of the body that is considered as one of the most complex organs. It is composed of different types of structures whose main function is the production of visual images that are transmitted instantaneously through the optical nerve to the brain [15]. The analysis of these structures offers a set of biomarkers that allow the identification of several pathologies that may be present in the eye fundus, as glaucoma [8], diabetic retinopathy [42, 48], sclerosis [1], or cardiovascular complications [24]. Several works studied the definition of metrics that measure the vascular morphology of the retina, particularly between arteries and veins. Among them, we can find the arterio-venular ratio (AVR). AVR measures the ratio between the arteriolar and venular diameters, and it is one of the most referenced metrics for the quantification of the changes in the retinal vascular structure [23]. An accurate and robust identification of both types of vessels is a key issue in the implementation of automatic computer-aided diagnosis (CAD) systems. These ophthalmological systems facilitate the early identification and diagnosis of different relevant pathologies and help, therefore, the doctors to make a more accurate diagnosis and treatments, reducing the consequences of incorrect or imperfect treatments as the usual side effects of unneeded medication.
In modern medicine, medical imaging involves different capture technologies that are used for the visualization of the inner body parts, tissues, or organs in order to facilitate the medical diagnosis, treatments, and the corresponding clinical monitoring [13]. In particular, in the field of ophthalmology, optical coherence tomography (OCT) plays an important role as a source of information about the retinal layers that is increasing its popularity [43]. OCT is a non-invasive imaging technique that generates, in vivo, a cross-sectional visualization of the retinal tissues in the posterior part of the eye [16]. This technique uses low-coherence interferometry to produce a two-dimensional image by sequentially collecting reflections from the lateral and longitudinal scans of the retina [36, 47]. The provided cross-sectional images are extremely useful in the identification of the different structures that are present in the human eye anatomy, such as the optic disc [33], the retinal vasculature [31], or the retinal layers [19]. The information that is provided by this image modality can help, specially, in the analysis of diseases that affect the retinal layers, as can be the epiretinal membrane, macular edema, or age-related macular degeneration [2, 32, 40].
Common procedures such as screening require a deep analysis of a large amount of visual information, implying an exhaustive and repetitive process for the clinical expert. These activities are particularly tedious in terms of time and resources that could be used, instead, to increase the quality of clinical diagnosis and patient care routines. Given the importance of this issue, many efforts were done in the development of automatic CAD tools that help and facilitate, significantly, the work of the specialists. Nowadays, many CAD systems were implemented to achieve these goals along the large variability of clinical specialities. Regarding ophthalmology, Yu et al. [51] presented a multi-screen real-time telemedicine system, allowing the collaboration between ophthalmologists from different medical centers to perform a more accurate diagnosis of a patient. Others also proposed telemedicine tools that allow the cooperation of specialists in different geographic locations, as in the works of Gómez et al. [18] or Bellazzi et al. [4]. Ortega et al. [34] implemented the SIRIUS platform, a web-based system for the analysis of classic retinographies. This framework is composed of a set of image processing algorithms that are structured as independent modules. Although most of the proposed CAD systems were developed in specific contexts, none of them considered the automatic classification of the retinal vasculature between arteries and veins using the near-infrared reflectance retinographies that are included in the OCT scans.
In the literature, we can find approaches that use different strategies to solve this problem in classical retinographies. As reference, Joshi et al. [26] designed a methodology based on graph search to identify the vessel segmentation map. Then, the arterio-venular classification is performed by means of a fuzzy C-means clustering. Rothaus et al. [39] proposed a semi-automatic method to propagate the vessel classification using anatomic characteristics of the retinal vascular structure. Additionally, they used information from hand-marked vessels to separate arteries and veins. In the work of Relan et al. [37], the authors proposed an unsupervised method using color features of the retinographies to classify arteries and veins. The vascular structure classification is performed by the use of a Gaussian mixture model-expectation maximization (GMM-EM) classifier. In another proposal, Relan et al. [38] used a least square-support vector machine (LS-SVM) classifier to automatically label the retinal vessels. Dashtbozorg et al. [12] proposed an automatic method for the artery/vein classification based on the analysis of a graph that represents the structure of the retinal vasculature. In Vázquez et al. [46], the authors proposed a framework for the automatic classification of arteries and veins using a k-means clustering. The classification results of all the connected vessels are combined by a voting system. Yang et al. [50] made use of a SVM classifier in the separation process between arteries and veins. Kondermann et al. [28] employed features that were extracted from the retinal vessel profiles with respect to their centerlines. Then, they used a classification approach based on SVM and artificial neural networks (ANN). Grisan et al. [20] suggested a new strategy for classifying vessels through the division of the eye fundus into four concentric regions of interest that are taken around the optic disc. Additionally, this method exploits features that are extracted from HSL and RGB color spaces. In the work of Xu et al. [49], the authors proposed a regularization and normalization stage to reduce the differences in the feature space of the image. These features are employed for the discrimination of arteries and veins by means of a k-nearest neighbors algorithm (k-NN). In Simó et al. [44], the authors proposed a Bayesian statistical methodology to distinguish arteries, veins, fovea, and the retinal background using image information.
In this work, we propose a complete methodology for the automatic retinal vasculature extraction and classification into arteries and veins using the near-infrared reflectance retinography images that are provided in combination with the histological sections in the OCT scans. For that purpose, we use the k-means clustering technique with feature vectors obtained from extracted vessel profiles. A post-processing stage is performed to correct the misclassified points belonging to the same vascular segment through a voting process. At the moment, no other work was proposed for this problem facing this imaging modality. This new methodology allows a more reliable analysis of the retinal microcirculation that is needed in many processes of clinical diagnosis.
The paper is organized as follows: Section “Methodology” presents the proposed methodology and the characteristics of all its stages. Section “Results and Discussion” presents some practical results and the validation of key steps of the method compared to the manual annotations of a specialist. Finally, Section “Conclusions” includes the conclusions as well as possible future lines of work.
Methodology
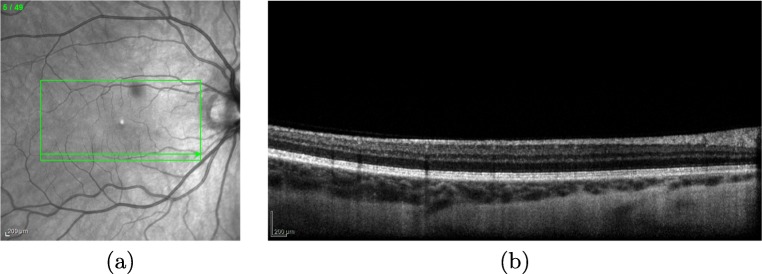
OCT images can provide detailed information about relevant anatomical structures of the retina as the one that is faced in this work, the retinal vessel tree. The OCT capture device provides a set of two different types of images: the near-infrared reflectance retinography and the consecutive histological sections, as presented in Fig. 1. In this work, the methodology receives, as input, the near-infrared reflectance retinography image to identify the vascular tree.
Fig. 1.
Example of OCT image. a Near-infrared reflectance retinography. b Histological section visualizing the information of a band in the near-infrared reflectance retinography indicated by the green arrow
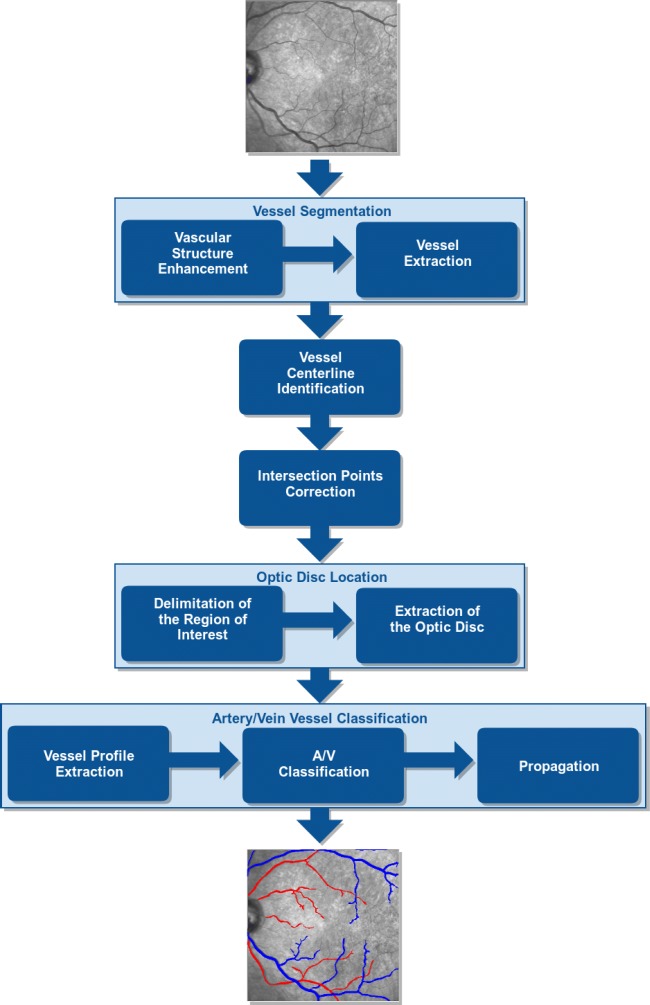
The proposed methodology, illustrated in the diagram of Fig. 2, is divided into five main stages: firstly, the retinal vascular tree is extracted from the input image; secondly, the vessel centerlines are identified as well as the intersection points of the vascular segments; a third stage, where all these intersections are analyzed and corrected; a fourth stage, where the region of the optic disc is identified and removed for the posterior analysis, given the particular characteristics of these regions that can confuse the system; and finally, the identified vessels are analyzed and classified into arteries and veins. These classifications are posteriorly propagated to correct individual misclassifications and retrieve a more coherent identification. Further details about all these stages are going to be discussed next.
Fig. 2.
Main stages of the proposed methodology
Vessel Segmentation
The first step of our methodology is the automatic extraction of the retinal vascular structure. We segment the vascular tree region that is posteriorly used as reference for the analysis and differentiation of arteries and veins. To achieve that, this stage is inspired in the method proposed by Calvo et al. [10] as a well-established a robust technique that demonstrated its suitability in classical retinographies. This strategy applies a combination of different image processing techniques to separate the retinal vascular structure from the background. The process is done in two main steps: vascular structure enhancement and extraction of the retinal vessel tree.
Vascular Structure Enhancement
Firstly, a pre-processing using a top-hat filter [14] is performed to enhance the retinal vessel tree. In addition, a median filter [22] is applied to reduce the levels of noise that these images normally present, facilitating the posterior extraction of the retinal vessels.
The vascular structure enhancement is done using a multi-scale approach [17]. In particular, geometrical tubular structures of a range of sizes are detected using the eigenvalues, λ1 and λ2, of the Hessian matrix. Thus, a function B(p) to measure a pixel p belonging to a vascular structure, is formulated by the following:
| 1 |
where Rb = λ1/λ2, c is half of the maximum Hessian norm and S measures the “second-order structures.” The pixels belonging to the vessel structures are usually characterized by small λ1 values and large positive λ2 values.
Vessel Extraction
Next, we proceed with the vasculature extraction using the enhanced and filtered OCT image. Firstly, an initial segmentation is performed using a method based on hysteresis thresholding. A hard threshold (Th) obtains pixels with a high probability of being blood vessel pixels while a weak threshold (Tw) keeps all the pixels of the vascular tree in the surrounding region. The vascular segmentation is composed by all the pixels included by Tw that are connected to at least one pixel obtained by Th. Both thresholds, Th and Tw, are calculated from two image properties: the percentage that represents the background of the OCT image and the percentage that represents the vascular tree. These thresholds are calculated using percentile values, according to the following equation:
| 2 |
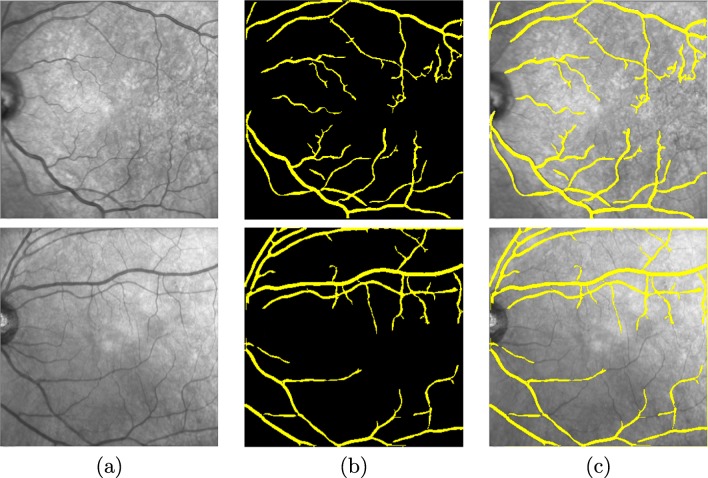
where Lj is percentile lower limit j, n illustrates the size of the data set, Fj is the accumulated frequency for j − 1 values, fj represents the frequency of percentile j, and c is the measure of the size of the percentile interval. In our case, c is equal to 1. Finally, a post-processing stage is applied to eliminate small detected elements that do not belong to the retinal vessel tree. To do that, all isolated structures that are smaller than a predetermined number of pixels are deleted. A couple of representative examples of the results of this stage are presented in Fig. 3 for a better visualization where we can observe the input image, the vessel tree segmentation, and the overlap between the result of the segmentation and the input image, respectively.
Fig. 3.
Segmentation process of the vessel tree. a Input image. b Final result after pre-processing, enhancement, hysteresis thresholding, and small structure removal stages. c Overlap between the result of the segmentation and the input image
Vessel Centerline Identification
Next, we proceed to identify the centerline of each vessel using the previous segmentation of the vessel tree.
To achieve this, we based our method in the strategy proposed by Caderno et al. [9], originally proposed in a vessel tracking context. Multilocal level set extrinsic curvature based on the structure tensor (MLSEC-ST) is used to identify creases, a type of ridge/valley structures over the intensity profiles [29], which in our case represent the skeletons of the retinal vessels by a set continuous points. Given a function , the level set for a constant l consists of the set of points {x|L(x) = l}. For 2D images (d = 2), L can be considered as a topographic relief or landscape and the level sets as its level curves. The positive maxima of the level curvature k forms ridge curves and the negative minima forms valley curves. The level curvature k is defined, according to the following:
| 3 |
where is the i th component of , the gradient vector field orthogonal to the level curves of . The gradient vector, , is defined by the following:
| 4 |
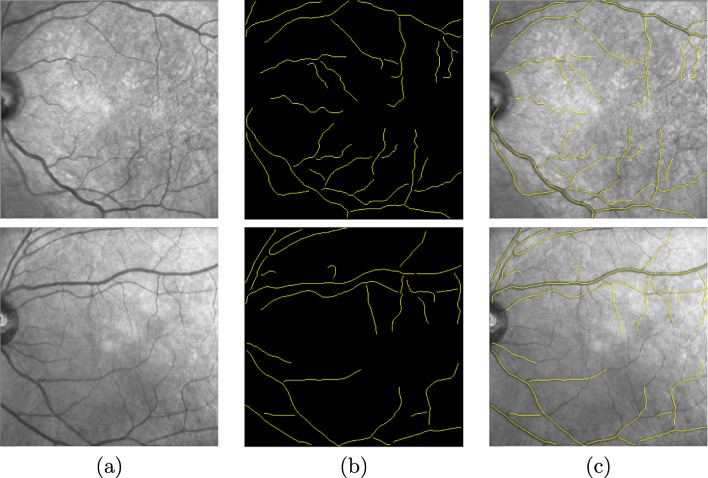
where w is the gradient vector field and Od the d-dimensional zero vector. The identification of the centerline produces the results of the skeletonization process, defining each existing vessel by two endpoints and a list of consecutive pixels. Figure 4 presents a couple of examples with results of the centerline identification and, therefore, the skeletonization process.
Fig. 4.
Vessel centerline identification. a Input image. b Skeletonized segments. c Overlap between the result of the vessel centerline and the input image
Intersection Points Correction
The crease identification using the MLSEC-TS method presents an important limitation since it is not able to correctly identify the points of intersection of the vascular structures. These characteristic points are crucial as they serve as a source of information for posterior stages of the methodology identifying adequately the continuation of each vessel. We analyze the previous skeletonization and correct all the erroneous intersections.
The aimed intersections are mainly crossovers (points where two different vessels overlap) or bifurcations (points where a vessel is divided in two). To achieve this, we based our proposal in the work of Sanchez et al. [41] where all the endpoints of the identified vessel centerline segments are analyzed to detect any existing intersection. We have the following:
Crossovers: We consider the existence of crossovers where two endpoints are significantly close to a crossing segment.
Bifurcations: When one endpoint of a segment is significantly close to any point of other segments, we consider the existence of a bifurcation.
Finally, these identified intersections are corrected using an interpolation B-splines S(u) strategy [5], defined according to as follows:
| 5 |
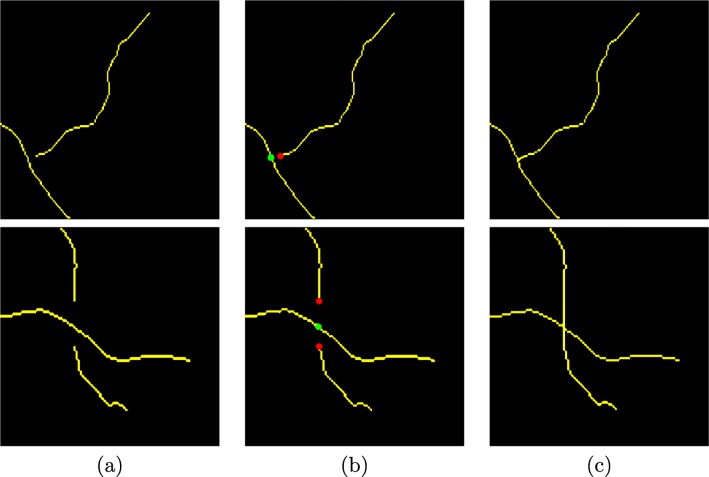
where u is the knot vectors and Pi is the i th control point of the (n + 1)th control point of the curve and Bi, m are the B-spline blending functions, which are basically polynomials of degree m − 1. The basis function Bi, m(u) is defined, in this work, by the recursion relation of Cox-de Boor [7] using an order value m = 2. Using this interpolation, we correct the intersections of the vasculature identification. Figure 5 presents representative examples of bifurcations and crossovers that were identified and corrected in this phase of the methodology.
Fig. 5.
Correction of the intersection points: (1st row, bifurcation) and (2nd row, crossing). a Input image. b Identified characteristic points: red points represent the ends of the segments and green points are points of intersection. c Corrected vascular segments
Optic Disc Location
The optic disc, also knows as the optic nerve head, is a round-like area in the back of the eye, bright and composed mainly of the optic nerve fibers [25]. This anatomical structure is commonly identified by the location of the area with the highest variation of intensities of adjacent pixels in the retinal images. Such variation is a consequence of the appearance of structures that are present in the fundus of the human eye, bright in the optic nerve fibers and dark in the retinal vessels [45]. This scenario can alter the characteristics of the visualization of the vessel structures and cause misclassifications in the posterior phase of identification of the retinal vessels as arteries or veins. Based on that, we locate the region of the optic disc with the aim of the elimination of its containing vessel detections and avoid possible misclassifications. To identify the optic disc, we implemented an algorithm based on the work proposed by Blanco et al. [6], given its simplicity and adequate results for this issue. The process is divided into two steps: delimitation of the region of interest and optic disc extraction.
Delimitation of the Region of Interest
We based our strategy on the concept that the optic disc has higher intensity values than the retinal background or other retinal structures. Basically, the main idea of the method is to find the largest cluster of pixels with the highest gray levels. To do that, the method selects the 5% of the pixels in the image that have the highest intensity values. Initially, each pixel represents a centroid and if the Euclidean distance between two centroids is less than a certain value these centroids, and their corresponding clusters, are combined into a single one. The new centroid Croi is calculated as follows:
| 6 |
where (xi, yi) is the spatial coordinates of each cluster point and n is the number of points of the cluster. The region of interest of the optic disc is delimited by a rectangle whose center is defined by the centroid of the cluster.
Extraction of the Optic Disc
Once the region of interest that contains the optic disc is calculated, we proceed to identify its exact position in the image. The method searches for circular edges within the region of interest that represents the structural morphology of the optic disc, as indicated, given its approximately circular shape. In this work, these edges are calculated using the Canny edge detector [11]. Then, we search for circular borders using the fuzzy circular Hough transform [35]. The purpose of this technique is to group the points belonging to edges into candidates for circular shapes by performing a voting procedure on a set of parameters of the equation of the circle C, defined by the following:
| 7 |
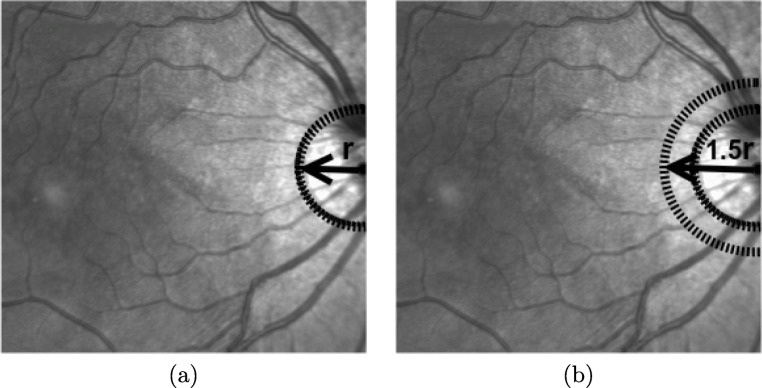
where (a, b) are the coordinates of the center of the circle, (xi, yi) identify the coordinates of each point in the region of interest, and r represents the radius of the circle. A Hough accumulator array δ(a, b, r) is introduced to store all the entries corresponding to the parameter space. A voting process is done where each pixel (xi, yi) votes for the set of centers (a, b) and the corresponding radio r that are contained in the region of interest. The position of the local maxima in the Hough accumulator array, δ(a, b, r), represents the center (a, b) and radius r of the aimed optic disc. Figure 6 a shows an example of the extraction of the optic disc.
Fig. 6.
Example of the optic disc location. a Optic disc detection, where r represents the radius of the optic disc. b Circular region around of the optic disc with radius of 1.5 × r, to remove the brightness contiguous zone in the image
In many cases, the OCT images may include significant bright intensities in the contiguous region to the optic disc that can interfere directly in the process of classification of the vascular structure. To avoid this situation, we used the optic disc identification to remove a larger region and avoid this complex situation. In particular, we remove a circular zone centered on the optic disc with a radius of 1.5 × r, where r is the identified radius of the optic disc, as shown in the example of Fig. 6b.
Artery/Vein Vessel Classification
Finally, we perform the automatic classification of the identified retinal vessels separating arteries and veins. To achieve this goal, we divided this phase of the methodology into three steps: Firstly, we obtain the vessel profiles and calculate the features of the identified vascular segments that are used in the classification process. Then, we perform the differentiation of the vessels between arteries and veins by the use of machine learning techniques. And finally, the anatomical information provided by the vessels is used to propagate and correct any existing misclassification.
Vessel Profile Extraction
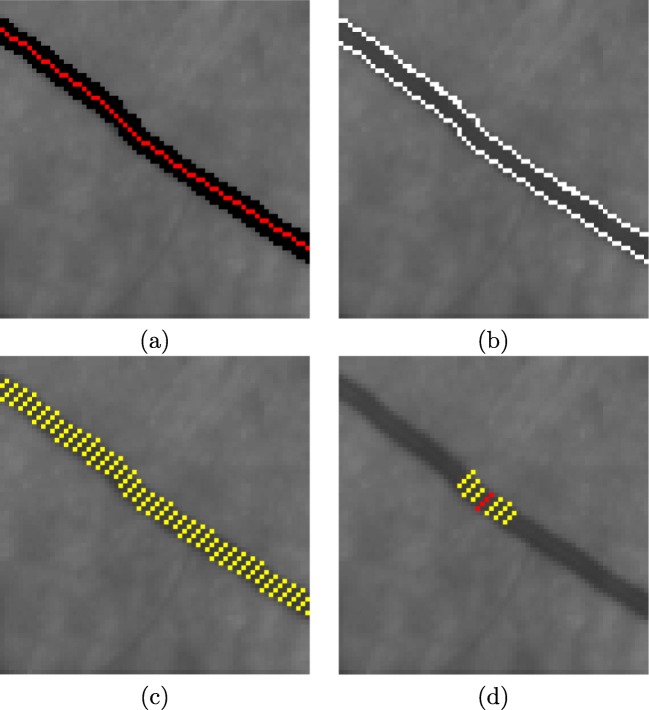
For this purpose, we use the vascular information of the vessel centerlines and the segmentation, both obtained in previous stages, represented by Fig. 7a and b. To achieved that, we based our method in the work of Barreira et al. [3]. Initially, we obtain the vascular edges to restrict the search space. The method employs an approach based snakes, an active contour model, to obtain a polygonal surface that evolves within the vessel region [27], as shown in Fig. 7c. A snake v(s) is a contour defined within an image, as shown in the following:
Fig. 7.
Example of the vessel profile extraction. a Vessel centerline and vessel segmentation, red and black lines, respectively. b Vessel edges represented by white lines. c Yellow lines perpendicular to the vessel centerline identify the vessel profile information in each point. d Seven vessel profiles are used to extract the features of each vessel point
| 8 |
where x(s), y(s), are the (x, y) coordinates of the image and s is a parameter of the domain. Its values are stabilized when it minimizes its energy function:
| 9 |
where Eint represents the internal elastic energy term, which controls the flexibility and elasticity of the snake, and Eext is the external edge-based energy term which moves the snake towards the edges of the vessels. In particular, Eint is defined according to as follows:
| 10 |
where vs(s) = [x(s), y(s)] defines each point of the snake in the node coordinates (x(s), y(s)). The parameter α(s) penalizes changes in the distances between points of the contour, while the parameter β(s) penalizes oscillations in the contour. Both control the snake shape in the vascular structure.
On the other hand, Eext is defined according to as follows:
| 11 |
where Eedge corresponds to the energy calculated by assigning to each point its Euclidean distance to the nearest edge, Ecres represents the creases distance energy that is obtained from the crease image, Edir is the strongest expansion force of the snake model, Emark corresponds to the energy that ensures that a self overlapping never happens, and Edif is the energy of control over the snake expansion. The parameters γ, δ, υ, σ, and ω are the weights of the corresponding indicated energies [27]. The final result of this method is directly affected by the initialization of the snake nodes in the image. In our case, we used the information of the coordinates of the centerline to perform an initial distribution of the seeds within the vascular segment. Two parallel chains of seeds are placed on both sides of the centerline and they are guided toward the edges by the energy terms of the model.
This way, we calculate the vascular profile for all the points belonging to the centerline. Vessel profiles are obtained using the information of a set of perpendicular lines that are limited by both vessel edges. These profiles are posteriorly used in the extraction of features in the posterior vascular classification between arteries and veins. Figure 7c illustrates an example of this approach, where the yellow lines that are perpendicular to the vessel centerline identify the vessel profile information calculated for each vascular node. The feature vector is created for all the points, Pi, that belong to the centerline. We use seven vessel profiles, as shown in Fig. 7d, where the red line describes the vessel profile of the point Pi and the yellow lines indicate the set of consecutive vessel profiles (Pi− 3, Pi− 2, Pi− 1, Pi+ 1, Pi+ 2, Pi+ 3), that are employed in the process of vessel feature extraction.
A/V Classification
Arteries and veins are two different types of vessels whose main objective is the transportation of blood from the heart to the organs and vice versa [21]. To identify them, in this work, we used a machine learning approach to discriminate the retinal vessels between these two types. Typically, veins present darker profiles than arteries in the OCT images. These differences in the intensity characteristics can be easily observed in the near-infrared reflectance retinography images. For that reason, we extract six Global Intensity-Based Features (GIBS) from the previously extracted vessel profiles. These features are used to measure the variations of the intensities between these two types of vessels. In particular, we handle the following features: mean, median, standard deviation, variance, maximum, and minimum.
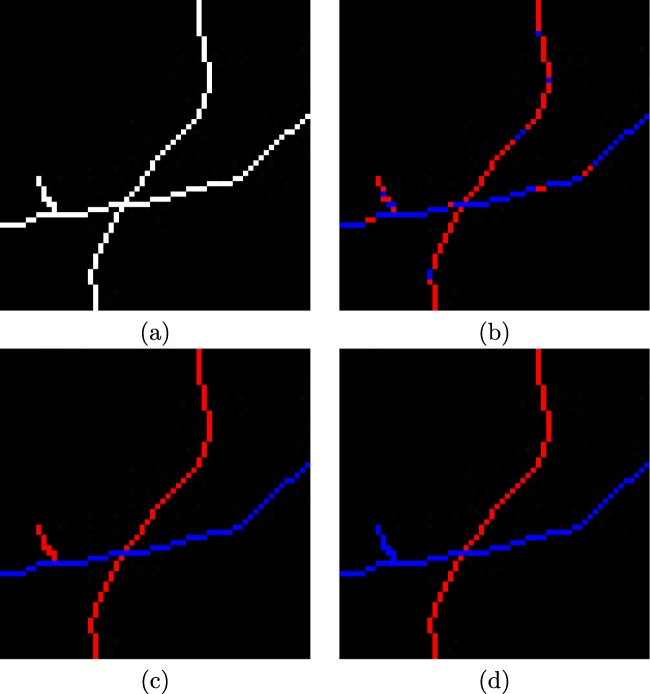
These feature sets are used by a classifier to discriminate arteries from veins. In this approach, we choose the k-means clustering algorithm [30] given its simplicity and computational performance. The main idea of this classifier is to define centroids, for each one of the two analyzed clusters, in our case, arteries and veins. These centroids are initialized to the minimum and maximum values of the feature vector. This is necessary to place the centers of the clusters as far as possible from each other in the first iteration of the algorithm. As a result, all the points of the vessel centerlines will be assigned to an unique cluster based on its characteristics. In Fig. 8, we can see a representative example of classification of the retinal vessels into arteries and veins where the red points represent arteries and blue points are veins.
Fig. 8.
Example of the automatic classification of the retinal vessels into arteries and veins. a Vessel centerline image. b Results of the classification process for each individual vessel point, where the red points represent arteries and blue points are veins. c Results of the classification process with propagation applied to all the vascular segments. d Results of the classification process with propagation on the points of intersection (bifurcations and crossovers) applied to all the vascular segments
Propagation
In the previous process, we classified each single point of the vessels individually as artery or vein. This individual classification may carry the classification of points of the same vessel to different classes (Fig. 8b). These inconsistencies can be caused by possible changes in brightness, speckle noise, or the presence of small capillaries in the retina. To reduce the impact of these errors, we designed a final correction stage that is based on a voting process in each segment in which the winning class has the highest number of votes and, therefore, it is assigned to all the points of the vascular segment (Fig. 8c).
Additionally, thanks to the correction of intersections points (bifurcations and crossovers), we can coherently propagate the correct class over the entire identified retinal vasculature (Fig. 8d), improving once again the classification performance of the proposed method.
Results and Discussion
The proposed method was tested using 46 OCT scans of different patients including their corresponding near-infrared reflectance retinography images. These images were acquired with a confocal scanning laser ophthalmoscope, a Spectralis OCT from Heidelberg Engineering. OCT images are all centered on the macula, with a resolution of 496 × 496 pixels and were taken from both left and right eyes. The local ethics committee approved the study and the tenets of the Declaration of Helsinki were followed.
The initial dataset was manually labeled by an expert clinician, identifying the retinal blood vessels in the near-infrared reflectance retinography images. The methodology was validated by means of a testing dataset composed by 97,294 vessel points of 2,392 vascular segments, all categorized between arteries and veins. We randomly divided the initial dataset into a training and a testing dataset, both with the same size, for the training and testing stages, respectively.
Regarding the parameters, they were empirically established with a preliminary test, using those values that offered satisfactory results. Table 1 presents the set of parameters that were used with the proposed method in this study.
Table 1.
Parameter setting that was empirically established in this study
| Parameter | Value |
|---|---|
| Wtop-hat × Wtop-hat | 15 × 15 pixels |
| Wmedian × Wmedian | 5 × 5 pixels |
| λ1 | 1.0 |
| λ2 | 3.0 |
| α | 0.25 |
| β | 0.01 |
| γ | 0.025 |
| δ | 0.003 |
| υ | 0.062 |
| σ | 0.010 |
| ω | 0.900 |
Regarding the vascular tree detection, we analyzed the performance of the used approach using the true positive rates and the false positive rates. In particular, the true positive rates measure the percentage of real vessel points that are detected (ideally 100%) while the false positive rates measure the percentage of detected points that do not correspond to real vessel points (ideally 0%). As show in Table 2, the proposed strategy provided satisfactory results, reaching a true positive rate of 83.85% as well as a false positive rate of 3.51%, using all the images of the analyzed dataset. Generally, the proposed system is able to identify the retinal vascular tree with reasonable detection rates.
Table 2.
Results for the vascular tree detection stage
| True positive rate | False positive rate |
|---|---|
| 83.85% | 3.51% |
Regarding the A/V classification, the performance of the proposed system was validated using the following metrics: sensitivity, specificity, and accuracy, considering true positives as correctly identified arteries, whereas true negatives as correctly identified veins. Mathematically, these metrics are formulated as indicated in Eqs. 12, 13, and 14, where (TP), (TN), (FP), and (FN) indicate true positive, true negative, false positive, and false negative, respectively.
| 12 |
| 13 |
| 14 |
Firstly, the methodology was evaluated at all the points of the retinal vessel tree. This initial evaluation was made before the phase of propagation of the winning class in the vascular classification stage.
Table 3(a) presents the results obtained in terms of sensitivity, specificity and accuracy for all the vessel coordinates. Generally, the initial evaluation of the method, before the propagation stages, provided an accuracy of 86.84% in the A/V classification process, which we consider satisfactory.
Table 3.
Sensitivity, specificity and accuracy of the A/V classification process
| (a) | (b) | (c) | |
|---|---|---|---|
| Sensitivity | 88.79% | 91.44% | 93.94% |
| Specificity | 84.99% | 89.47% | 92.79% |
| Accuracy | 86.84% | 90.42% | 93.35% |
(a) Initial A/V classification process. (b) A/V classification process with propagation. (c) A/V classification process with propagation using the intersection points
Next, as indicated, we proceed with the propagation stage of the classification to assign a common class (artery or vein) to all the points belonging to the same vascular segment. Table 3(b) shows the results obtained including this improvement. As we can see, the propagation produces a more coherent artery/vein identification of the entire vessel segments. Despite some misclassifications that can be introduced, the vast majority of the pixels of most of the vessels are correctly classified. This way, we correct some of these introduced errors and, consequently, the accuracy was improved.
Finally, we evaluate the entire proposed method including the propagation stage using the intersection points (bifurcations and crossovers). Following the same reasoning of the previous propagation, the method was able to correct different misclassified vessel segments, mainly small retinal vessels that were corrected by others through intersections. The obtained results are presented in Table 3c. Once again, thanks to those corrections, the accuracy was improved, reaching a value of 93.35%.
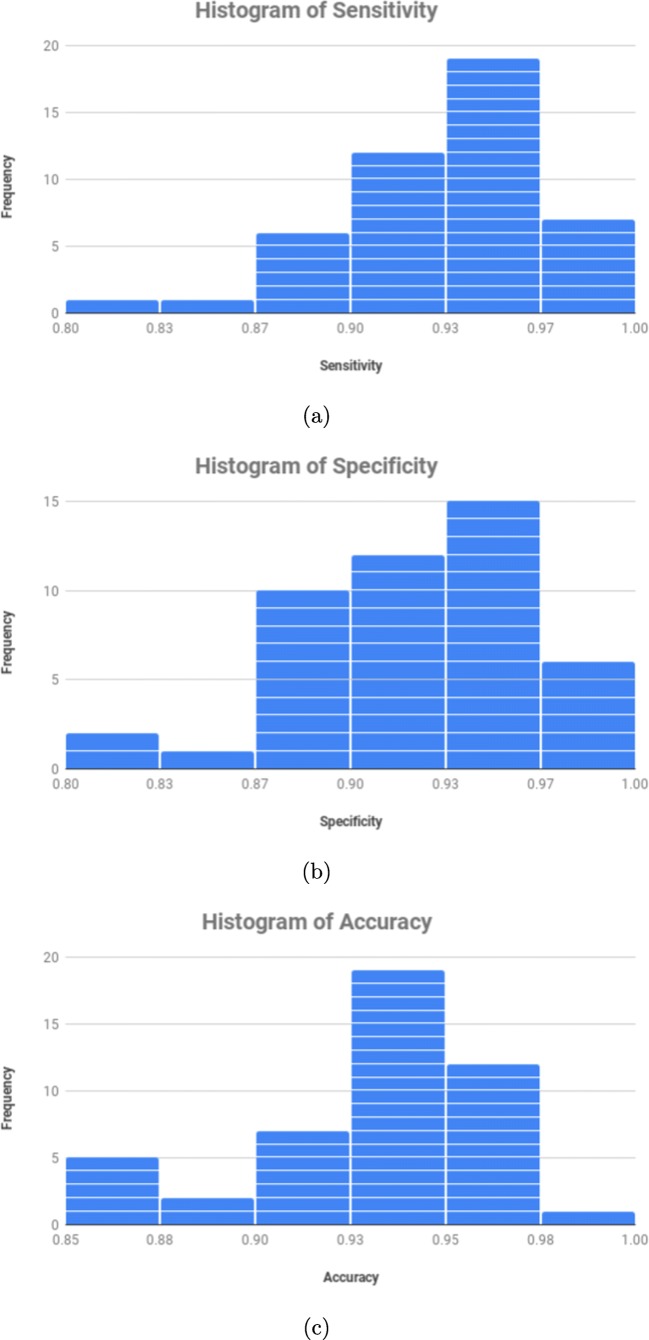
Complementary, Fig. 9 presents three different and representative frequency histograms using all the 46 near-infrared reflectance retinography images. These histograms present a graphical representation of the distribution in terms of sensitivity, specificity, and accuracy for each image, allowing a more complete and detailed analysis of the obtained performance results. To do that, we analyze the performance of the A/V classification process with propagation using the intersection points. In general, all the frequency histograms showed a satisfactory performance with the considered dataset for all the analyzed metrics. In particular, as we can see in Fig. 9c, satisfactory results were also achieved for each image, reaching a mode of 94.23% as well as values of 85.45% and 98.03% as minimum and maximum, respectively.
Fig. 9.
Frequency histograms of the obtained results in the A/V classification process with propagation using the intersection points. a Frequency histogram of sensitivity. b Frequency histogram of specificity. c Frequency histogram of accuracy
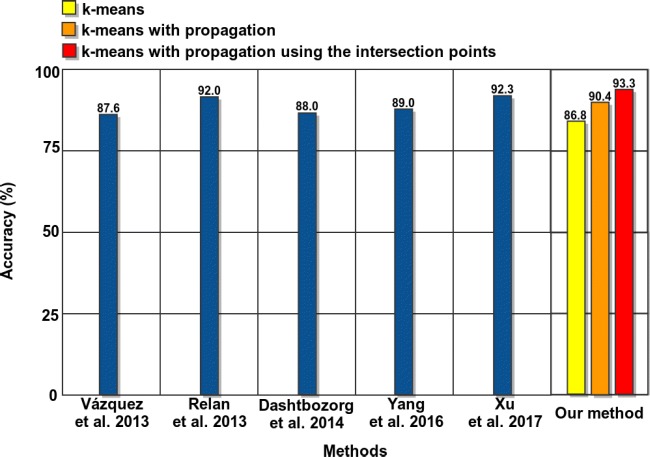
Despite the non-existence of a public dataset to evaluate the stages of our methodology and the non-existence of any other proposal for the same image modality, we compared the results of our approach with the performance of some representative works of the literature for classical retinographies, given their proximity, to obtain an approximate idea about the suitability of our proposal. These methods where previously introduced and described in “Introduction.” Figure 10 represents the best accuracy results of the methods of the state-of-the-art and our proposal. As we can observe, our method offers a competitive performance, outperforming the rest of the approaches.
Fig. 10.
Vessel classification performance comparative between techniques of the state of the art and the proposed methodology
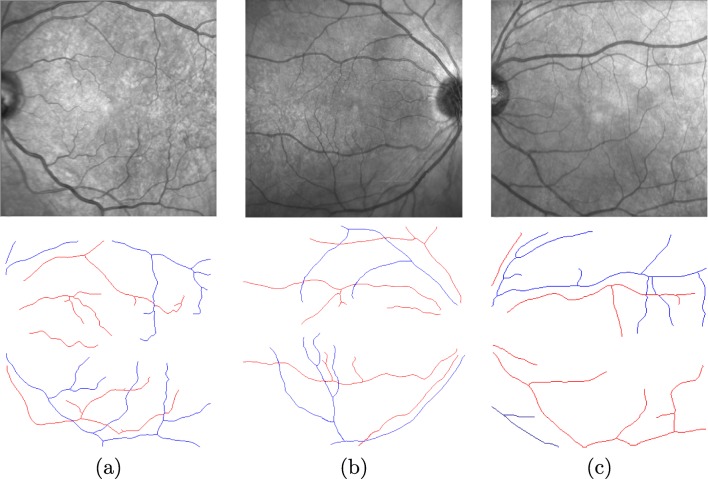
Figure 11 exposes some representative examples illustrating the final results of the proposed method. As we can observe, the method offers accurate results, providing valuable information that can be easily analyzed by the expert clinicians. Despite this, the method presents some intrinsic limitations due to the complex characteristics that may be present in the near-infrared reflectance retinography images. Some cases of misclassified vessel segments are originated by a poor contrast, specially in cases of tiny vessels. Other times, the characteristics of the vessels are similar in both classes, once again specially in the cases of small retinal vessels or the poor contrast that can be present in other eye structures of some pathological scenarios.
Fig. 11.
Examples of final results of the proposed methodology. The red points describe arteries and blue points are veins
Conclusions
This work presents a new methodology for the automatic identification of the retinal vessel tree and its classification into arteries and veins using the near-infrared reflectance retinographies of the OCT scans. A robust and precise identification and classification of the retinal vasculature is fundamental for the development of CAD systems that help the specialists to prevent, diagnose, and treat relevant pathologies that affect the retinal microcirculation.
The proposed system achieved satisfactory results, reaching a best accuracy of 93.35% of classification of arteries and veins using all the stages of the proposed method. Although, to date, no other work has been proposed using this imaging modality, we compared the performance of the proposed system with representative approaches of the state of the art, despite that, they were proposed in the analysis of classical retinographies given their proximity, concluding that the proposal offers a correct behavior, outperforming the results of the rest of the approaches.
Despite that, the method offered a robust and coherent behavior, some aspects could also be improved. Future work would involve the analysis of the different stages of the methodology to obtain a better performance. Additionally, the method could combine the output of this proposal with the analysis of the vascular depth information provided by the histological sections of the OCT scans. This information, in combination with the 2D artery and vein identification, could be used to perform a 3D reconstruction of the vascular tree.
In addition, clinical studies could be designed to evaluate the robustness of this method in a large variety of retinal vascular disorders or possible systemic vascular complications, providing a further complementary analysis about the performance of the proposed system.
Funding Information
This work is supported by the Instituto de Salud Carlos III, Government of Spain and FEDER funds of the European Union through the DTS18/00136 research project and by the Ministerio de Economía y Competitividad, Government of Spain through the DPI2015-69948-R research project. Also, this work has received financial support from the European Union (European Regional Development Fund—ERDF); the Xunta de Galicia, Centro singular de investigación de Galicia accreditation 2016–2019, Ref. ED431G/01; and Grupos de Referencia Competitiva, Ref. ED431C 2016-047.
Compliance with Ethical Standards
The local ethics committee approved the study and the tenets of the Declaration of Helsinki were followed.
Footnotes
Publisher’s Note
Springer Nature remains neutral with regard to jurisdictional claims in published maps and institutional affiliations.
Contributor Information
Joaquim de Moura, Email: joaquim.demoura@udc.es.
Jorge Novo, Email: jnovo@udc.es.
José Rouco, Email: jrouco@udc.es.
Pablo Charlón, Email: pcharlon@sgoc.es.
Marcos Ortega, Email: mortega@udc.es.
References
- 1.Albrecht P, Ringelstein M, Müller A, Keser N, Dietlein T, Lappas A, Foerster A, Hartung H, Aktas O, Methner A. Degeneration of retinal layers in multiple sclerosis subtypes quantified by Optical Coherence Tomography. Mult Scler J. 2012;18(10):1422–1429. doi: 10.1177/1352458512439237. [DOI] [PubMed] [Google Scholar]
- 2.Baamonde S, de Moura J, Novo J, Ortega M (2017) Automatic detection of epiretinal membrane in OCT images by means of local luminosity patterns. In: International work-conference on artificial neural networks, pp 222–235
- 3.Barreira N, Ortega M, Rouco J, Penedo M, Pose-Reino A, Mariño C. Semi-automatic procedure for the computation of the arteriovenous ratio in retinal images. Int J Comput Vis Biomechan. 2010;3(2):135–147. [Google Scholar]
- 4.Bellazzi R, Montani S, Riva A, Stefanelli M. Web-based telemedicine systems for home-care: technical issues and experiences. Comput Methods Programs Biomed. 2001;64(3):175–187. doi: 10.1016/S0169-2607(00)00137-1. [DOI] [PubMed] [Google Scholar]
- 5.Biswas S, Lovell BC (2007) Bézier and splines in image processing and machine vision. Science and Business Media:109–121
- 6.Blanco M, Penedo M, Barreira N, Penas M, Carreira MJ (2006) Localization and extraction of the optic disc using the fuzzy circular hough transform. In: International conference on artificial intelligence and soft computing, pp 712–721
- 7.de Boor C. A practical guide to splines. Appl Math Sci. 1978;27:1–7. [Google Scholar]
- 8.Bowd C, Weinreb RN, Williams JM, Zangwill LM. The retinal nerve fiber layer thickness in ocular hypertensive, normal, and glaucomatous eyes with Optical Coherence Tomography. Arch Ophthalmol. 2000;118(1):22–26. doi: 10.1001/archopht.118.1.22. [DOI] [PubMed] [Google Scholar]
- 9.Caderno I, Penedo M, Barreira N, Mariño C, Gonzalez F. Precise detection and measurement of the retina vascular tree. Pattern Recogn Image Anal (Adv Math Theory Appl) 2005;15(2):523–526. [Google Scholar]
- 10.Calvo D, Ortega M, Penedo M, Rouco J. Automatic detection and characterisation of retinal vessel tree bifurcations and crossovers in eye fundus images. Comput Methods Programs Biomed. 2011;103(1):28–38. doi: 10.1016/j.cmpb.2010.06.002. [DOI] [PubMed] [Google Scholar]
- 11.Canny John. A Computational Approach to Edge Detection. IEEE Transactions on Pattern Analysis and Machine Intelligence. 1986;PAMI-8(6):679–698. doi: 10.1109/TPAMI.1986.4767851. [DOI] [PubMed] [Google Scholar]
- 12.Dashtbozorg Behdad, Mendonça Ana Maria, Campilho Aurélio. Pattern Recognition and Image Analysis. Berlin, Heidelberg: Springer Berlin Heidelberg; 2013. Automatic Classification of Retinal Vessels Using Structural and Intensity Information; pp. 600–607. [Google Scholar]
- 13.Diamond E. Manual of diagnostic imaging: a clinician’s guide to clinical problem solving. Radiology. 1985;157(1):18–18. doi: 10.1148/radiology.157.1.18. [DOI] [Google Scholar]
- 14.Dougherty E. Mathematical morphology in image processing. New York: CRC Press; 1992. [Google Scholar]
- 15.Earley M. Clinical anatomy of the eye. Optom Vis Sci. 2000;77(5):231–232. doi: 10.1097/00006324-200005000-00006. [DOI] [Google Scholar]
- 16.Fercher AF, Drexler W, Hitzenberger CK, Lasser T. Optical Coherence Tomography-principles and applications. Rep Progress Phys. 2003;66(2):239. doi: 10.1088/0034-4885/66/2/204. [DOI] [Google Scholar]
- 17.Frangi Alejandro F., Niessen Wiro J., Vincken Koen L., Viergever Max A. Medical Image Computing and Computer-Assisted Intervention — MICCAI’98. Berlin, Heidelberg: Springer Berlin Heidelberg; 1998. Multiscale vessel enhancement filtering; pp. 130–137. [Google Scholar]
- 18.Gómes E, Del Pozo F, Quiles J, Arredondo M, Rahms H, Sanz M, Cano P, et al. A telemedicine system for remote cooperative medical imaging diagnosis. Comput Methods Programs Biomed. 1996;49(1):37–48. doi: 10.1016/0169-2607(95)01706-2. [DOI] [PubMed] [Google Scholar]
- 19.González-López Ana, Ortega Marcos, Penedo Manuel G., Charlón Pablo. Lecture Notes in Computer Science. Cham: Springer International Publishing; 2014. Automatic Robust Segmentation of Retinal Layers in OCT Images with Refinement Stages; pp. 337–345. [Google Scholar]
- 20.Grisan E, Ruggeri A (2003) A divide et impera strategy for automatic classification of retinal vessels into arteries and veins. In: Engineering in Medicine and Biology Society, 2003. Proceedings of the 25th annual international conference of the IEEE, vol 1, pp 890–893
- 21.Ho A. Retina: Color Atlas & Synopsis of Clinical Ophthalmology (Wills Eye Hospital Series) New York: McGraw-Hill Professional; 2003. [Google Scholar]
- 22.Huang T, Yang G, Tang G. A fast two-dimensional median filtering algorithm. IEEE Trans Acoust Speech Signal Process. 1979;27(1):13–18. doi: 10.1109/TASSP.1979.1163188. [DOI] [Google Scholar]
- 23.Hubbard LD, Brothers RJ, King WN, Clegg LX, Klein R, Cooper LS, Sharrett AR, Davis MD, Cai J. Methods for evaluation of retinal microvascular abnormalities associated with hypertension/sclerosis in the atherosclerosis risk in communities study. Ophthalmology. 1999;106(12):2269–2280. doi: 10.1016/S0161-6420(99)90525-0. [DOI] [PubMed] [Google Scholar]
- 24.Ikram M, De Jong F, Bos M, Vingerling J, Hofman A, Koudstaal PJ, De Jong P, Breteler M. Retinal vessel diameters and risk of stroke the rotterdam study. Neurology. 2006;66(9):1339–1343. doi: 10.1212/01.wnl.0000210533.24338.ea. [DOI] [PubMed] [Google Scholar]
- 25.Jonas JB, Schmidt AM, Müller-Bergh J, Schlötzer-Schrehardt U, Naumann G. Human optic nerve fiber count and optic disc size. Invest Ophthalmol Vis Sci. 1992;33(6):2012–2018. [PubMed] [Google Scholar]
- 26.Joshi VS, Reinhardt JM, Garvin MK, Abramoff MD. Automated method for identification and artery-venous classification of vessel trees in retinal vessel networks. PloS One. 2014;9(2):e88,061. doi: 10.1371/journal.pone.0088061. [DOI] [PMC free article] [PubMed] [Google Scholar]
- 27.Kass M, Witkin A, Terzopoulos D (1987) Snakes: Active contour models. In: 1St international conference on computer vision, vol 259, pp 268
- 28.Kondermann C, Kondermann D, Yan M, et al. (2007) Blood vessel classification into arteries and veins in retinal images. In: Proceedings of SPIE Medical Imaging, pp 651,247–6512,479
- 29.López AM, Lloret D, Serrat J, Villanueva JJ. Multilocal creaseness based on the level-set extrinsic curvature. Comput Vis Image Underst. 2000;77(2):111–144. doi: 10.1006/cviu.1999.0812. [DOI] [Google Scholar]
- 30.MacQueen J (1967) Some methods for classification and analysis of multivariate observations. In: Proceedings of the fifth Berkeley Symposium on Mathematical Statistics and Probability, vol 1, pp 281–297
- 31.de Moura J, Novo J, Charlón P, Barreira N, Ortega M. Enhanced visualization of the retinal vasculature using depth information in OCT. Med Biol Eng Comput. 2017;55(12):2209–2225. doi: 10.1007/s11517-017-1660-8. [DOI] [PubMed] [Google Scholar]
- 32.de Moura J, Novo J, Rouco J, Penedo M, Ortega M (2017) Automatic identification of intraretinal cystoid regions in Optical Coherence Tomography. In: Conference on artificial intelligence in medicine in Europe, pp 305–315
- 33.Novo J, Penedo M, Santos J (2008) Optic disc segmentation by means of GA-optimized Topological Active Nets. In: International conference image analysis and recognition, pp 807–816
- 34.Ortega M, Barreira N, Novo J, Penedo M, Pose-Reino A, Gómez-Ulla F. Sirius: a web-based system for retinal image analysis. Int J Med Inf. 2010;79(10):722–732. doi: 10.1016/j.ijmedinf.2010.07.005. [DOI] [PubMed] [Google Scholar]
- 35.Philip KP, Dove EL, McPherson DD, Gotteiner NL, Stanford W, Chandran KB. The fuzzy hough transform-feature extraction in medical images. IEEE Trans Med Imaging. 1994;13(2):235–240. doi: 10.1109/42.293916. [DOI] [PubMed] [Google Scholar]
- 36.Puzyeyeva O, Lam WC, Flanagan JG, Brent MH, Devenyi RG, Mandelcorn MS, Wong T, Hudson C. High-resolution Optical Coherence Tomography retinal imaging: a case series illustrating potential and limitations. J Ophthalmol. 2011;2011:1–6. doi: 10.1155/2011/764183. [DOI] [PMC free article] [PubMed] [Google Scholar]
- 37.Relan D, MacGillivray T, Ballerini L, Trucco E (2013) Retinal vessel classification: sorting arteries and veins. In: Engineering in medicine and biology society, 2013 35th annual international conference of the IEEE, pp 7396–7399 [DOI] [PubMed]
- 38.Relan D, MacGillivray T, Ballerini L, Trucco E (2014) Automatic retinal vessel classification using a least square-support vector machine in vampire. In: 2014 36th annual international conference of the IEEE Engineering in medicine and biology society, pp 142–145 [DOI] [PubMed]
- 39.Rothaus K, Jiang X, Rhiem P. Separation of the retinal vascular graph in arteries and veins based upon structural knowledge. Image Vis Comput. 2009;27(7):864–875. doi: 10.1016/j.imavis.2008.02.013. [DOI] [Google Scholar]
- 40.Samagaio G, Estévez A, de Moura J, Novo J, Fernandez MI. Ortega, m.: automatic macular edema identification and characterization using OCT images. Comput Methods Programs Biomed. 2018;21:327–335. doi: 10.1016/j.cmpb.2018.05.033. [DOI] [PubMed] [Google Scholar]
- 41.Sánchez L, Barreira N, Penedo M, de Tuero GC (2014) Computer aided diagnosis system for retinal analysis: automatic assessment of the vascular tortuosity. In: Studies in health technology and informatics: Innovation in medicine and healthcare, pp 55–64 [PubMed]
- 42.Sánchez-Tocino H, Alvarez-Vidal A, Maldonado MJ, Moreno-Montaṅés J, Garcia-Layana A. Retinal thickness study with Optical Coherence Tomography in patients with diabetes. Invest Ophthalmol Vis Sci. 2002;43(5):1588–1594. [PubMed] [Google Scholar]
- 43.Schmitt JM. Optical Coherence Tomography (OCT): a review. IEEE J Sel Top Quantum Electron. 1999;5(4):1205–1215. doi: 10.1109/2944.796348. [DOI] [PMC free article] [PubMed] [Google Scholar]
- 44.Simó A, de Ves E. Segmentation of macular fluorescein angiographies. A statistical approach. Pattern Recogn. 2001;34(4):795–809. doi: 10.1016/S0031-3203(00)00032-7. [DOI] [Google Scholar]
- 45.Sinthanayothin C, Boyce JF, Cook HL, Williamson TH. Automated localisation of the optic disc, fovea, and retinal blood vessels from digital colour fundus images. Br J Ophthalmol. 1999;83(8):902–910. doi: 10.1136/bjo.83.8.902. [DOI] [PMC free article] [PubMed] [Google Scholar]
- 46.Vázquez S, Cancela B, Barreira N, Penedo M, Rodríguez-blanco M, Seijo MP, de Tuero GC, Barceló MA, Saez M. Improving retinal artery and vein classification by means of a minimal path approach. Mach Vis Appl. 2013;24(5):919–930. doi: 10.1007/s00138-012-0442-4. [DOI] [Google Scholar]
- 47.Williams ZY, Schuman JS, Gamell L, Nemi A, Hertzmark E, Fujimoto JG, Mattox C, Simpson J, Wollstein G. Optical Coherence Tomography measurement of nerve fiber layer thickness and the likelihood of a visual field defect. Amer J Ophthalmol. 2002;134(4):538–546. doi: 10.1016/S0002-9394(02)01683-5. [DOI] [PubMed] [Google Scholar]
- 48.Wong TY, Klein R, Sharrett AR, Schmidt MI, Pankow JS, Couper DJ, Klein BE, Hubbard LD, Duncan BB. Retinal arteriolar narrowing and risk of diabetes mellitus in middle-aged persons. J Amer Med Assoc. 2002;287(19):2528–2533. doi: 10.1001/jama.287.19.2528. [DOI] [PubMed] [Google Scholar]
- 49.Xu X, Ding W, Abràmoff MD, Cao R. An improved arteriovenous classification method for the early diagnostics of various diseases in retinal image. Comput Methods Programs Biomed. 2017;141:3–9. doi: 10.1016/j.cmpb.2017.01.007. [DOI] [PubMed] [Google Scholar]
- 50.Yang Yi, Bu Wei, Wang Kuanquan, Zheng Yalin, Wu Xiangqian. Communications in Computer and Information Science. Singapore: Springer Singapore; 2016. Automated Artery-Vein Classification in Fundus Color Images; pp. 228–237. [Google Scholar]
- 51.Yu S, Wei Z, Deng RH, Yao H, Zhao Z, Ngoh LH, Wu Y (2008) A tele-ophthalmology system based on secure video-conferencing and white-board. In: 2008. Healthcom 2008. 10th international conference E-health networking, applications and services, pp 51–52


