Abstract
A robust lung segmentation method using a deep convolutional neural network (CNN) was developed and evaluated on high-resolution computed tomography (HRCT) and volumetric CT of various types of diffuse interstitial lung disease (DILD). Chest CT images of 617 patients with various types of DILD, including cryptogenic organizing pneumonia (COP), usual interstitial pneumonia (UIP), and nonspecific interstitial pneumonia (NSIP), were scanned using HRCT (1–2-mm slices, 5–10-mm intervals) and volumetric CT (sub-millimeter thickness without intervals). Each scan was segmented using a conventional image processing method and then manually corrected by an expert thoracic radiologist to create gold standards. The lung regions in the HRCT images were then segmented using a two-dimensional U-Net architecture with the deep CNN, using separate training, validation, and test sets. In addition, 30 independent volumetric CT images of UIP patients were used to further evaluate the model. The segmentation results for both conventional and deep-learning methods were compared quantitatively with the gold standards using four accuracy metrics: the Dice similarity coefficient (DSC), Jaccard similarity coefficient (JSC), mean surface distance (MSD), and Hausdorff surface distance (HSD). The mean and standard deviation values of those metrics for the HRCT images were 98.84 ± 0.55%, 97.79 ± 1.07%, 0.27 ± 0.18 mm, and 25.47 ± 13.63 mm, respectively. Our deep-learning method showed significantly better segmentation performance (p < 0.001), and its segmentation accuracies for volumetric CT were similar to those for HRCT. We have developed an accurate and robust U-Net-based DILD lung segmentation method that can be used for patients scanned with different clinical protocols, including HRCT and volumetric CT.
Keywords: Chest CT, Deep learning, Diffuse interstitial lung disease, Lung segmentation, U-net
Introduction
Computed tomography (CT) has become an important tool for diagnosing pulmonary diseases. In particular, high-resolution computed tomography (HRCT) and volumetric CT are recognized as effective diagnostic tools for diffuse interstitial lung disease (DILD) as they help in detecting chronic changes in lung parenchyma [1, 2]. Many studies have therefore developed computerized image analysis and computer-aided diagnosis (CAD) techniques that utilize HRCT scans to more effectively diagnose pulmonary diseases, including DILD.
Because DILD has different therapies and prognoses depending on its type, it is important to differentiate between these types. When a CAD model analyzes images of diseased organs, segmenting the organ is a critical step that usually precedes the main image analysis [3, 4]. If segmentation errors cause the organ’s borders to be set incorrectly, this is very likely to affect the subsequent analysis [5]. Automating organ segmentation is a challenging task: it can be hard to identify the lung borders of patients with pulmonary diseases as such diseases further reduce the distinction between their lung tissue and the surrounding structures.
Recently, convolutional neural networks (CNNs) have been proposed as a potential solution to such problems [6, 7]. Several international pattern recognition competitions have been created, based on a large-scale image database [8], and a deep neural network method has not only won but also achieved human-level pattern recognition for the first time [9, 10]. Since then, there have been very high hopes for CNNs, even though they have only achieved such results in limited domains. Therefore, we propose and evaluate a robust CNN-based segmentation model using two clinical protocols including HRCT and volumetric chest CT for DILD which suffer from blurred boundaries for various types of lung parenchyma disorders.
Materials and Methods
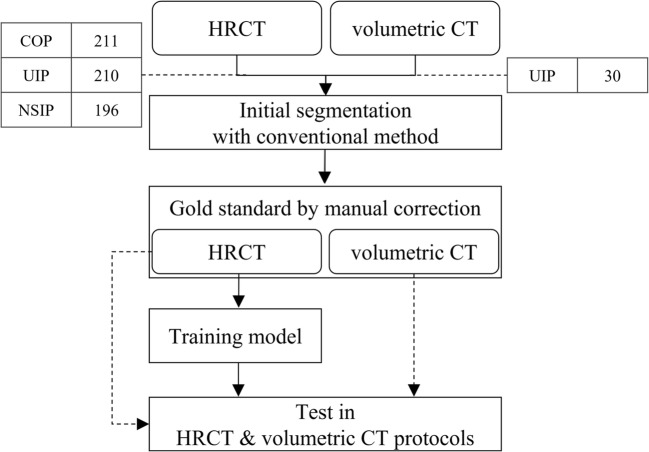
Since it is hard to create robust gold standards for diseased lung regions manually from scratch, we instead took a two-step approach. First, initial lung segmentation was performed using a conventional image processing method. Although this provided generally reasonable segmentation results for normal lungs, it was not appropriate for severe DILD cases. A thoracic radiologist therefore manually corrected the lung regions in axial images to create gold standards, which were then used to train and evaluate a deep-learning-based segmentation model. Figure 1 gives an overview of the procedure used in this study.
Fig. 1.
Overview of the proposed CNN training and evaluation method
Subjects
For this study, we created a dataset consisting of HRCT images of 617 patients, including 211 with cryptogenic organizing pneumonia (COP), 210 with usual interstitial pneumonia (UIP), and 196 with nonspecific interstitial pneumonia (NSIP), together with independent volumetric CT images of 30 patients with UIP. The diagnostic decisions made for these data, based on a combination of clinico-radiologico-pathological discussions and consensus opinions, were regarded as gold standards according to the latest official statement by The American Thoracic Society/European Respiratory Society/Japanese Respiratory Society/Latin American Thoracic Association, presented in Idiopathic Pulmonary Fibrosis: Evidence-based Guidelines for Diagnosis and Management [11].
Although chest CT images consist of distinct 3D spatial data, it is difficult to construct extensive gold standards by labeling the lung region on each slice. Therefore, the HRCT images that have relatively weak connectivity but considered to be efficient tools for DILD were used to train the model. These were 1–2 mm thick, with inter-slice intervals of 5–10 mm, and thus represented at most a fifth of the volume of the whole lung. And the volumetric CT images of sub-millimeter thickness without intervals were used to provide additional validation of the model. The institutional review board for human investigations at Asan Medical Center approved the study protocol, removed all patient identifiers, and waived the informed-consent requirements owing to the retrospective nature of this study.
Gold Standard
Since identifying lung regions with DILD from scratch is a time-consuming and difficult task, the initial segmentation process was performed using the conventional image processing method. In general, the CT Hounsfield Unit values for normal lung tissues are relatively low compared with those for other tissues because of the air in the lungs. A threshold-based method was therefore employed for the initial segmentation as it was able to extract the lung region easily and effectively. The Insight Segmentation and Registration Toolkit [12] was used to apply rolling-ball and hole-filling operations to smooth and fill the lung region, as well as other lung tissues such as major vessels and airways in the lung’s interior [13, 14]. This enabled a thoracic radiologist to more easily correct the lung region in the axial direction, creating gold standards.
Generalized Segmentation Using U-Net
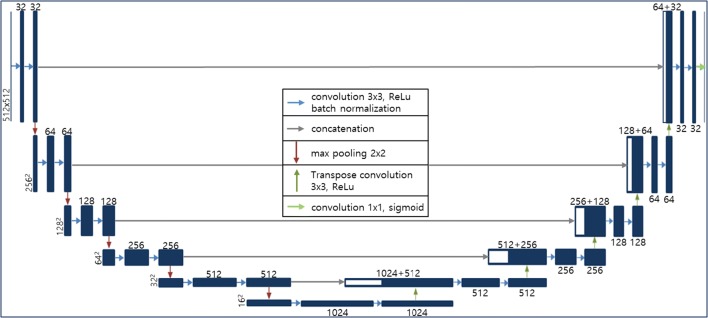
U-Net [15], a type of fully convolutional network (FCN) [16], is one of the most widely used CNN architectures for medical image segmentation. Its network can be divided into two main parts: the left side reduces the dimensionality, and the right side extends the original dimensionality. Both sides consist of convolutional and up- or down-sampling layers. Max-pooling functions are used for down-sampling, and transposed convolutional layers are employed for up-sampling. U-Net’s most important characteristic is that it has a connection (concatenation function) between the left and right sides, and this allows it to give more accurate segmentation results by preventing losing information. We selected this network for our generalized lung segmentation model and modified its structural hyper-parameters to accept 512 by 512 inputs, as shown in Fig. 2.
Fig. 2.
U-Net-based deep-learning architecture for DILD lung segmentation
Although chest CT images consist of distinct three-dimensional (3D) spatial data, 3D approaches such as 3D U-Net [17] or V-Net [18] may be inappropriate because HRCT images have variable intervals and weak connectivity. Thus, we extracted randomly chosen axial images from the training set and evaluated the test data by stacking adjacent two-dimensional (2D) results. To ensure a fair and accurate evaluation, the data were divided into training, validation, and test sets on a per-patient basis, and the comparisons were made using a test set that was not used during training. Of the total 617 HRCT scans, 462, 76, and 79 scans were used for training, validation, and test, respectively. The training data consisted of 17,857 axial images, which were randomly shuffled for every epoch.
During training, each input image was transformed by adding Gaussian noise with a standard deviation (SD) of 0.1, rotating it randomly by − 10° to + 10°, zooming it by 0–20%, and flipping it horizontally for regularization. The model was implemented using Keras (2.0.4) with Theano (0.9.0) backend in Python 2.7, and Adam optimizer [19] was used for stochastic gradient descent with learning rates of 10−5. The Dice similarity coefficient (DSC) was used as a loss function and calculated in mini-batch units with at least one sample containing lungs because the DSC might have different behaviors for positive samples with lung and negative samples without lungs.
Evaluation Metrics and Statistical Analysis
To accurately evaluate our lung segmentation method’s performance, we compared the conventional and deep-learning-based methods with the manually corrected results using four metrics: DSC, Jaccard similarity coefficient (JSC), mean surface distance (MSD), and Hausdorff surface distance (HSD). Representing the segmented and gold standard volumes as Vseg and Vgs, respectively, the DSC is defined as follows:
| 1 |
where |V| is the voxel count for the volume V. The JSC is defined as the intersection volume divided by the total (union) volume:
| 2 |
To calculate the MSD, the border voxels of the segmentation and gold standard results are represented as Sseg and Sgs, respectively. The border voxels are the object voxels where at least one of the six nearest neighbors does not belong to the object. For each voxel p along a given border, the closest voxel along the corresponding border in the other result is given by dmin(p, Sgs), p ∈ Sseg or dmin(p, Sseg), p ∈ Sgs. After calculating all of these distances for the border voxels in both gold standard and segmentation results, their average gives the MSD as follows:
| 3 |
where N1 and N2 are the numbers of voxels on the border surfaces of the segmentation and gold standard results, respectively. The HSD is similar to the MSD, but involves taking the maximum of the voxel distances instead of the mean, as follows:
| 4 |
Further details of these two surface distance metrics are given by Ginneken et al. [20], who investigate the degree of deviation between the segmented and true surfaces.
Paired t tests were used to determine whether the differences in the DSC, JSC, MSD, and HSD values for the deep-learning (DL) and conventional (CM) segmentation methods were significant. All statistical tests were carried out using SciPy [21] in Python.
Results
All four metrics were calculated for 3D with adjacent 2D results stacked. The test data consisted of data for approximately equal numbers of COP (27), NSIP (25), and UIP (27) patients, and the performance metrics were calculated separately for each disease class. We also evaluated the effectiveness of our model for volumetric CT images.
Performance Comparison
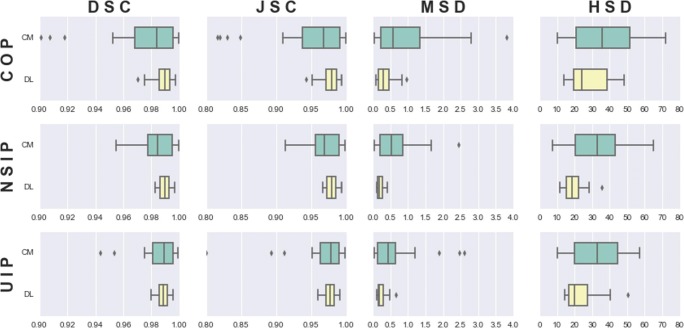
Table 1 and Fig. 3 compare the results for both methods (DL and CM) for all four metrics (DSC, JSC, MSD, and HSD) on the test dataset. Since the gold standards were based on the CM results, its results would be correlated accordingly. However, DL gave better results for all classes compared with CM, with smaller standard deviations in every case, which means that it showed good generalization. The DSC results show that the method was most accurate for NSIP and least accurate for COP. Although the overall results were significantly different for all four metrics (p < 0.001), only the DSC, JSC, and MSD were significantly different (p < 0.01) for COP, and the MSD and HSD were significantly different for UIP and NSIP.
Table 1.
DILD segmentation results, compared with the manual correction baseline (CM, conventional segmentation; DL, deep-learning segmentation)
| DSC (%) | JSC (%) | MSD (mm) | HSD (mm) | ||
|---|---|---|---|---|---|
| COP | CM | 97.28 ± 3.14* | 94.88 ± 5.72* | 0.99 ± 0.99* | 37.75 ± 18.61 |
| DL | 98.79 ± 0.70 | 97.62 ± 1.36 | 0.34 ± 0.24 | 31.39 ± 18.16 | |
| UIP | CM | 98.21 ± 2.35 | 96.58 ± 4.28 | 0.63 ± 0.71* | 33.54 ± 13.81* |
| DL | 98.84 ± 0.45 | 97.70 ± 0.87 | 0.24 ± 0.13 | 23.45 ± 9.15 | |
| NSIP | CM | 98.28 ± 1.44 | 96.66 ± 2.76 | 0.67 ± 0.62* | 32.55 ± 15.48* |
| DL | 98.92 ± 0.42 | 97.87 ± 0.83 | 0.21 ± 0.09 | 19.93 ± 6.08 | |
| Total | CM | 97.88 ± 2.53** | 95.97 ± 4.64** | 0.77 ± 0.82** | 34.84 ± 16.34** |
| DL | 98.84 ± 0.55 | 97.71 ± 1.07 | 0.27 ± 0.18 | 25.47 ± 13.63 | |
(*p value < 0.01, **p value < 0.001)
Fig. 3.
Ninety-five percent confidence intervals for all metrics for all DILD subgroups (green, CM; yellow, DL)
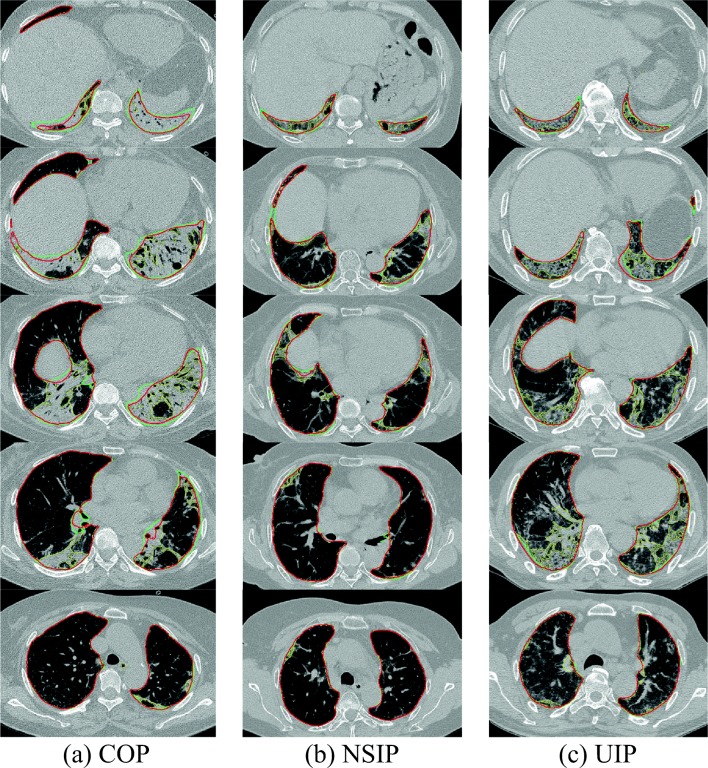
In addition to the quantitative evaluation presented above, we selected a set of representative cases for visual assessment. These cases, the ones that yielded the lowest DSC values for COP, NSIP, and UIP (97.07%, 98.29%, and 97.97%, respectively), are shown in Fig. 4. Even though these cases yielded the lowest DL results, DL showed some improvement over CM, particularly in the lower lung. In addition, we can observe that DL still shows marked differences from the gold standard in areas where the boundary could not be clearly defined.
Fig. 4.
DL results with the lowest DSC values for a COP (97.07%), b NSIP (98.29%), and c UIP (97.97%) (green, gold standard; yellow, CM; red, DL)
Evaluation for Volumetric CT
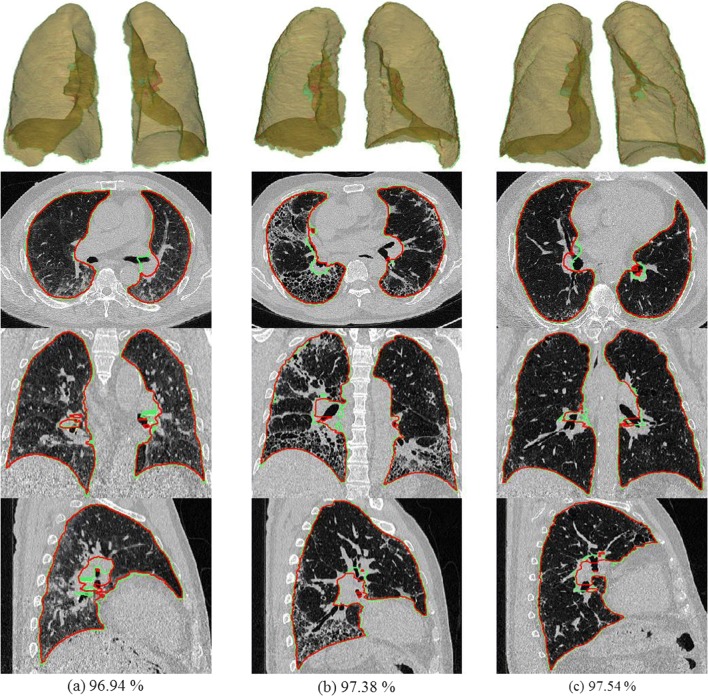
In general, applying 2D-based methods to 3D data could give rise to various problems. If the model does not generalize to slices that are severely disconnected along the z-axis, the lung volume boundary in that direction will likely be wrong, causing critical errors. To test this, we created an independent set of volumetric CT images to evaluate our model’s generalizability. We calculated values for four metrics similar to those used for HRCT, and the results are shown in Table 2. In addition, Fig. 5 shows multi-planar reconstruction and 3D rendered views for the cases with the three lowest DSC values (96.94%, 97.38%, and 97.54%). Although these values are slightly lower than those for HRCT, visual evaluation shows that the results are very reasonable.
Table 2.
Segmentation results for the volumetric chest CT images
| DSC (%) | JSC (%) | MSD (mm) | HSD (mm) | ||
|---|---|---|---|---|---|
| UIP | DL | 98.29 ± 0.56 | 96.65 ± 0.11 | 0.80 ± 0.21 | 26.57 ± 11.26 |
Fig. 5.
Volumetric CT images for the cases with the three lowest DSC values (green, gold standard; red, DL)
Discussion
As the deep-learning model requires a large amount of data for good generalization, the gold standard was generated and then manually corrected in a robust and efficient way based on initial CM segmentation. A 2D U-Net was used to segment volumetric CT and HRCT images with DILDs, and the lung segmentation results were evaluated both quantitatively and visually. Four segmentation accuracy metrics were used, namely, DSC, JSC, MSD, and HSD, and all four indicated that the 2D U-Net model significantly improved segmentation accuracy compared with the CM. In addition, the U-Net model was robust, showing significantly lower standard deviations for these metrics. Of the DILD subclasses, segmentation accuracy was lowest for COP, presumably because the parenchymal disorders caused by COP’s large chronic consolidations further obscured the lung boundaries.
The segmentation accuracy was also qualitatively evaluated by assessing the images with the lowest DSC scores visually. This showed that, compared with the gold standard, there were no critical errors and the lung region was well segmented, even for severe parenchymal disorders, as shown in Fig. 4a. The main differences occurred in the hilum area of a lung that was not clearly defined even in the gold standard image.
In addition, the model’s performance was evaluated using independent volumetric CT scans of UIP patients. For a volumetric CT scan with around 300 slices, the inference time was less than 30 s with an NVIDIA GTX 1080 Ti GPU on a PC running Ubuntu 16.04. Using accuracy metrics similar to those for HRCT, the model’s accuracies in this case were similar to those for HRCT. Visual assessment also showed no noticeable errors, and sometimes even better generalization than that for the gold standard, because the lung is somewhat uniform in the z-axis direction.
That said, the scope of these results must be kept in mind. This model still needs to be applied to a range of chest CT scans for additional diseases, from different vendors and using different protocols. In addition, volumetric CT data of sub-millimeter thickness should be collected and the results for a 3D U-Net should be evaluated and compared with those of 2D-based model.
Conclusions
For a segmentation model of lungs with DILD, we have efficiently created gold standards from conventional image processing results and used them to train a relatively simple U-Net-based CNN. Our method demonstrated performance improvements for lungs with DILD according to four different segmentation accuracy metrics, for patients scanned with two different clinical protocols, namely, HRCT and volumetric CT.
Funding Information
This work was supported by the Industrial Strategic technology development program (10072064) funded by the Ministry of Trade Industry and Energy (MI, Korea) and by Kakao and Kakao Brain corporations.
Compliance with Ethical Standards
Conflict of Interest
The authors declare that they have no conflicts of interest.
Footnotes
Publisher’s Note
Springer Nature remains neutral with regard to jurisdictional claims in published maps and institutional affiliations.
References
- 1.Franks TJ, Galvin JR, Frazier AA. The use and impact of HRCT in diffuse lung disease. Current Diagnostic Pathology. 2004;10(4):279–290. doi: 10.1016/j.cdip.2004.03.003. [DOI] [Google Scholar]
- 2.Massoptier L, Misra A, Sowmya A, Casciaro S. Combining Graph-Cut Technique and Anatomical Knowledge for Automatic Segmentation of Lungs Affected By Diffuse Parenchymal Disease in HRCT mages. International Journal of Image and Graphics. 2011;11(04):509–529. doi: 10.1142/S0219467811004202. [DOI] [Google Scholar]
- 3.Jun S, Park B, Seo JB, Lee S, Kim N. Development of a Computer-Aided Differential Diagnosis System to Distinguish Between Usual Interstitial Pneumonia and Non-specific Interstitial Pneumonia Using Texture-and Shape-Based Hierarchical Classifiers on HRCT mages. Journal of Digital Imaging. 2018;31(2):235–244. doi: 10.1007/s10278-017-0018-y. [DOI] [PMC free article] [PubMed] [Google Scholar]
- 4.Kim GB, Jung K-H, Lee Y, Kim H-J, Kim N, Jun S, Seo JB, Lynch DA. Comparison of Shallow and Deep Learning Methods on Classifying the Regional Pattern of Diffuse Lung Disease. Journal of Digital Imaging. 2018;31(4):415–424. doi: 10.1007/s10278-017-0028-9. [DOI] [PMC free article] [PubMed] [Google Scholar]
- 5.Kalinovsky A, Kovalev V. Lung image segmentation using deep learning methods and convolutional neural networks. International Conference on Pattern Recognition and Information Processing (PRIP-2016), Minsk, Belarus, 2016
- 6.Krizhevsky A, Sutskever I, Hinton GE. Imagenet classification with deep convolutional neural networks. Advances in neural information processing systems, NIPS 2012, http://papers.nips.cc/paper/4824-imagenet-classification-with-deep-convolutional-neural-networks.pdf. Accessed 5 May 2018
- 7.LeCun Y, Boser B, Denker JS, Henderson D, Howard RE, Hubbard W, Jackel LD. Backpropagation applied to handwritten zip code recognition. Neural computation. 1989;1(4):541–551. doi: 10.1162/neco.1989.1.4.541. [DOI] [Google Scholar]
- 8.Deng J, Dong W, Socher R, Li L, Li, K, Fei-Fei L. ImageNet: A Large-Scale Hierarchical Image Database. Proc of IEEE Computer Vision and Pattern Recognition, 2009. 2009, http://www.image-net.org/papers/imagenet_cvpr09.pdf. Accessed 5 May 2018
- 9.Krizhevsky A, Hinton G. Learning multiple layers of features from tiny images. Citeseer, 2009
- 10.Schmidhuber J. Deep learning in neural networks: An overview. Neural networks. 2015;61:85–117. doi: 10.1016/j.neunet.2014.09.003. [DOI] [PubMed] [Google Scholar]
- 11.Raghu G, Collard HR, Egan JJ, Martinez FJ, Behr J, Brown KK, Colby TV, Cordier JF, Flaherty KR, Lasky JA, Lynch DA, Ryu JH, Swigris JJ, Wells AU, Ancochea J, Bouros D, Carvalho C, Costabel U, Ebina M, Hansell DM, Johkoh T, Kim DS, King te Jr, Kondoh Y, Myers J, Müller NL, Nicholson AG, Richeldi L, Selman M, Dudden RF, Griss BS, Protzko SL, Schünemann HJ, ATS/ERS/JRS/ALAT Committee on Idiopathic Pulmonary Fibrosis An official ATS/ERS/JRS/ALAT statement: idiopathic pulmonary fibrosis: evidence-based guidelines for diagnosis and management. American Journal of Respiratory and Critical Care Medicine. 2011;183(6):788–824. doi: 10.1164/rccm.2009-040GL. [DOI] [PMC free article] [PubMed] [Google Scholar]
- 12.McCormick M, Johnson H, Ibanez L. The ITK Software Guide: The insight segmentation and registration toolkit, 2015, https://itk.org/. Accessed 5 May 2018
- 13.Armato SG, Giger ML, Moran CJ, Blackburn JT, Doi K, MacMahon H. Computerized detection of pulmonary nodules on CT scans. Radiographics. 1999;19(5):1303–1311. doi: 10.1148/radiographics.19.5.g99se181303. [DOI] [PubMed] [Google Scholar]
- 14.Hu S, Hoffman EA, Reinhardt JM. Automatic lung segmentation for accurate quantitation of volumetric X-ray CT images. IEEE Transactions on Medical Imaging. 2001;20(6):490–498. doi: 10.1109/42.929615. [DOI] [PubMed] [Google Scholar]
- 15.Ronneberger O, Fischer P, Brox T. U-net: Convolutional networks for biomedical image segmentation. arXiv preprint arXiv:1505.04597, 2015
- 16.Long J, Shelhamer E, Darrell T, editors. Fully convolutional networks for semantic segmentation. IEEE Transactions on Pattern Analysis and Machine Intelligence Archive 39(4)640–651, 2017 [DOI] [PubMed]
- 17.Çiçek Ö, Abdulkadir A, Lienkamp SS, Brox T, Ronneberger O, editors. 3D U-Net: learning dense volumetric segmentation from sparse annotation. International Conference on Medical Image Computing and Computer-Assisted Intervention: Springer, 2016
- 18.Milletari F, Navab N, Ahmadi S-A, editors. V-net: Fully convolutional neural networks for volumetric medical image segmentation. 3D Vision (3DV), 2016 Fourth International Conference on; IEEE, 2016
- 19.Kingma DP, Ba J: Adam: A method for stochastic optimization. arXiv preprint arXiv:14126980. 2014.
- 20.Van Ginneken B, Heimann T, Styner M. 3D segmentation in the clinic: A grand challenge. 3D segmentation in the clinic: a grand challenge. 7–15, 2007, http://sliver07.org/p7.pdf. Accessed 5 May 2018
- 21.Jones E, Oliphant T, Peterson P. SciPy: Open source scientific tools for Python. 2001, http://www.scipy.org/. Accessed 5 May 2018


