

Abstract
To create realistic three-dimensional (3D) vascular models from 3D time-of-flight magnetic resonance angiography (3D-TOF MRA) of an intracranial aneurysm (IA). Thirty-two IAs in 31 patients were printed using 3D-TOF MRA source images from polylactic acid (PLA) raw material. Two observers measured the maximum IA diameter at the longest width twice separately. A total mean of four measurements as well as each observer’s individual average MRA lengths were calculated. After printing, 3D-printed anatomic models (PAM) underwent computed tomography (CT) acquisition and each observer measured them using the same algorithm as applied to MRA. Inter- and intra-observer consistency for the MRA and CT measurements were analyzed using the intraclass correlation coefficient (ICC) and a Bland-Altman plot. The mean maximum aneurysm diameter obtained from four MRA evaluations was 8.49 mm, whereas it was 8.83 mm according to the CT 3D PAM measurement. The Wilcoxon test revealed slightly larger mean CT 3D PAM diameters than the MRA measurements. The Spearman’s correlation test yielded a positive correlation between MRA and CT lengths of 3D PAMs. Inter and intra-observer consistency were high in consecutive MRA and CT measurements. According to Bland-Altman analyses, the aneurysmal dimensions obtained from CT were higher for observer 1 and observer 2 (a mean of 0.32 mm and 0.35 mm, respectively) compared to the MRA measurements. CT dimensions were slightly overestimated compared to MRA measurements of the created models. We believe the discrepancy may be related to the Laplacian algorithm applied for surface smoothing and the high slice thickness selection that was used. However, ICC provided high consistency and reproducibility in our cohort. Therefore, it is technically possible to produce 3D intracranial aneurysm models from 3D-TOF MRA images.
Keywords: 3D-TOF magnetic resonance angiography, Intracranial aneurysm, Three-dimensional printing
Introduction
An aneurysm in the arterial circulation of the brain can be simply defined as a weak-ballooning area with a tendency to rupture, which is the leading cause of subarachnoid hemorrhage (SAH) in adults. Approximately, 1.5–5% of the general population has or will develop a cerebral aneurysm and 0.5–3% of individuals with an aneurysm may suffer from SAH [1].
Digital subtraction angiography (DSA) is the gold standard for detecting intracerebral aneurysm (IA). Computed tomography angiography (CTA) is frequently used because this noninvasive technique does not require vascular catheterization and is more easily accessed than DSA [2]. However, ionizing radiation exposure and administration of iodinated contrast agents are the main disadvantages of these two diagnostic modalities. On the other hand, 3D time-of-flight magnetic resonance angiography (3D-TOF MRA) imaging is a radiation- and contrast-free imaging technique used for the screening of IAs.
As another diagnostic adjunct to cross-sectional imaging, the use of three-dimensional (3D) printing for vascular modeling is a rapidly developing technique and vascular outputs are frequently used in the demonstration of IAs [3–6]. Previous studies have focused on 3D materialization of 3D-printed anatomic models (PAM) derived from CTA or DSA [3–10]. However, 3D vascular modeling for IA provided from 3D-TOF MRA imaging is a very rare field, and to the best of our knowledge, has not been fully investigated to date. Therefore, we investigated the reliability of 3D modeling of IAs derived from 3D-TOF MRA images by correlating the maximum aneurysm diameter obtained from MRA images with thin-section CT examinations of 3D PAMs.
Methods
Patient Selection
In this retrospective study, a total of 40 cases between February 2012 and October 2017 from the Picture Archiving and Communication System (PACS) with a diagnosis of incidentally diagnosed IAs were enrolled. Patients with low-quality images due to technical issues (motion artifacts, suspicious aneurysms detected initially with MRA and latterly excluded with DSA), ruptured aneurysm with accompanying SAH, small aneurysms with a maximum threshold size of 3 mm or less and IAs with a partially thrombosed component were excluded from the study. Finally, 31 cases that matched the criteria were selected for further evaluation. The Institutional Ethics Committee approved this retrospective study and waived the informed consent requirement (ID: 17-6-19).
Magnetic Resonance Angiography Evaluation
MRA examinations of all cases were performed with a 1.5 T MR system (Philips Achieva, Philips Medical System, The Netherlands) in a Sense-Head-8 receiver head coil. A total average of 140 axial sections in a 3D-TOF MRA sequence from each case with a cross-sectional thickness of 1.4 mm was used to interpret MRA images. The settings were as follows: repetition time (RT)/echo time (ET), 23/6.9 ms; flip angle, 20°; field of view, 200 mm × 189 mm × 98 mm; matrix, 268 × 178. Images were transferred to Aquarius Workstation (version 4.4.13; TeraRecon Inc., San Mateo, CA) and evaluated by two separate radiologists experienced in neuroradiology. To establish the maximum aneurysm measurement, each aneurysm was reviewed in three basic orthogonal plains (axial, sagittal, and coronal; Fig. 1). The section with the maximum aneurysm diameter was noted, and each reviewer evaluated the maximum length of an IA twice. Four measurements from each patient were averaged and two mean dimensions from observers 1 and 2 were calculated separately.
Fig. 1.

a–c 3D TOF MRI of a 74-year-old-man with saccular intracerebral aneurysm arising from terminal ICA is depicted. Axial (a), sagittal (b), and coronal (c) images (arrows) show aneurysmal outpouching
Data Extraction and Segmentation
The thresholding method was used for segmentation to convert the grayscale images into binary data. The value of each pixel was calculated using the following formula:
The new value for pixels that exceeded the threshold value of T was set to 1, whereas the value for pixels below this threshold was set to 0. Digital Imaging and Communications in Medicine (DICOM) images were transferred to a personal computer running 3D Slicer (version 4.5.0-1 r24735, Windows 10/64-bit OS) image processing software. To segment aneurysms, semi-automatic thresholding was applied firstly to the image under analysis to help distinguish the aneurysms from the periphery of the vessel and background noise. Any pixel with an intensity value above the threshold acquired the maximum intensity while any pixel with an intensity value below the threshold was set to zero intensity.
The threshold was set iteratively until the best compromise was obtained between maximizing the vessel of aneurysms visible, while minimizing the retention of background noise. Within 3D Slicer, a threshold value was applied to each slice image and adjusted until the elimination of noise was deemed satisfactory by the user. The aneurysms remaining on each resulting image were then manually traced to segment the aneurysms from the vessel periphery signal. 3D Slicer then stacked the slices of traced aneurysms, forming the 3D vessel rendering. DICOM files were converted into stereolithographic files and *.stl files were obtained subsequently. Then, each digital model was edited to repair the artifacts in the polygonal structures and rendered (Fig. 2a) [11–13].
Fig. 2.

a, b Image shows segmentation and data extraction process (pre-smoothing) from 3D TOF MRA data set with 3D Slicer software (a). Image depicts surface extraction and model processing (post-smoothing) of digital model via Z Brush software (b)
Surface Extraction and Model Processing
The final digital models consisted of a 3D mesh made up of thousands of polygons. Automatic smoothing was applied to the digital surface models to reduce the number of polygons using the Laplacian algorithm. The digital models were segmented, smoothed, and printed by anatomists experienced in 3D model materialization. For this, automatic smoothing software (ZBrush; Pixologic Inc. version 4R7 P3 473.32, Windows 10/64-bit OS) was used (Fig. 2b). Each process took approximately 2–3 min to complete.
Once the models were rendered free of errors, the data were reconverted into a *.stl format. Then, mesh editing was applied to the extracted surface models to obtain a realistic appearance resembling that of the 3D-TOF MRI scans.
3D Printing
After segmentation and model processing, the 3D models with the *.stl format were converted into G-code for 3D printing. Physical outputs of the processed 3D digital models were created using a 3D printer (Pharaoh XD printer, Mass Portal, Riga, Latvia) using polylactic acid (PLA) as the raw material. The solid 3D PAMs were printed resting on a support floor made of PLA and were structurally similar to that of the circle of Willis but without any skull bone (Fig. 3).
Fig. 3.
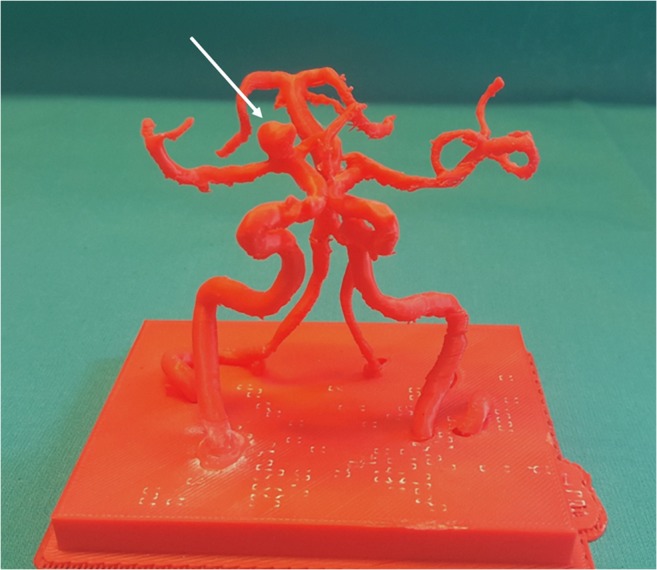
Photographic image of 3D-printed anatomic model (arrow) created from polylactic acid raw material
3D-Printed Anatomic Model Evaluation with Computed Tomography
After obtaining the hardcopy vessel models, each PAM was scanned by a 64-slice CT scanner (Aquillon 64, Toshiba Medical Systems, Tokyo, Japan) with a section thickness of 0.5 mm. Images were transferred to a workstation to enable 3D post-processing and multi-planar reformatting (Fig. 4). Each PAM was evaluated by the same two observers using the same algorithm as applied to MRA evaluation. The orthogonal plane in which the maximum aneurysm size was captured by MRA evaluation was also applied to the PAM CT evaluation to enable full compliance between the MRA and CT measurements.
Fig. 4.

a–d CT scan of the model is shown in axial (a), sagittal (b), coronal (c), and 3D reconstruction (d) images
Statistical Analyses
Histogram analyses and Shapiro-Wilk’s tests were used to determine the distribution of the variables. A student’s t test was used to compare ages between sexes. To compare the MRA and CT measurement averages, a Wilcoxon test was utilized. Spearman correlation analyses were used to determine the relationship between the mean MRA lengths and the mean CT diameters. Inter-class correlation coefficients (ICCs) were calculated for each observer to ensure consistency in consecutive MRA and CT measurements. Intra-class correlation coefficients were determined to ensure agreement between the observers. Bland-Altman analyses were performed to determine the coherence between the CT and MRA measurements for each of the observers and confidence intervals (CIs). The level of significance was taken as p < 0.05. Statistical analyses were performed using statistical software (Statistical Package for Social Sciences, version 20.0, SPSS Inc., Chicago, IL, USA and MedCalc software, version 18.0 MedCalc, Ostend, Belgium).
Results
A total of 31 patients (21 females and 10 males) diagnosed with IA were included in the study group (mean age ± SD, 63.8 ± 10.2). The mean age ± SD and the origins of the IAs are shown in Table 1. There were no statistically significant differences in terms of age between the two sexes (p = 0.750). Whole aneurysms were from the anterior circulation and predominantly originated from the MCA (50%) (Table 1). Because one case in the study group had both an aneurysm in the internal carotid artery (ICA) and the middle cerebral artery (MCA) concurrently, a total of 32 aneurysms were analyzed.
Table 1.
Descriptive properties and mean intracranial aneurysm measurements of the cohort
| Age | Mean ± std |
| Male | 63.0 ± 12.3 |
| Female | 64.3 ± 9.4 |
| Location of aneurysm | % (n) |
| Middle cerebral artery | 50 (16) |
| Internal carotid artery | 21.8 (7) |
| Anterior communicating artery | 18.7 (6) |
| Anterior cerebral artery | 9.4 (3) |
| MRA measurement | Mean ± std |
| Observer 1 | 8.49 ± 3.51 |
| Observer 2 | 8.49 ± 3.48 |
| CT measurement | Mean ± std |
| Observer 1 | 8.81 ± 3.38 |
| Observer 2 | 8.84 ± 3.37 |
The mean maximum aneurysm diameter obtained from four MRA evaluations was 8.49 ± 3.49 mm and the average of four CT measurements was 8.83 ± 3.38 mm. The Wilcoxon test revealed that the CT sizes of the 3D PAMs were larger than the MRA (p = 0.030, z = − 2.169). However, according to the Spearman correlation analyses, there was a positive correlation between the groups (Spearman’s Rho correlation coefficient 0.912, p < 0.001).
Both mean dimensions calculated for the MRA and CT evaluations from observer 1 and observer 2 are shown in Table 1 (Fig. 5). The CT measurements were higher than the MRA measurements according to Bland-Altman analyses (Fig. 6). Observer 1 and observer 2 over-estimated with an average value of 0.32 mm (95%CI [− 1.20–1.84]) and 0.35 mm (95%CI [− 1.26–1.96]), respectively.
Fig. 5.

a, b Graphic demonstrates intracranial aneurysm MRA averages of observers 1 and 2 for two consecutive measurements (a). Graphic reveals CT diameter means of 3D-printed anatomical model averaged by observers 1 and 2 for two serial measurements (b)
Fig. 6.

a, b Bland-Altman plots of the mean differences between CT and MRA diameter means of 3D-printed anatomical models averaged by observer 1 (a) and observer 2 (b)
Inter- and intra-class correlation tests yielded a high degree of agreement in the measurements. In the consecutive MRA and CT maximum aneurysmal diameter evaluations, observer 1 and 2 results were statistically close and correlated (observer 1, MRA ICC 0.999; p < 0.001, CT ICC 0.999; p < 0.001 and observer 2, MRA 0.999 p < 0.001, CT ICC 1.000 p < 0.001). Similarly, there was also a high degree of agreement between the MRA and CT measurement averages between the two observers (ICC 1.000; p < 0.001).
Discussion
The most important novelties of the current study when compared to previous similar works are our attempt to utilize 3D-TOF MRI images in 3D PAM materialization for IAs that do not require contrast media or ionizing radiation and relatively higher number of IAs that we enrolled.
The use of three-dimensional vascular designs in the field of medicine are increasing not only because they constitute practical haptic educational objects for medical students as well as postgraduates, but also due to their potential to yield preprocedural simulation platforms for surgeons and/or interventional radiologists. In this study, we aimed to produce tactile IA models using 3D-TOF MRI source images. In addition, after rescanning of the 3D PAMs with CT, we sought inter- and intra-observer consistency with ICC and Bland-Altman plot via comparing maximal measurement of each IA obtained from CT and MRI. According to our results, despite CT dimensions of materialized IAs were slightly over estimated (roughly one-third of a millimeter) regarding MRI, they showed high inter- and intra-observer correlation.
Rupture of an IA is the most frequent risk factor for non-traumatic SAH. Therefore, diagnosis and screening are critical, particularly in a high-risk population [14]. MRA and CTA are the usual diagnostic tests in first-line screening for IA [15–17]. Based on the MRA or CTA results, suspicious findings or evident IAs are further evaluated with DSA, which is the gold standard method due to its diagnostic superiority; it may also permit a therapeutic approach, particularly for interventional radiologists [15–18]. Compared to conventional imaging modalities, we primarily aimed to produce realistic IA models from 3D-TOF MRA images.
3D-TOF MRA is a noninvasive diagnostic method that can be performed on outpatients to detect IA without ionizing radiation and catheter-related complications. However, it has some disadvantages over CTA and DSA. 3D-TOF MRA is susceptible to motion artifacts and has lower diagnostic accuracy in acute ruptured IA with accompanying SAH [19]. In addition, its sensitivity is low, particularly for small aneurysms that are below or equal to the threshold level of 3 mm [20]. Therefore, in the current study, we did not include cases with low-quality images that had resulted from motion artifacts and ruptured IAs. We also excluded cases with small IAs. The smallest recorded IA based on 3D-TOF MRA measurements was 4.21 mm in the current cohort. After eliminating all of the limitations that are inherent to 3D-TOF MRA imaging, we conclude that it is technically possible to obtain reliable 3D vascular models for IA from optimally obtained 3D-TOF MRA images.
Torres et al. [21] used 3D-printed models derived from CTA scans for endovascular aneurysm repair (EVAR) and found that patient-specific training prior to EVAR improved surgical performance and increased self-confidence during surgery residencies. Shibata et al. [22] also used 3D modeling in 15 visceral aneurysms and found that the sizes and shapes of the 3D-printed hollow visceral aneurysm models created from CTA data were accurate and compatible. Both of these studies required ionizing radiation and iodinated contrast media as part of the CTA examination. In the current study, we successfully created consistent 3D PAMs from 3D-TOF MRA examinations without contrast media administration and without the added risk of exposure to ionizing radiation.
Wurm et al. [4] created 3D PAMs from different raw materials of the skull and cerebral vessels to simulate a real aneurysm from DSA images. They did not clearly indicate the number of cases they enrolled in the study but did conclude that the models could be used to predict the vascular anatomy to optimize the surgical intervention and were also useful for advanced procedural competency training. Similarly, Kim et al. [5] created 3D hollow aneurysm models of three retrospective and eight prospective cases from CTA images. Their findings showed that the hollow 3D models could be used to simulate clipping preoperatively and that the aneurysms could be confidently treated during live surgery. Wang et al. [23] printed eight MCAs, including the skull base, which were derived from CTA images. Their results were consistent with previous studies and they recommended the use of 3D PAMs, particularly for junior neurosurgeons, to show the structure of the aneurysm and to choose the appropriate clips to use before surgery. We included more cases in our study than the number used in previous studies on 3D modeling for IAs. Moreover, our study represents the first attempt to create 3D PAMs from 3D-TOF MRA source images that are free of radiation and contrast material.
We found that the maximum average CT lengths of the 3D PAMs were slightly greater than those of MRA according to Wilcoxon tests (p = 0.030). We believe the discrepancy is due to the post-processing of DICOM images. During surface smoothing of each IA, irregularities on the outer surfaces were edited using dedicated software and the Laplacian algorithm [24, 25]. The Laplacian algorithm is used to reduce the number of polygons via automatic smoothing that corrects the triangular surface mesh. This algorithm changes the position of the nodes without changing the network topology. In the Laplacian smoothing process, each corner moves to a new position that is defined by the average position of its neighbors. Therefore, we speculate that this algorithm may have resulted in the slightly enlarged appearance of the processed DICOM images. Another explanation could be related to slice thickness selection of the 3D-TOF MRI images in our cohort. George et al. [26] suggested a slice thickness of 0.5–1.0 mm for optimal 3D printing of small vessels such as cerebral vessels and coronary arteries derived from CT or MR. However, we used an axial slice thickness of 1.4 mm. A thinner slice selection could possibly lead to a tighter correlation between the MRA measurements and the CT diameters of the 3D PAMs.
Our study had some limitations. First, we measured MRA-derived 3D PAMs using a CT diagnostic modality. However, Kim et al. [27] demonstrated no noticeable differences between intra- and inter-observer variability for both CTA- and MRA-based measurements of the size of cerebral aneurysms and therefore this limitation does not compromise the validity of our findings. Second, we were not able to print vascular PAMs including the bony structures. This limitation arises from the software processing of the DICOM images. Because the base of the skull and the bony cranium were far below the software threshold values for 3D-TOF MRA, they were automatically removed from the 3D PAMs, resulting in a model that resembled the circle of Willis. Third, the slick thickness selected in our study may have contributed to the size over-estimation. Because the majority of our cohort was treated either surgically or endovascularly after detection of the IA, we were unable to recall them for a repeat 3D-TOF MRI using a thinner slice option. Finally, we were not able to evaluate aneurysms from the posterior circulation because we did not encounter any in our cohort during the PACS screening. More extensive studies with 3D PAMs produced from the posterior circulation will provide more complete data for vertebrobasilar system aneurysms in the future.
In conclusion, although 3D PAM dimensions measured using CT are slightly overestimated compared to MRA due to several technical factors, the maximum aneurysm dimensions show good intra- and inter-observer correlation. The significance of these statistical analyses is pointing out that 3D-printed IAs derived from 3D-TOF MRI images reflect the aneurysm size intimately. Therefore, they may be used as educational objects as well as patient-specific training simulation materials by neurosurgeons and interventional neuroradiologists.
Author Contributions
Study design: TA, MAO
Data assembly: ABK
Data analysis: MAO, AMK
Final approval of manuscript: TA, FG
Compliance with Ethical Standards
Conflict of Interest
The authors declare that they have no conflict of interest.
Footnotes
Publisher’s Note
Springer Nature remains neutral with regard to jurisdictional claims in published maps and institutional affiliations.
References
- 1.AHA aneurysms description. What you should know about cerebral aneurysms. Cited April 2018. Available from: https://www.strokeassociation.org/en/about-stroke/types-of-stroke/hemorrhagic-strokes-bleeds/what-you-should-know-about-cerebral-aneurysms
- 2.Fifi JT, Meyers PM, Lavine SD, Cox V, Silverberg L, Mangla S, Pile-Spellman J. Complications of modern diagnostic cerebral angiography in an academic medical center. J Vasc Interv Radiol. 2009;20:442–447. doi: 10.1016/j.jvir.2009.01.012. [DOI] [PubMed] [Google Scholar]
- 3.Wurm G, Tomancok B, Pogady P, Holl K, Trenkler J. Cerebrovascular stereolithographic biomodeling for aneurysm surgery. Technical note. J Neurosurg. 2004;100:139–145. doi: 10.3171/jns.2004.100.1.0139. [DOI] [PubMed] [Google Scholar]
- 4.Wurm G, Lehner M, Tomancok B, Kleiser R, Nussbaumer K. Cerebrovascular biomodeling for aneurysm surgery: simulation-based training by means of rapid prototyping technologies. Surg Innov. 2011;18:294–306. doi: 10.1177/1553350610395031. [DOI] [PubMed] [Google Scholar]
- 5.Kimura T, Morita A, Nishimura K, Aiyama H, Itoh H, Fukaya S, Sora S, Ochiai C. Simulation of and training for cerebral aneurysm clipping with 3-dimensional models. Neurosurgery. 2009;65:719–725. doi: 10.1227/01.NEU.0000354350.88899.07. [DOI] [PubMed] [Google Scholar]
- 6.Wang L, Ye X, Hao Q, Chen Y, Chen X, Wang H, Wang R, Zhao Y, Zhao J. Comparison of two three-dimensional printed models of complex intracranial aneurysms for surgical simulation. World Neurosurg. 2017;103:671–679. doi: 10.1016/j.wneu.2017.04.098. [DOI] [PubMed] [Google Scholar]
- 7.Leal André, Souza Mauren, Nohama Percy. Additive Manufacturing of 3D Biomodels as Adjuvant in Intracranial Aneurysm Clipping. Artificial Organs. 2018;43(1):E9–E15. doi: 10.1111/aor.13303. [DOI] [PubMed] [Google Scholar]
- 8.Wang JL, Yuan ZG, Qian GL, Bao WQ, Jin GL. 3D printing of intracranial aneurysm based on intracranial digital subtraction angiography and its clinical application. Medicine (Baltimore) 2018;97:e11103. doi: 10.1097/MD.0000000000011103. [DOI] [PMC free article] [PubMed] [Google Scholar]
- 9.Zhou LQ, Lou MW, Chen GC, Jiu ZS, Shen YX, Lu L. Value of 640-slice 3D CT angiography plus 3D printing for improving surgeries for intracranial aneurysms. Nan Fang Yi Ke Da Xue Xue Bao. 2017;37:1222–1227. doi: 10.3969/j.issn.1673-4254.2017.09.14. [DOI] [PMC free article] [PubMed] [Google Scholar]
- 10.Mashiko T, Kaneko N, Konno T, Otani K, Nagayama R, Watanabe E. Training in cerebral aneurysm clipping using self-made 3-dimensional models. J Surg Educ. 2017;74:681–689. doi: 10.1016/j.jsurg.2016.12.010. [DOI] [PubMed] [Google Scholar]
- 11.Fedorov A, Beichel R, Kalpathy-Cramer J, Finet J, Fillion-Robin J-C, Pujol S. 3D slicer as an image computing platform for the quantitative imaging network. Magn Reson Imaging. 2012;30:1323–1341. doi: 10.1016/j.mri.2012.05.001. [DOI] [PMC free article] [PubMed] [Google Scholar]
- 12.Maleike D, Nolden M, Meinzer HP, Wolf I. Interactive segmentation framework of the medical imaging interaction toolkit. Comput Methods Programs Biomed. 2009;96:72–83. doi: 10.1016/j.cmpb.2009.04.004. [DOI] [PubMed] [Google Scholar]
- 13.Parmar C, Rios Velazquez E, Leijenaar R, Jermoumi M, Carvalho S, Mak RH, Mitra S, Shankar BU, Kikinis R, Haibe-Kains B, Lambin P, Aerts HJ. Robust radiomics feature quantification using semiautomatic volumetric segmentation. PLoS One. 2014;9:e102107. doi: 10.1371/journal.pone.0102107. [DOI] [PMC free article] [PubMed] [Google Scholar]
- 14.Steiner T, Juvela S, Unterberg A, Jung C, Forsting M, Rinkel G. European stroke organization guidelines for the management of intracranial aneurysms and subarachnoid haemorrhage. Cerebrovasc Dis. 2013;35(2):93–112. doi: 10.1159/000346087. [DOI] [PubMed] [Google Scholar]
- 15.Adams WM, Laitt RD, Jackson A. The role of MR angiography in the pretreatment assessment of intracranial aneurysms: a comparative study. Am J Neuroradiol. 2000;21:1618–1628. [PMC free article] [PubMed] [Google Scholar]
- 16.Hoh BL, Cheung AC, Rabinov JD, Pryor JC, Carter BS, Ogilvy CS. Results of a prospective protocol of computed tomographic angiography in place of catheter angiography as the only diagnostic and pretreatment planning study for cerebral aneurysms by a combined neurovascular team. Neurosurgery. 2004;54(6):1329–1342. doi: 10.1227/01.NEU.0000125325.22576.83. [DOI] [PubMed] [Google Scholar]
- 17.Mallouhi A, Felber S, Chemelli A, Dessl A, Auer A, Schocke M, Jaschke WR, Waldenberger P. Detection and characterization of intracranial aneurysms with MR angiography: comparison of volume-rendering and maximum-intensity-projection algorithms. Am J Roentgenol. 2003;180:55–64. doi: 10.2214/ajr.180.1.1800055. [DOI] [PubMed] [Google Scholar]
- 18.Sailer A, Wagemans B, Nelemans P, de Graaf R, van Zwam W. Diagnosing intracranial aneurysms with MR angiography: systematic review and meta-analysis. Stroke. 2014;45:119–126. doi: 10.1161/STROKEAHA.113.003133. [DOI] [PubMed] [Google Scholar]
- 19.Pierot L, Portefaix C, Rodriguez-Régent C, Gallas S, Meder J-F, Oppenheim C. Role of MRA in the detection of intracranial aneurysm in the acute phase of subarachnoid hemorrhage. J Neuroradiol. 2013;40(11):204–210. doi: 10.1016/j.neurad.2013.03.004. [DOI] [PubMed] [Google Scholar]
- 20.HaiFeng L, YongSheng X, YangQin X, Yu D, ShuaiWen W, XingRu L, JunQiang L. Diagnostic value of 3D time-of-flight magnetic resonance angiography for detecting intracranial aneurysm: a meta-analysis. Neuroradiology. 2017;59:1083–1092. doi: 10.1007/s00234-017-1905-0. [DOI] [PubMed] [Google Scholar]
- 21.Torres IO, De Luccia N. A simulator for training in endovascular aneurysm repair: the use of three dimensional printers. Eur J Vasc Endovasc Surg. 2017;54:247–253. doi: 10.1016/j.ejvs.2017.05.011. [DOI] [PubMed] [Google Scholar]
- 22.Shibata E, Takao H, Amemiya S, Ohtomo K. 3D-printed visceral aneurysm models based on ct data for simulations of endovascular embolization: evaluation of size and shape accuracy. Am J Roentgenol. 2017;209:243–247. doi: 10.2214/AJR.16.17694. [DOI] [PubMed] [Google Scholar]
- 23.Wang L, Ye X, Hao Q, Ma L, Chen X, Wang H, Zhao Y. Three-dimensional intracranial middle cerebral artery aneurysm models for aneurysm surgery and training. J Clin Neurosci. 2018;50:77–82. doi: 10.1016/j.jocn.2018.01.074. [DOI] [PubMed] [Google Scholar]
- 24.Liu T, Chen M, Song Y, Li H, Lu B. Quality improvement of surface triangular mesh using a modified Laplacian smoothing approach avoiding intersection. Shi Y, editor. PLoS One. 2017;12:e0184206. doi: 10.1371/journal.pone.0184206. [DOI] [PMC free article] [PubMed] [Google Scholar]
- 25.Despotović Ivana, Goossens Bart, Philips Wilfried. MRI Segmentation of the Human Brain: Challenges, Methods, and Applications. Computational and Mathematical Methods in Medicine. 2015;2015:1–23. doi: 10.1155/2015/450341. [DOI] [PMC free article] [PubMed] [Google Scholar]
- 26.George E, Liacouras P, Rybicki FJ, Mitsouras D. Measuring and establishing the accuracy and reproducibility of 3D printed medical models. Radiographics. 2017;37:1424–1450. doi: 10.1148/rg.2017160165. [DOI] [PMC free article] [PubMed] [Google Scholar]
- 27.Kim HJ, Yoon DY, Kim ES, Lee HJ, Jeon HJ, Lee JY, Cho BM. Intraobserver and interobserver variability in CT angiography and MR angiography measurements of the size of cerebral aneurysms. Neuroradiology. 2017;59:491–497. doi: 10.1007/s00234-017-1826-y. [DOI] [PubMed] [Google Scholar]