Abstract
Computer-aided diagnosis (CAD) has already been widely used in medical image processing. We recently make another trial to implement convolutional neural network (CNN) on the classification of pulmonary nodules of thoracic CT images. The biggest challenge in medical image classification with the help of CNN is the difficulty of acquiring enough samples, and overfitting is a common problem when there are not enough images for training. Transfer learning has been verified as reasonable in dealing with such problems with an acceptable loss value. We use the classic LeNet-5 model to classify pulmonary nodules of thoracic CT images, including benign and malignant pulmonary nodules, and different malignancies of the malignant nodules. The CT images are obtained from Lung Image Database Consortium and Image Database Resource Initiative (LIDC-IDRI) where both pulmonary nodule scanning and nodule annotations are available. These images are labeled and stored in a medical images knowledge base (KB), which is designed and implemented in our previous work. We implement the 10-folder cross validation (CV) to testify the robustness of the classification model we trained. The result demonstrates that the transfer learning of the LeNet-5 is good for classifying pulmonary nodules of thoracic CT images, and the average values of Top-1 accuracy are 97.041% and 96.685% respectively. We believe that our work is beneficial and has potential for practical diagnosis of lung nodules.
Keywords: Pulmonary nodule, Classification, Thoracic CT, Transfer learning, CNN
Introduction
After the research on visual cortex by Hubel and Wiesel [1], lots of researches have demonstrated that convolutional neural network (CNN) can make great achievement in image classification using a very large-scale dataset with labels, such as ImageNet [2, 3]. The scale of the dataset used for CNN model training is one of the most significant factors which determines whether the CNN model can be trained well [4, 5]. In the problem of image classification, the key point of achieving an accurate model is features extracted from training images by the convolutional neural network. For example, researchers have accomplished ventricle segmentation using fully convolutional neural network (FCN) on Sunnybrook Left Ventricle Segmentation Challenge Dataset [6], the well-annotated data play a significant role in their work, and the outline of the left ventricle in every single CT image is labeled for training a CNN segmentation model. However, annotating data can be a year-long project due to the importance of datasets used for training a CNN model, and sometimes collecting enough well-annotated data is impossible due to the lack of raw data, such as medical image data. Transfer learning has been verified powerful in solving similar problems even if the dataset is not big enough [7–9]. Some other researches also indicate that the LeNet-5 can deal with cases in which the dataset is not large [10, 11]. Since researchers have already implemented LeNet-5 on Alzheimer’s disease prediction [12], our work presented in this paper is aiming at using transfer learning to achieve good classification result in classifying pulmonary nodules of thoracic CT images even if the annotated dataset is not very large.
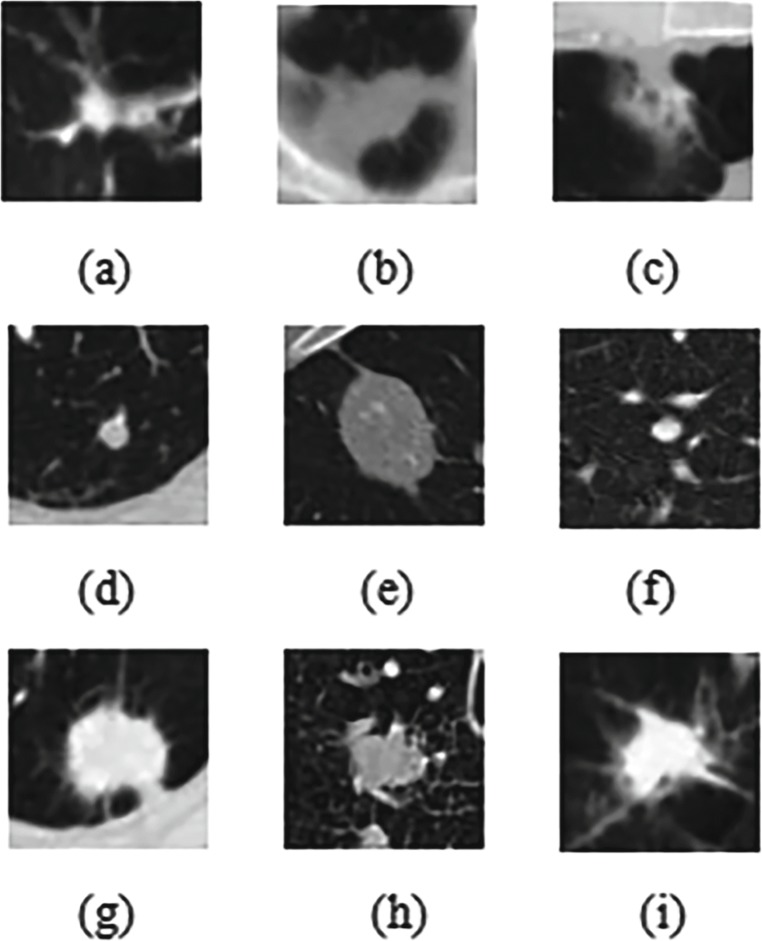
In this paper, the data we use are from the Lung Image Database Consortium and Image Database Resource Initiative (LIDC-IDRI), which contains 1018 cases in total. Images included in each case are from a clinical thoracic CT scan and an associated XML file recording the results of a two-phase image annotation process performed by four experienced thoracic radiologists [13]. For the LIDC-IDRI database, we use three categories of pulmonary nodules: (1) a malignant nodule with a diameter ≥ 0.3 cm, marked as malignant-nodule ≥ 0.3 cm; (2) nodule with a diameter < 0.3 cm, marked as nodule < 0.3cm, (3) non-nodule with a diameter ≥ 0.3 cm, marked as non-nodule ≥ 0.3 cm. For the nodule < 0.3 cm and the non-nodule ≥ 0.3 cm, only the center coordinates of nodule positions are given, while for the malignant-nodule ≥ 0.3 cm, the coordinates of the contour points of the lesion area and the information of the CT signs are given. In our work, we firstly select the malignant-nodule ≥ 0.3 cm which is assigned by all four radiologists and the non-nodule ≥ 0.3 cm which is assigned by at least three radiologists doing the classification. We try to classify the non-nodule which is totally benign and the malignant-nodule, among all pulmonary nodules. Then, the malignant-nodule ≥ 0.3 cm is reclassified according to the degree of malignancy. Malignant-nodule ≥ 0.3 cm whose malignant degree is no less than 3 is marked as “Serious-Malignant,” while the malignant-nodule ≥ 0.3 cm whose malignant degree is less than 3 is marked “Mild-Malignant.” Some of these nodules are shown in Fig. 1.
Fig. 1.
The example of lung nodule categories: a–c non-nodule ≥ 0.3 cm; d–f “Mild-Malignant” nodule ≥ 0.3 cm; g–i “Serious-Malignant” nodule ≥ 0.3cm
The development environment we use for our work is NVIDIA DIGITS and Caffe [14], with the power support of a GTX 1050Ti GPU.
Related Works
Researchers in [15] diagnosed lung cancer on the LIDC database using a multi-scale two-layer CNN, finally achieving an accuracy of 86.84%. The paper [16] uses CNN, DNN, and SAE to classify benign and malignant nodules and compares the results of these three models; the best result is from CNN, finally achieving 84.15% accuracy, 83.96% sensitivity, and 84.32% specificity. The work in [17] describes that a combination of texture and shape features for detection and classification may obtain better classification accuracy. In the paper [18], researchers use CNN to train on the LIDC-IDRI database and achieve a sensitivity of 78.9%. Using a cascaded SVM classifier, overall, the algorithm achieved sensitivity of 0.859 at 2.5 FP/volume in [19].
Our Contribution
We have implemented classic CNN architectures in training on LIDC-IDRI data, with the help of the easy-access knowledge base, certifying that transfer learning is helpful when the dataset is not too large.
We have performed a two-step classification, not only classifying benign nodules and malignant nodules, but also taking different levels of malignancies into consideration. The achieved results of Serious-Malignant and Mild-Malignant are very worth to be focused on.
We have achieved the relatively highest accuracy among related works, and in addition to the high accuracy, we have implemented 10-folder cross validation to test the robustness of our model. We also obtained high sensitivity and specificity as well as good AUC values, which means our model can be very stable. There is no other previous research in nodule classification or transfer learning that achieved such high accuracy, sensitivity, specificity, and AUC values as well as the classification of different levels of malignancies at the same time.
Theory and Method
A Medical Image KB for Pulmonary Nodules
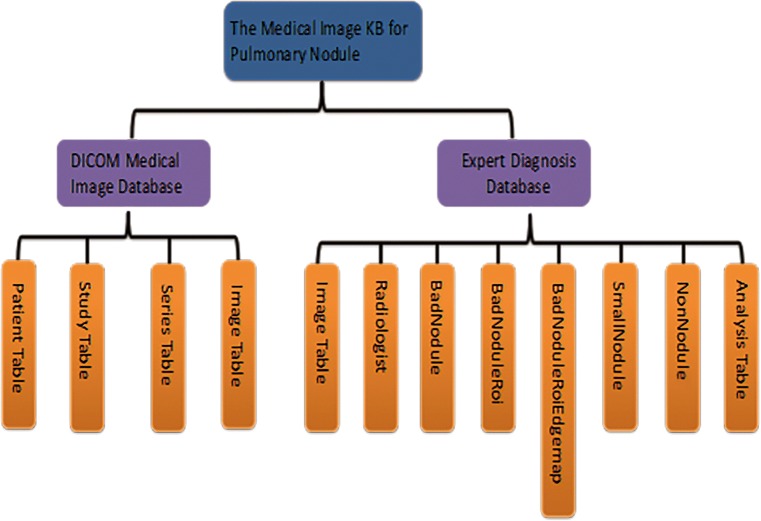
A medical image knowledge base (KB) for pulmonary nodule diagnosis has been designed and implemented in our previous work, which is shown in Fig. 2. This KB mainly stores LIDC-IDRI database at present [20]. With the help of this KB, we can easily manage LIDC-IDRI data. Retrieving the image of pulmonary nodules that we need is also convenient. To make sure that this medical image KB is more flexible and easy for expansion later, the two MySQL relational databases (DICOM medical image database and expert diagnosis database) of the KB were designed to be independent logically; however, the data were stored in the same database.
Fig. 2.
Structure of knowledge base
Deep Learning and CNN
Inspired by the human brain, hierarchical or structured deep learning is a modern branch of machine learning. Deep learning technique has been developed based on complicated algorithms. These complicated algorithms are designed to model high-level features and extract characteristics from training data using deep neural network architecture.
Convolutional neural network was firstly implemented in LeNet, which is designed by Yann LeCun et al. [10], firstly used to do classification on the MNIST dataset. With the development of CNN, many more complicated CNN architectures have been invented and applied in much more difficult problems.
Since CNN has demonstrated its great capability in medical image classification [21, 22], researches begin to focus on the application of CNN, in order to solve more and more medical image processing problems with deep learning. And, in this work, we will use deep learning to help us classify lung pulmonary nodules of thoracic CT images.
Transfer Learning
Generally, machine learning, including deep learning techniques, which are statistical models, is usually used to make predictions on future data; these models are trained on previously collected labeled or unlabeled datasets [6, 23, 24]. In some other papers, it is said that semi-supervised classification [25–28] addresses the problem that too few labeled data may not be enough to build a good classifier, until transfer learning can deal with this problem. A new mission of transfer learning came into being in 2005: the ability of a system to recognize and apply knowledge and skills learned in previous tasks to new tasks, which is given by the Broad Agency Announcement (BAA) of Defense Advanced Research Projects Agency (DARPA)’s Information Processing Technology Office (IPTO) [29]. In this definition, transfer learning aims at extracting knowledge from one or more source tasks and applies the knowledge learned from previous source tasks to a target task. Transfer learning tries to transfer the knowledge from some previous tasks to a target task when the latter has fewer high-quality training data, compared to the traditional machine learning which tries to learn each new task without previous knowledge [29].
In this paper, our work consists of two steps. In the first step, nodules are classified into malignant-nodule and non-nodule, and in the second step, malignant nodules are classified into Serious-Malignant and Mild-Malignant. The dataset we use for each step includes two parts, which means the different two classifications in our work are both binary classifications. The data we utilize consist of three parts, as is shown in the previous description, we select the malignant nodules ≥ 0.3 cm which is assigned by all four radiologists, and we name these nodules malignant-nodule, and then we select the non-nodules ≥ 0.3 cm which is assigned by at least three radiologists, and we name these nodules non-nodule. Now, we get two parts in the first step classification, we will use the first two parts of nodules to train a CNN model in order to recognize malignant-nodule and the totally benign non-nodule. Then, in step 2, we select the nodule with a no-less-than-0.3-cm diameter, also known as malignant-nodule in the first step, and then we divided these nodules into another two parts, according to the different malignant degrees. Among these nodules, as is described in the previous context, we have marked the malignant nodules ≥ 0.3 cm with a malignant degree level that is no less than 3 as Serious-Malignant, while the malignant nodules ≥ 0.3 cm with a malignant degree level that is less than 3 has been marked as Mild-Malignant.
Since the data used for our two-step classifications are partly overlapped, the inductive transfer learning [29] provides theoretical support for us to implement “one CNN architecture” to solve our two-step classification problem. Previous works of other researchers have demonstrated that the parameter-transfer approach is one approach that deals with transfer learning problems by transferring neural network parameters pretrained in some other problems [30–34]. The parameter-transfer approach tries to transfer the pretrained model or parameters from a source task to a target task, and both tasks are dealing with data in a related domain [29]. We use the LeNet-5 architecture to firstly classify our malignant-nodule and non-nodule, and then we use the same architecture to classify the Serious-Malignant and the Mild-Malignant in the Malignant-Nodule.
The CNN Architecture Implemented in Our Work
LeNet: LeNet, first introduced by Yann LeCun [10], is a milestone marking when the first CNN came into being. As the most typical model for handwritten character recognition using the MNIST dataset, the LeNet architecture is seldom transferred into other classification works. As is shown in Fig. 3, the LeNet-5 architecture we use in this work has one power layer for input scaling, two convolution layers with “Xavier” initialization method [35], two MAX pooling layers, and two fully connected layers with Xavier initialization method. Although the LeNet architecture is firstly designed for training a 28 × 28 MNIST dataset, we find out that the well-cropped 64 × 64 images in this work perform really well. The CT images stored in the LIDC-IDRI database are all 512 × 512 single-channel grayscale images. The nodule sizes vary remarkably in each different image, ranging from less than 3 mm to more than 30 mm (3 mm accounts for about 3–4 pixels). In addition to the small size of pulmonary nodules in the whole-lung CT image, pulmonary nodule detection can also be interfered with vascular, tracheal, and some inflammatory lesions in the lungs. Therefore, in order to improve our accuracy of lung pulmonary nodule recognition, we crop 64 × 64 nodule patch from the CT image based on the marked nodule centers, then the cropped 64 × 64 nodule patch images are used as input instead of the original 512 × 512 CT images.
Fig. 3.
The LeNet-5 architecture that we implement
Classification and Result
Data Preparation
The training images we utilize in our classification work are from the LIDC-IDRI database. Previously, we have stored the plain-text diagnostic information of XML and CT images with related image information from LIDC-IDRI database into our own medical image KB. Due to the KB’s powerful function in data management and query, we can easily access and compare the morphology, location, and CT signs of pulmonary nodules in CT images; also, we make it easy to use for other researchers.
We select 4927 nodules which are malignant-nodule ≥ 0.3 cm, as assigned by all four radiologists, and 2946 nodules that are non-nodule ≥ 0.3cm, as assigned by at least three radiologists. Among the 4927 malignant-nodule ≥ 0.3 cm, 3525 nodules are marked as Serious-Malignant and the remaining 1402 nodules are marked as Mild-Malignant.
The size of chest CT images in the LIDC-IDRI database is 512 × 512 pixels, as is shown in our previous description in this paper, we firstly cut the CT images into the size of 64 × 64 pixels based on the marked nodule centers, and then we normalize the resampled CT images in Matlab using the following formula: Out = (In − MinValue)/(MaxValue − MinValue).
We find that in our first step, pulmonary nodule classification, a good classification result can be obtained by using the small dataset, including 4927 malignant-nodules and 2946 non-nodules. While, in the second step classification, the better classification result is obtained after data augmentation. In this paper, we augment the training data of Serious-Malignant and Mild-Malignant by performing shift and rotation on each nodule data. To get a balanced dataset, we firstly shift each nodule in Mild-Malignant and get the number of these nodules doubled, and then rotate each image by 50∘ from 0∘ to 350∘, resulting in 19,628 Mild-Malignant nodules. Then, we rotate the original 3525 nodules in the Serious-Malignant by 60∘ from 0∘ to 360∘, finally achieving 21,150 Serious-Malignant nodules. The complete data processing steps are shown in Fig. 4, and the dataset is shown in Tables 1 and 2.
Fig. 4.
The flowchart of image preprocessing
Table 1.
Dataset used in classifying malignant-nodule and non-nodule’
| Training set (80%) | Validation set (10%) | Testing set (10%) | ||||||
|---|---|---|---|---|---|---|---|---|
| 6299 | Malignant | 3942 | 788 | Malignant | 493 | 786 | Malignant | 492 |
| Non | 2357 | Non | 295 | Non | 294 | |||
Table 2.
Dataset used in classifying Serious-Malignant and Mild-Malignant
| Training set (80%) | Validation set (10%) | Testing set (10%) | ||||||
|---|---|---|---|---|---|---|---|---|
| 32622 | Serious | 16920 | 4078 | Serious | 2115 | 4078 | Serious | 2115 |
| Mild | 15702 | Mild | 1963 | Mild | 1963 | |||
Pulmonary Classification Results
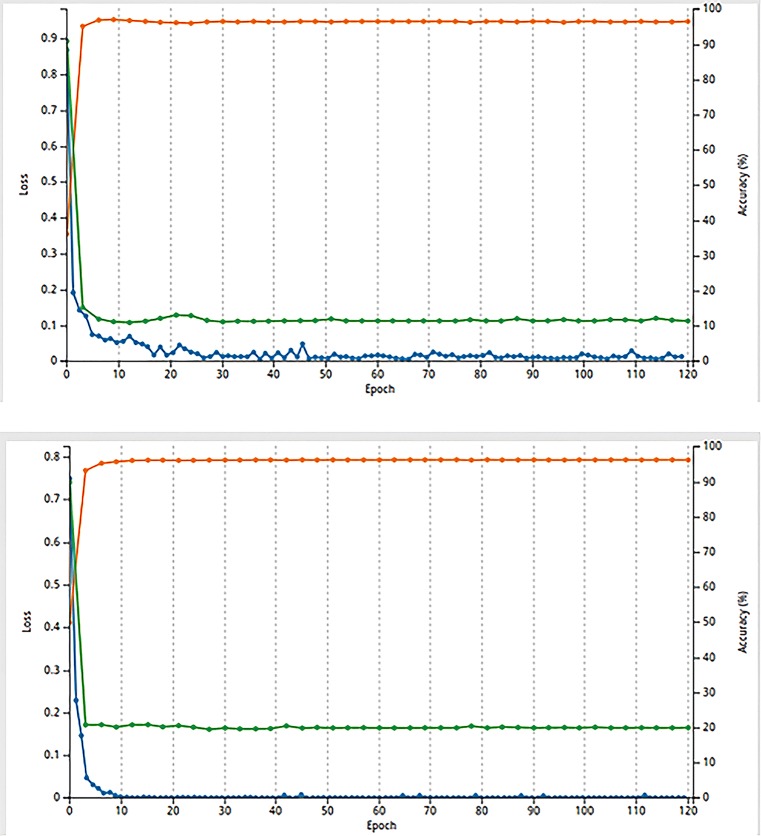
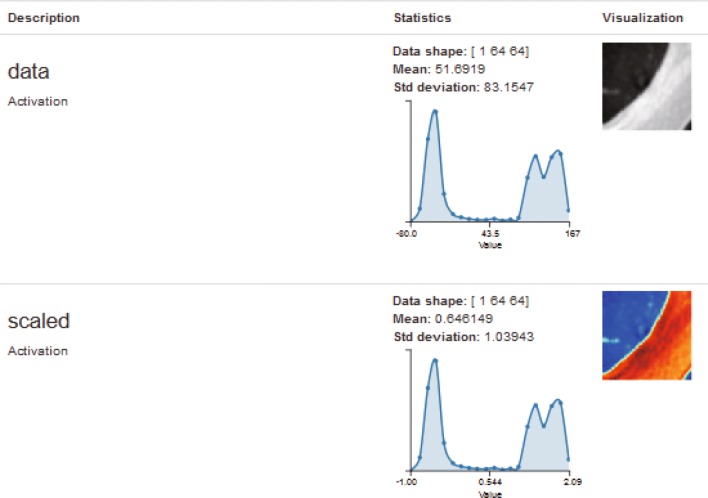
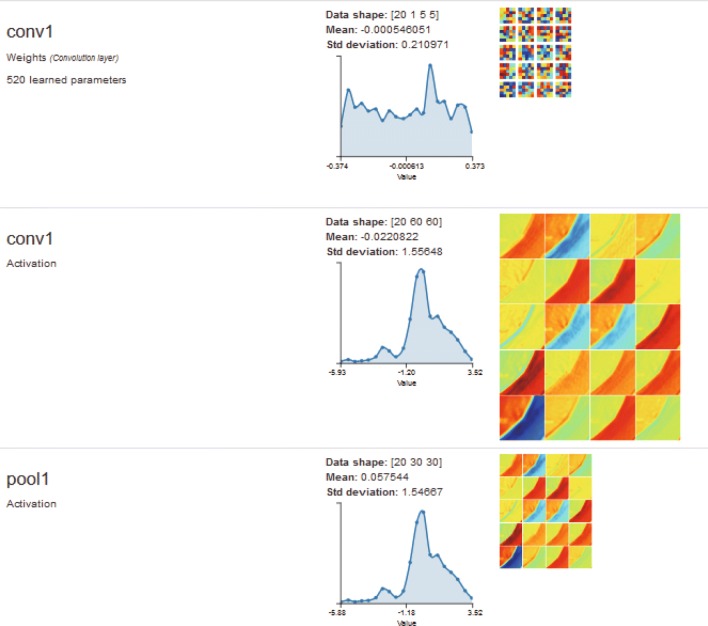
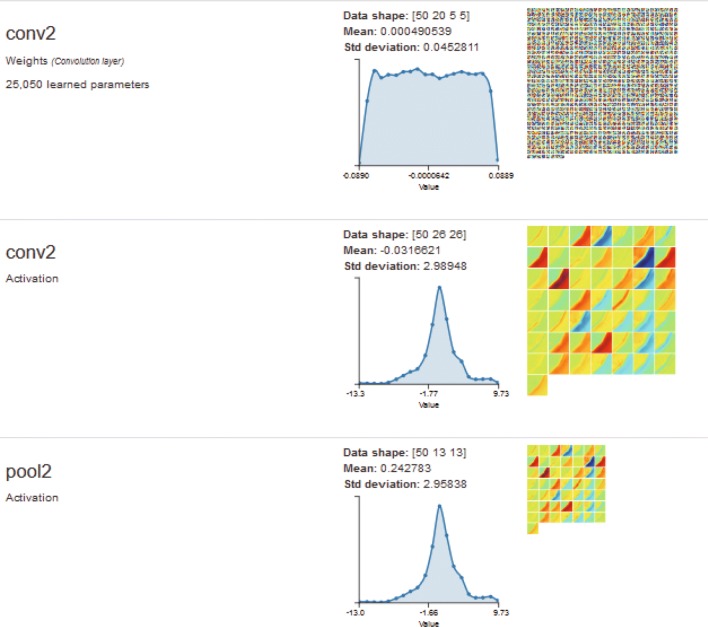
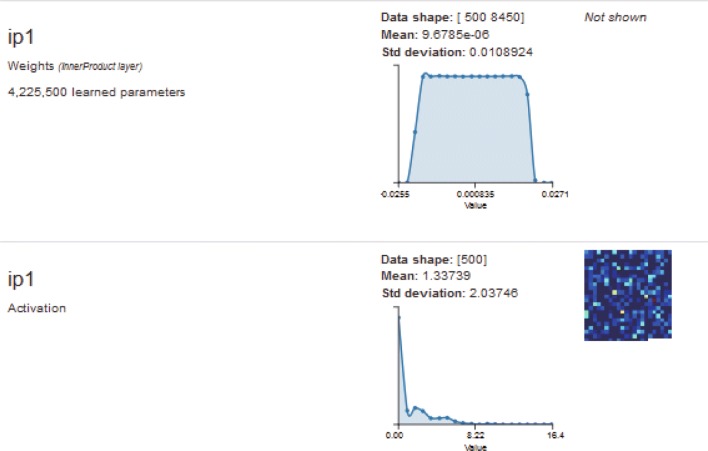
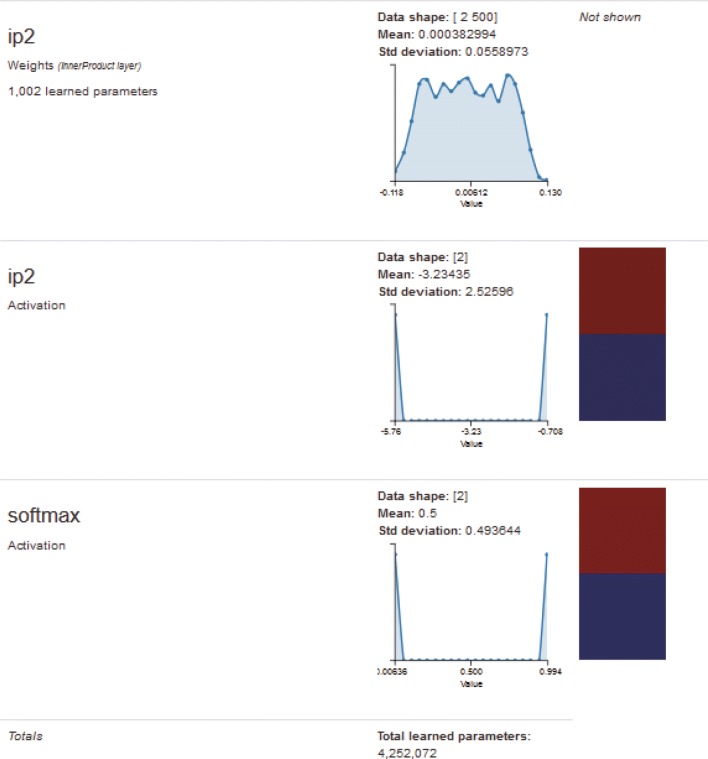
At the very beginning, we firstly divide the data in each dataset into three components: training (80%), validation (10%), and testing (10%). The number of epochs is set to 120, and the training batch size is 128. The classification results are shown below in Fig. 5, and Tables 3 and 4. The ROC curves are also shown below in Figs. 6 and 7, which indicates good results with a very high AUC value. We also show the visualization results in different layers when classifying one of the images in Figs. 8, 9, 10, 11, and 12. \
Fig. 5.
Malignant-nodule–non-nodule classification result curve and Serious-Malignant–Mild-Malignant classification result curve
Table 3.
Malignant-nodule and non-nodule classification result
| Predicted malignant | Predicted non | TOP-1 accu | ||
|---|---|---|---|---|
| Malignant | TP 479 | FN 13 | Sensitivity 97.36% | 96.95% |
| Non | FP 11 | TN 283 | Specificity 96.26% |
Table 4.
Serious-Malignant and Mild-Malignant classification result
| Predicted serious | Predicted mild | TOP-1 accu | ||
|---|---|---|---|---|
| Serious | TP 2064 | FN 51 | Sensitivity 97.59% | 96.49% |
| Mild | FP 92 | TN 1871 | Specificity 95.31% |
Fig. 6.
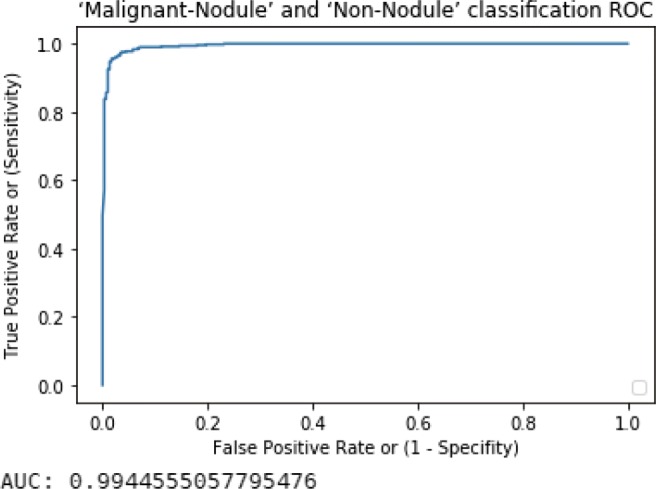
Malignant-nodule–non-nodule ROC curve with AUC value
Fig. 7.
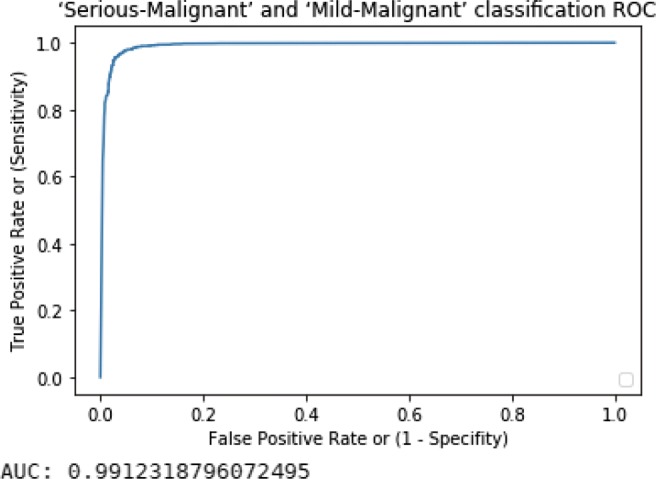
Serious-Malignant–Mild-Malignant ROC curve with AUC value
Fig. 8.
Visualization of one input image in input layer
Fig. 9.
Visualization of one input image in the first convolutional layer and pooling layer
Fig. 10.
Visualization of one input image in the second convolutional layer and pooling layer
Fig. 11.
Visualization of one input image in the first fully connected layer
Fig. 12.
Visualization of one input image in the second fully connected layer and softmax
In addition to training epochs and batch size, another important parameter is learning rate. Since we use stochastic gradient descent (SGD) to minimize the loss function, the learning rate determines whether loss function can find the best way to converge.
In the malignant-nodule–non-nodule classification step, learning rate begins with 0.001, in the Serious-Malignant–Mild-Malignant classification step, learning rate begins with 0.01, the gamma in both steps is set to 0.1, after every 20% epochs of the whole training period, and the “new learning rate” will be as follows:
The learning rate in each step will update automatically.
We implement 10-fold cross validation to test the CNN model we trained above; cross validation is a powerful method for researchers to testify the robustness of the training model based on the principle that the cross validation method can make the data fully trained and tested. In our work, we use Top-1 accuracy to evaluate the classification accuracy of a model.
The 10-folder CV results are shown below in Tables 5, and 6, and Figs. 13 and 14. In the first step classification in this paper, the average Top-1 accuracy is 97.041%, and in the second step classification, the same CNN architecture achieves an average accuracy of 96.685%. From the result, we can see that the classification accuracy of non-nodule and malignant-nodule is similar to the classification accuracy of Serious-Malignant and Mild-Malignant.
Table 5.
Malignant-nodule and non-nodule 10-folder CV result
| 1 (%) | 2 (%) | 3 (%) | 4 (%) | 5 (%) | Mean (%) |
|---|---|---|---|---|---|
| 97.34 | 96.83 | 97.08 | 97.72 | 97.72 | |
| 6 | 7 | 8 | 9 | 10 | 97.041 |
| 96.95 | 95.93 | 96.18 | 97.46 | 97.20 |
Table 6.
Serious-Malignant and Mild-Malignant 10-folder CV classification result
| 1 (%) | 2 (%) | 3 (%) | 4 (%) | 5 (%) | Mean (%) |
|---|---|---|---|---|---|
| 96.96 | 96.79 | 96.62 | 96.69 | 96.42 | |
| 6 | 7 | 8 | 9 | 10 | 96.685 |
| 96.71 | 96.49 | 96.69 | 96.79 | 96.69 |
Fig. 13.
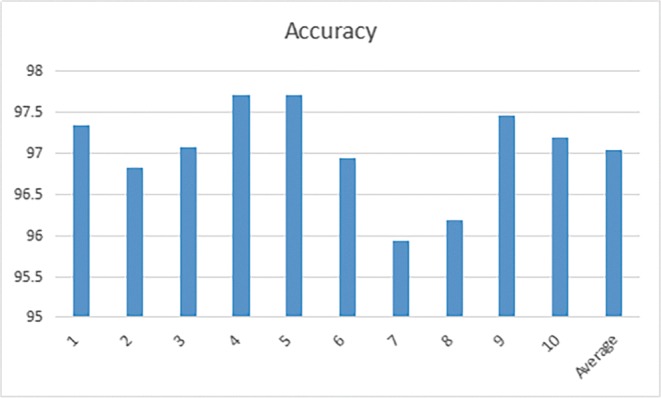
Malignant-nodule and non-nodule 10-folder CV result
Fig. 14.
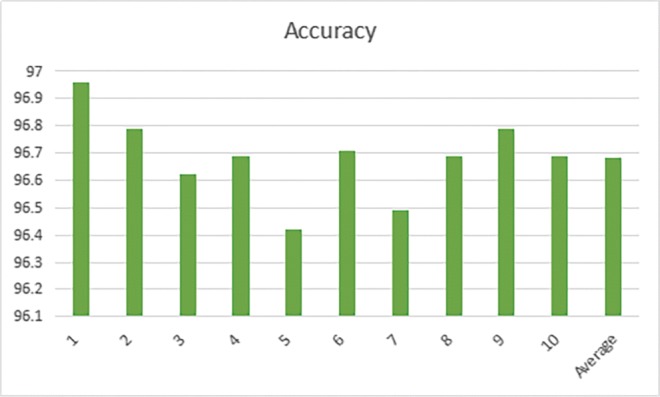
Serious-Malignant and Mild-Malignant 10-folder CV classification result
Conclusion and Discussion
In this paper, using LeNet-5, we have achieved an accuracy of 97.041% in our first step, malignant-nodule–non-nodule classification. And we also achieve an accuracy of 96.685% in our second step, the classification of Serious-Malignant and Mild-Malignant. The performance of AlexNet has also been tested on the same dataset and the results are included in the Appendix. Our achievement demonstrates our success in applying parameter-transfer approach to the classification of lung pulmonary nodules. This kind of deep learning solution enables researchers to try transfer learning, especially parameter-transfer when they are dealing with problems in which the training data are overlapped or partly overlapped. Most importantly, it provides researchers a new method in dealing with similar image processing problems when trying to realize CAD with deep learning. What’s more, our achievement may play an important role in practical diagnosis, since the improvement of lung nodule diagnosis accuracy based on thoracic CT images really matters due to the fact that lung cancer is the most common cancer as well as the first cause of cancer death in China and the USA [36, 37]. High accuracy of early diagnosis of lung cancer or nodules based on our work can be a significant way to improve the survival rate, due to previous researches showing that the early detection and localization of lung nodules could significantly improve the survival rate to 52% [38]. The traditional diagnostic method for lung cancer or lung nodules highly relies on a doctor’s clinical experience, which means subjectivity is inevitable; however, in some cases, subjective diagnosis may cause an extremely untrustworthy result. Our work indicates that we can implement the CAD of pulmonary nodules to assist doctors in their pulmonary nodule diagnosis, especially when they come across confusing medical cases, to achieve a higher diagnosis accuracy, and thus improving the survival rate of the lung cancer and potential lung cancer patients.
Appendix
We talked about transfer learning using CNN, trained on LIDC-IDRI database; although LeNet-5 was chosen as the CNN model in the main content, we also evaluated AlexNet, which is newer than the oldest LeNet architecture. The results including sensitivity, specificity, and TOP-1 accuracy as well as ROC and AUC are shown below in Tables 7 and 8, and Figs. 15 and 16.
Table 7.
Malignant-nodule and non-nodule classification result of AlexNet
| Predicted | Predicted | TOP-1 accu | ||
|---|---|---|---|---|
| malignant | non | |||
| Malignant | TP 474 | FN 18 | Sensitivity 96.34% | 92.37% |
| Non | FP 42 | TN 252 | Specificity 85.71% |
Table 8.
Serious-Malignant and Mild-Malignant classification result of AlexNet
| Predicted | Predicted | TOP-1 accu | ||
|---|---|---|---|---|
| serious | mild | |||
| Serious | TP 2000 | FN 115 | Sensitivity 94.56% | 93.43% |
| Mild | FP 153 | TN 1810 | Specificity 92.21% |
Fig. 15.
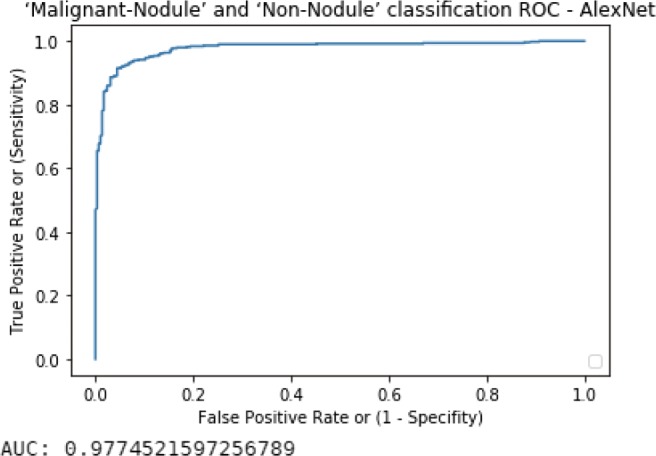
Malignant-nodule–non-nodule ROC curve with AUC value of AlexNet
Fig. 16.
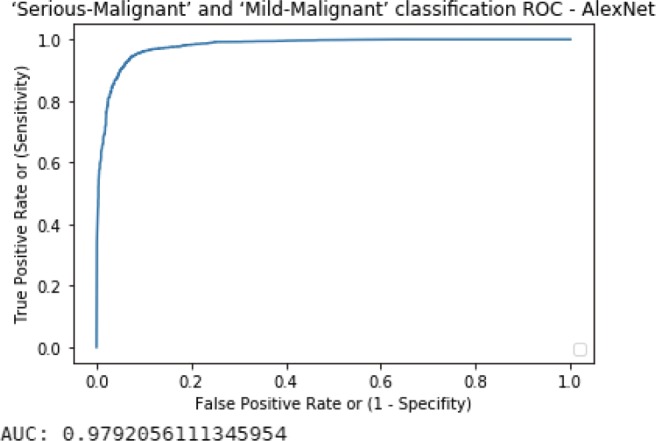
Serious-Malignant–Mild-Malignant ROC curve with AUC value of AlexNet
Funding Information
This work is supported by the Nature Science Foundation of Shandong Province under the grant ZR2014FM006, the National Nature Science Foundation of China under the grant 81671703, and the Focus on Research and Development Plan in Shandong Province under the grant 2015GSF118026.
Footnotes
Publisher’s Note
Springer Nature remains neutral with regard to jurisdictional claims in published maps and institutional affiliations.
References
- 1.Hubel DH, Wiesel TN. Receptive fields, binocular interaction and functional architecture in the cat’s visual cortex. J Physiol. 1962;160(1):106–154. doi: 10.1113/jphysiol.1962.sp006837. [DOI] [PMC free article] [PubMed] [Google Scholar]
- 2.Deng J, Dong W, Socher R, Li JL, Li K, Li FF: Imagenet: a large-scale hierarchical image database. In: IEEE Conference on computer vision and pattern recognition, 2009, pp 248–255
- 3.Russakovsky O, Deng J, Su H, Krause J, Satheesh S, Ma S, Huang Z, Karpathy A, Khosla A, Bernstein MS, Berg AC, Li F-F: Imagenet large scale visual recognition challenge. International Journal of Computer Vision . arXiv:http://arXiv.org/abs/1409.0575, 2014
- 4.Krizhevsky A, Sutskever I, Hinton GE: Imagenet classification with deep convolutional neural networks.. In: Advances in neural information processing systems, 2012, pp 1097–1105
- 5.Krizhevsky A, Hinton G: Learning multiple layers of features from tiny images, 2009
- 6.Tran PV A fully convolutional neural network for cardiac segmentation in short-axis mri, arXiv:http://arXiv.org/abs/1604.00494, 2016
- 7.Ng H-W, Nguyen VD, Vonikakis V, Winkler S: Deep learning for emotion recognition on small datasets using transfer learning. In: Proceedings of the 2015 ACM on International Conference on Multimodal Interaction. ACM, 2015, pp 443–449
- 8.Raina R, Battle A, Lee H, Packer B, Ng AY: Self-taught learning: transfer learning from unlabeled data. In: Proceedings of the 24th International Conference on Machine Learning. ACM, 2007, pp 759–766
- 9.Donahue J, Jia Y, Vinyals O, Hoffman J, Zhang N, Tzeng E, Darrell T Decaf: A deep convolutional activation feature for generic visual recognition. In: International Conference on Machine Learning, 2014, pp 647–655
- 10.LeCun Y, Bottou L, Bengio Y, Haffner P. Gradient-based learning applied to document recognition. Proc IEEE. 1998;86(11):2278–2324. doi: 10.1109/5.726791. [DOI] [Google Scholar]
- 11.Hu W, Huang Y, Li W, Zhang F, Li H: Deep convolutional neural networks for hyperspectral image classification. J Sensors, 2015 [DOI] [PMC free article] [PubMed]
- 12.Sarraf S, Tofighi G: Deep learning-based pipeline to recognize alzheimer’s disease using fmri data. In: Future Technologies Conference, 2017
- 13.Armato SGIII, McLennan G, Bidaut L, McNitt-Gray MF, Meyer CR, Reeves AP, ... Kazerooni EA. The lung image database consortium (LIDC) and image database resource initiative (IDRI): a completed reference database of lung nodules on CT scans. Med Phys. 2011;38(2):915–931. doi: 10.1118/1.3528204. [DOI] [PMC free article] [PubMed] [Google Scholar]
- 14.Jia Y, Shelhamer E, Donahue J, Karayev S, Long J, Girshick RB, Guadarrama S, Darrell T: Caffe: convolutional architecture for fast feature embedding. ACM Multimed, arXiv:http://arXiv.org/abs/1408.5093, 2014, 675–678
- 15.Shen W, Mu Z, Yang F, Yang C, Tian J: Multi-scale convolutional neural networks for lung nodule classification. In: International Conference on Information Processing in Medical Imaging. Springer, 2015, pp 588–599 [DOI] [PubMed]
- 16.Song Q, Zhao L, Luo X, Dou X: Using deep learning for classification of lung nodules on computed tomography images. Journal of Healthcare Engineering, 2017 [DOI] [PMC free article] [PubMed]
- 17.Krewer H, Geiger B, Hall LO, Goldgof DB, Gu Y, Tockman M, Gillies RJ: Effect of texture features in computer aided diagnosis of pulmonary nodules in low-dose computed tomography. In: 2013 IEEE International Conference on Systems, Man, and Cybernetics (SMC). IEEE, 2013, pp 3887–3891
- 18.Golan R, Jacob C, Denzinger J: Lung nodule detection in ct images using deep convolutional neural networks. In: 2016 International Joint Conference on Neural Networks (IJCNN). IEEE, 2016, pp 243–250
- 19.Bergtholdt M, Wiemker R, Klinder T: Pulmonary nodule detection using a cascaded svm classifier. In: Medical Imaging 2016: Computer-Aided Diagnosis. International Society for Optics and Photonics, 2016, vol 9785, pp 978513
- 20.Zhang C, Sun F, Zhang M, Liu W, Yu Q, Babyn P, Zhong H: Design and implementation of a medical image knowledge base for pulmonary nodules diagnosis. In: IEEE International Conference on Computer and Communications, 2018, pp 2071– 2075
- 21.Li Q, Cai W, Wang X, Zhou Y, Feng DD, Chen M: Medical image classification with convolutional neural network, 2014, pp 844–848
- 22.Shin HC, Roth HR, Gao M, Lu L, Xu Z, Nogues I, Yao J, Mollura D, Summers RM. Deep convolutional neural networks for computer-aided detection Cnn architectures, dataset characteristics and transfer learning. IEEE Trans Med Imaging. 2016;35(5):1285. doi: 10.1109/TMI.2016.2528162. [DOI] [PMC free article] [PubMed] [Google Scholar]
- 23.Kuncheva LI, Juan J. Rodriguez Classifier ensembles with a random linear oracle. 2007;19:500–508. [Google Scholar]
- 24.Baralis E, Chiusano S, Garza P. A lazy approach to associative classification. IEEE Trans Knowl Data Eng. 2008;20(2):156–171. doi: 10.1109/TKDE.2007.190677. [DOI] [Google Scholar]
- 25.Zhou X: Semi - supervised learning literature survey, 2005
- 26.Nigam K, McCallum AK, Thrun S, Mitchell T. Text classification from labeled and unlabeled documents using em. Mach Learn. 2000;39:103–134. doi: 10.1023/A:1007692713085. [DOI] [Google Scholar]
- 27.Blum A, Mitchell T: Combining labeled and unlabeled data with co-training, 1998, pp 92–100
- 28.Joachims T: Transductive inference for text classification using support vector machines. In: International Conference on Machine Learning, 1999, pp 200–209
- 29.Pan SJ, Yang Q. A survey on transfer learning. IEEE Trans Knowl Data Eng. 2010;22(10):1345–1359. doi: 10.1109/TKDE.2009.191. [DOI] [Google Scholar]
- 30.Lawrence ND, Platt JC: Learning to learn with the informative vector machine. In: International Conference on Machine Learning, 2004, pp 65–65
- 31.Bonilla EV, Chai KM, Williams C: Multi-task gaussian process prediction. Annual Conference on Neural Information Processing Systems, 2007
- 32.Schwaighofer A, Tresp V, Yu K: Learning gaussian process kernels via hierarchical Bayes. Annual Conference on Neural Information Processing Systems, 2004
- 33.Evgeniou T, Pontil M: Regularized multi–task learning, 2004, pp 109–117
- 34.Gao J, Fan W, Jiang J, Han J: Knowledge transfer via multiple model local structure mapping. ACM Knowl Discov Data Mining, 283–291, 2008
- 35.Glorot X, Bengio Y: Understanding the difficulty of training deep feedforward neural networks 9,249–256, 2010
- 36.Wanqing C, Rongshou Z, Baade PD, Siwei Z, Hongmei Z, Freddie B, Ahmedin J, Qin YX, Jie H: Cancer statistics in China, 2015, 2016
- 37.Siegel R, Ma J, Zou Z, Jemal A. Cancer statistics, 2014. CA: Cancer J Clin. 2014;64(1):9–29. doi: 10.3322/caac.21208. [DOI] [PubMed] [Google Scholar]
- 38.Henschke CI: Early lung cancer action project: overall design and findings from baseline screening 89, 2474–2482, 2000 [DOI] [PubMed]


