Abstract
Aortic dissections and ruptures are life-threatening injuries that must be immediately treated. Our national radiology practice receives dozens of these cases each month, but no automated process is currently available to check for critical pathologies before the images are opened by a radiologist. In this project, we developed a convolutional neural network model trained on aortic dissection and rupture data to assess the likelihood of these pathologies being present in prospective patients. This aortic injury model was used for study prioritization over the course of 4 weeks and model results were compared with clinicians’ reports to determine accuracy metrics. The model obtained a sensitivity and specificity of 87.8% and 96.0% for aortic dissection and 100% and 96.0% for aortic rupture. We observed a median reduction of 395 s in the time between study intake and radiologist review for studies that were prioritized by this model. False-positive and false-negative data were also collected for retraining to provide further improvements in subsequent versions of the model. The methodology described here can be applied to a number of modalities and pathologies moving forward.
Keywords: Aortic, Dissection, Rupture, Convolutional neural network, Machine learning
Introduction
An aortic dissection occurs when the inner layer of the aorta tears, causing blood to surge through the tear as the inner and middle layers of the aorta dissect. Although the incidence of aortic dissection is only approximately 30 cases per million people per year [1], this is an extremely serious medical condition, with approximately 33% mortality after 24 h if left untreated [2]. Aortic dissection subtypes can be described by either the DeBakey [3] or Stanford [4] classification systems and are classified based on the location of the dissection within either the ascending aorta, descending aorta, or aortic arch. An aortic dissection often propagates through the aorta as the high-velocity blood flow applies pressure to the boundaries of the dissection, which can cause dissections to extend throughout much of the aorta in some cases. As such, rapid detection of aortic dissection in the hospital setting is critical for patient management.
Aortic rupture is a rarer but even more serious condition than aortic dissection. Rupture of the aorta can occur either through the rupture of an aortic aneurysm or through sudden traumatic injury such as a vehicular crash. Over half of the patients with an aortic rupture do not survive long enough to enter the hospital and the overall mortality rate is 90% [5]. For the same reasons as dissection, immediate detection of aortic rupture or impending aortic rupture once the patient has entered the hospital can make the difference between survival and death.
Our teleradiology practice receives approximately 100 aortic dissection cases and 10 aortic rupture cases per month. Standard imaging for aortic dissection involves acquiring computed tomography (CT) images of the chest, ideally after injection of gadolinium contrast agent to obtain CT angiography (CTA) data (Fig. 1). This image data is passed to radiologists with maximum turnaround time of approximately 30 min for urgent cases and 24 h for non-urgent cases. This turnaround time includes the delay time between a study arriving and it being opened by the radiologist as well as the time taken to complete the read and can be influenced by a sometimes significant time in queue based on the clinical urgency of the case and availability of a radiologist that is not otherwise reading other studies. We hypothesized that by using machine learning architecture and training on retrospective aortic injury data, we could create a model to be used for classification and prioritization of aortic dissection and rupture for all post-contrast chest CT data passing through our system, decreasing the delay time for patients with these injuries.
Fig. 1.
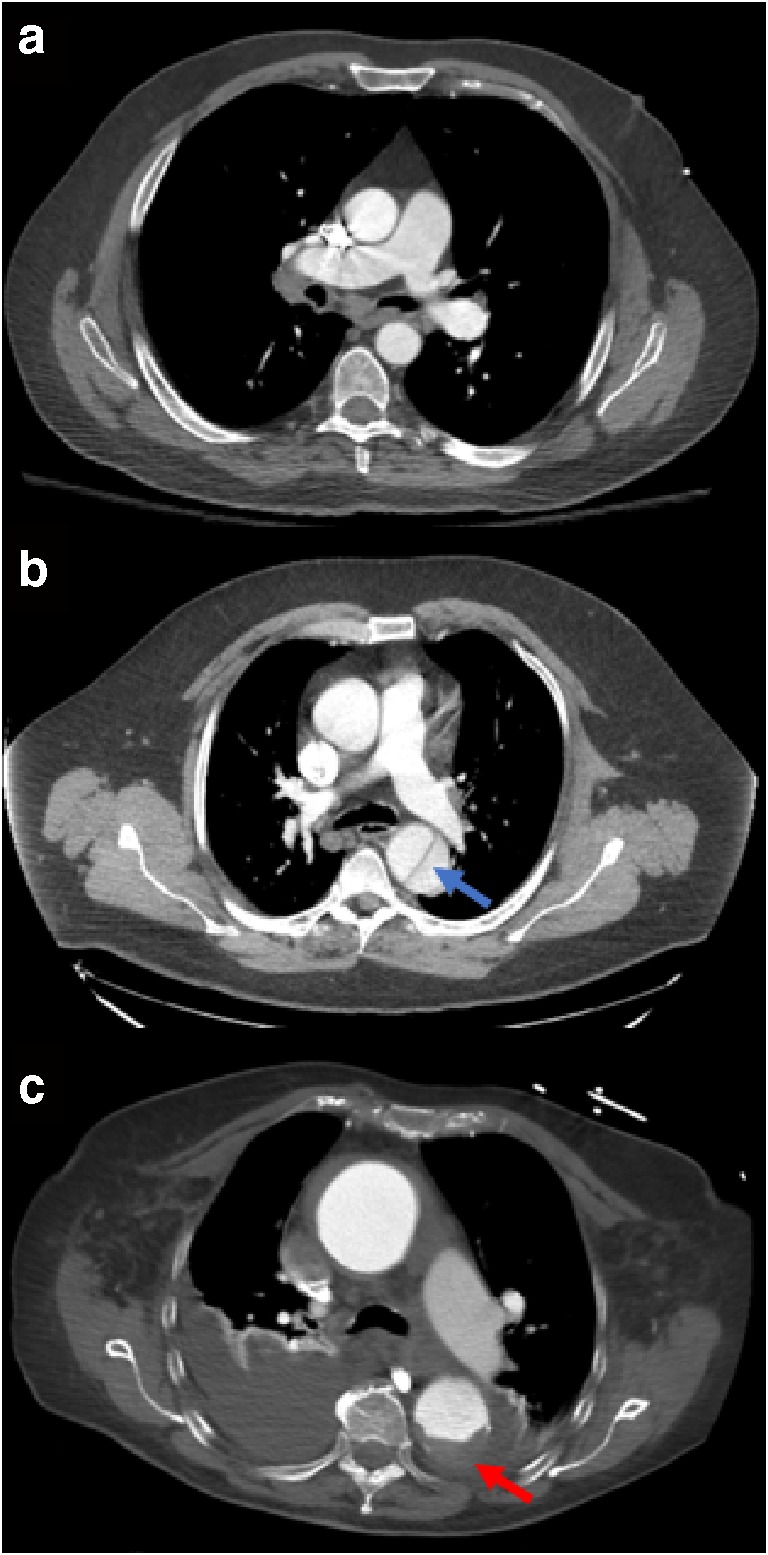
Axial post-contrast chest CT slices showing the aorta of 3 different patients. a A healthy aorta. b An aortic dissection (blue arrow). c A ruptured aorta (red arrow). Dark fluid is seen at the bottom of this image as blood from the rupture leaks into the surrounding tissues
Materials and Methods
Natural Language Processing
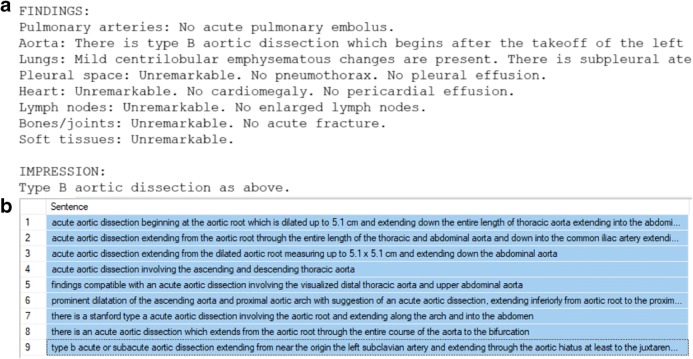
Our institution receives approximately 250,000 post-contrast chest CT studies per year. Of these, approximately 0.3% is positive for aortic dissection or rupture. To collect dissection- or rupture-positive data, we created natural language processing (NLP) models that could examine the radiologist’s clinical report associated with each study and classify the study by pathology. First, a list of keywords was selected to identify possibly relevant reports. For the aortic dissection NLP model, this keyword list was “perforation”, “flap”, “leak”, “dissection”, “intramural hemorrhage”, and “intramural hematoma”. For the aortic rupture NLP model, the only keyword used was “rupture”. All reports from between January 2015 and August 2018 were screened for these keywords and any report containing them was automatically extracted. Standard radiology report format contains “Findings” and “Impressions” sections (Fig. 2a); these sections were extracted from the reports and split into sentences. Sentences were then selected only if they had both “aort” and any keyword within the same sentence, with “aort” used to catch the terms aorta and aortic. Non-alphanumeric characters were removed and all selected sentences were placed in an SQL database for easy labeling of positive or negative for pathology. These sentences were labeled in bulk using keywords so that several sentences could be labeled at once (Fig. 2b).
Fig. 2.
a The findings and impressions sections of a clinical report for a patient with aortic dissection. b Sentences containing the phrase “acute aortic dissection” that were labeled as positive in bulk for the NLP training dataset
Once a set of sentences were labeled (735 positive and 4133 negative), they were split into 3–5 words n-grams and input into a stochastic gradient descent (SGD) classifier model (alpha = 0.0001, max_iter = 1500, tol = 0, penalty = “I1”). A validation split of 20% was used to create a validation dataset. The model was trained until validation loss did not improve for 10 iterations or 1500 iterations had passed, whichever came first. This was performed for both aortic dissection and rupture.
These NLP models, along with the same keyword list filters, were then applied to all incoming post-contrast CT chest data between September 2018 and April 2019.
Image Collection and Organization
The NLP models were used to identify studies in which the radiologist had identified an aortic dissection or rupture. All studies were de-identified by anonymizing DICOM tags known to contain protected health information (PHI) and by passing the image data through an optical character recognition (OCR) module to remove images that contained burnt-in text. A random subset of this data was chosen for training and validation. In total, 279 negative studies, 471 aortic dissection studies, and 28 aortic rupture studies were used for training. For each study, a single axial post-contrast chest CT series was automatically extracted from using information from the series name and DICOM header. If a CTA series was available, that series was chosen first; if no CTA series was available, any post-contrast CT series was chosen, excluding maximum intensity projection (MIP) images. If no CTA or post-contrast CT series was explicitly labeled by the series name or DICOM header, then any axial series from the study was chosen; as the studies used were all post-contrast studies, these remaining axial series were often post-contrast.
The chosen post-contrast CT series were then manually reviewed to ensure that the data were in fact post-contrast CT images; any pre-contrast images were removed from the dataset. Each DICOM file from every series was then windowed to a minimum of − 300 Hounsfield units (HU) and a maximum of 500 HU and converted into JPEG image format. This HU range was chosen empirically by varying the thresholds and observing which values led the model to perform at the highest validation accuracy. Among the positive cases, thumbnails of each JPEG were manually reviewed and any slice not showing the dissection or rupture itself was removed from the dataset. After this review, there were 51,895 negative images, 34,196 aortic dissection images, and 1388 aortic rupture images available. Of these, 3215 negative images from 19 patients, 3074 aortic dissection images from 22 patients, and 143 aortic rupture images from 2 patients were split into a validation dataset, with the remainder used for training. No patients that were used in the validation dataset had their images used in the training dataset.
Model Training
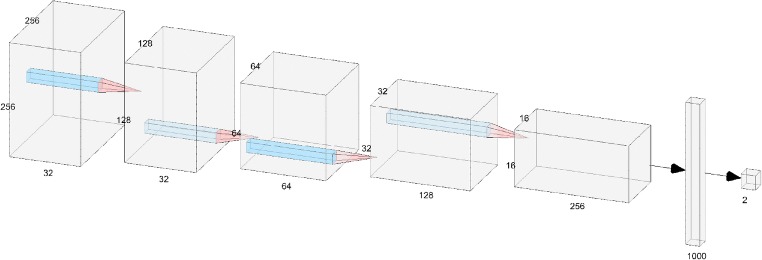
The model structure used was a convolutional neural network (CNN). Model training was performed using tensorflow and keras in a Python 3.6 environment with two Quadro P5000 GPUs available (Nvidia, Santa Clara, CA). The model consisted of 5 layers, each containing convolution (5 × 5 kernels), activation (reLU), max pooling (2 × 2), and dropout (0.4), followed by a dense layer and a softmax output function. The model architecture is shown in Fig. 3.
Fig. 3.
Architecture of the aortic injury convolutional neural net. Input images of size 256 × 256 undergo binary classification as positive or negative for aortic injury
The manually reviewed JPEG images were input into the CNN as training data in a randomized order. Prior to use in the first layer, images were resampled to a resolution of 512 × 512, although most CT images begin at this resolution and do not require adjustment. Images were then cropped to keep only the centermost 256 × 256 array of pixels, as the aorta falls within this window for all images that were reviewed. When training, an SGD optimizer was used with a learning rate of 0.003, decay of 10−6, momentum of 0.9, batch size of 50, and binary cross-entropy loss. Randomized image augmentation was used during training, with parameter ranges of 20° rotation, 15% zoom, 20% height shift, 20% width shift, 15% shear, and a horizontal flip. The model was set to loop through all training data once per epoch. After each epoch, the model was run on the validation dataset and validation accuracy was calculated. If validation accuracy improved over a previous maximum, the model weights were saved. The model was set to automatically stop training after no improvement occurred in 20 epochs. The maximum validation accuracy training value achieved during training was 96.9%, which occurred after epoch 56.
A test dataset consisting of 118 post-contrast CT series (50 negative, 50 positive for aortic dissection, and 18 positive for aortic rupture) was then used to determine the best threshold for classifying an entire study as positive or negative. To do so, we used the model to classify each slice within the series as either positive or negative and then multiplied the number of positive slices by the slice spacing to obtain a length of aortic injury in mm. Slice spacing was calculated by taking the difference in slice position between the 2nd and 3rd slices of the series. After running the trained model on these test series, we obtained an AUC of 0.979, sensitivity of 90.0%, and specificity of 94.0% for aortic dissections at a threshold of 40 mm. We also obtained an AUC of 0.990, sensitivity of 88.9%, and specificity of 94.0% for aortic ruptures at the same 40-mm threshold. Therefore, 40 mm was used as a threshold for aortic injury during prospective study prioritization.
Inference Engine
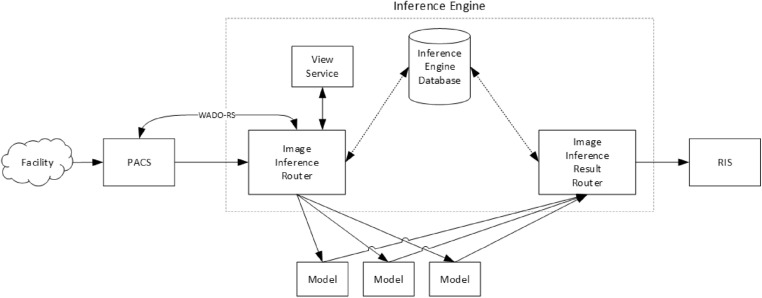
The inference engine (Fig. 4) in our teleradiology platform is responsible for ingesting studies and relaying the results to our radiology information system (RIS). The process begins when a study is transmitted from a facility to our picture archiving and communication system (PACS). Upon receiving a study, the PACS forwards the study meta-data to the inference engine, including the study modality, a few keywords describing the study (e.g., Chest, w/ contrast), and the patient’s age and sex. The inference engine uses this meta-data to determine which models are relevant for this study and adds the study to a queue, waiting for system resources to be available before running the appropriate model. When a study reaches the front of the queue, the inference engine requests a copy of the study from PACS via the Web Access to DICOM Objects Restful Service (WADO-RS) system and then forwards the study to each relevant model.
Fig. 4.
Diagram of the image inference engine. This system intakes a study and outputs classification results to our RIS system
After a model finishes running on a study, the model sends the results back to the inference engine. The inference engine analyzes the results and determines if the study’s pathology is positive or negative based on a threshold stored in the inference engine database. Finally, the result is sent from the inference engine to the RIS, which can then utilize these results to adjust radiologist worklists with prioritizations for studies that likely have the pathology.
Data Collection
The aortic injury model was plugged into our inference engine to classify all post-contrast chest CT series passing through our database. Model hosting was done on Microsoft Azure and run using a Tesla K80 GPU (Nvidia, Santa Clara, CA). This model was run for 4 weeks continuously and all classification results were saved in an SQL database for querying and comparisons with other meta-data. NLP was applied to the clinician’s report for each study and used as the ground truth for whether the patient truly had an aortic dissection or rupture. The clinician reports for all true positives, false negatives, and false positives and were manually reviewed to ensure the NLP result was correct; if the manual review indicated the NLP did not correctly classify a study, the result was manually corrected. It was not possible to manually review all true-negative reports because of the large volume (~ 33,000), so a subset of 1000 was manually reviewed; there were no misclassifications found within this group. A comparison of these manually reviewed NLP ground truth results to the inference results was used to calculate values of sensitivity and specificity for the full-throughput pipeline.
Delay Time Analysis
The time between when our system receives a study from the facility and when that study is opened by a radiologist for reading is called the “delay time”; this information is available within our database for each study. Delay times for all studies that passed through the aortic injury model were extracted from this database. In theory, delay times of studies that return a positive result from the aortic injury model should be smaller than delay times of studies with a negative result, if study prioritization is working properly. A Shapiro-Wilk test was run to determine the normality of the delay time distribution and a Mann-Whitney test was used to compare the medians of the two groups. Additionally, histograms comparing the two model result categories (positive vs. negative) were created for visual comparison.
There are three main classifications of urgency for studies that enter our system, in order of increasing urgency: non-emergent, emergent, and trauma. Emergent studies are ordered when a patient may have a potentially life-threatening condition, and trauma studies are ordered when an emergent condition involves multiple procedures or regions of the body. The non-emergent classification is typically ordered when there is no indication that the patient may have a critical injury. Emergent and trauma studies must be read with 30 min of study intake and non-emergent studies are typically read within 24 h. For the purposes of this delay time analysis, non-emergent studies were excluded because their delay times are much larger than those of the other categories and because no non-emergent studies were found to be positive for aortic injury.
Aortic Aneurysm Statistics
Aortic aneurysms occur when the wall of the aorta becomes weakened and bulges outward. While not immediately critical, this condition can eventually lead to aortic rupture if untreated. In order to determine whether dissection false positives might be triggered by aortic abnormalities such as an aneurysm, the aneurysm NLP result was extracted for both the dissection false-positive group and the dissection true-negative group. A two-proportion z-test was used to compare the proportion of aneurysm NLP-positive patients out of the total number of patients between the dissection false positive and true negative groups.
Results
Results for the NLP model validation set are shown in Table 1:
Table 1.
Results for the aortic dissection and aortic rupture NLP models. The validation dataset was taken as a random 20% sample of the available sentence data
| True positives | True negatives | False positives | False negatives | Total | Sensitivity | Specificity | |
|---|---|---|---|---|---|---|---|
| Aortic dissection | 85 | 6 | 4 | 401 | 496 | 94.4% | 99.0% |
| Aortic rupture | 7 | 0 | 0 | 28 | 35 | 100% | 100% |
During the 4-week period from 17 May 2019 to 13 June 2019, a total of 34,689 post-contrast chest CT studies were routed to the aortic dissection model. All studies had a usable axial CT series found. Studies passed through the model with a mean time of 23.5 s and standard deviation of 21.0 s, including the time to select the optimal series from a study and the time to return a classification of that series. Based on a comparison to manually reviewed NLP performed on the clinician’s report, we obtained the results shown in Table 2:
Table 2.
Results for the aortic injury classification model. False positives, true negatives, and specificity are identical for dissection and rupture because the same set of negative studies is used for both sets of statistics
| True positives | False negatives | False positives | True negatives | Sensitivity | Specificity | |
|---|---|---|---|---|---|---|
| Aortic dissection | 98 | 14 | 1383 | 33,194 | 87.8% | 96.0% |
| Aortic rupture | 7 | 0 | 1383 | 33,194 | 100% | 96.0% |
This suggests our system correctly caught 98 true aortic dissections and 7 true aortic ruptures and adjusted the priority of these studies. The incidence rate of aortic dissections was 112 out of 34,577 (0.33%), and the rate of aortic ruptures was 7 out of 34,577 (0.02%). The mean patient age of aortic dissection was 60.4 years for false-positive studies and 57.7 years for true-negative studies (t-test, P < 0.0001). The false-positive dataset also contained a higher proportion of males than the true-negative dataset (57.0% vs 49.2%; two-proportion z-test, P < 0.0001) (Fig. 5). Out of 1383 dissection false-positive patients, 88 were positive for aortic aneurysm (6.3%); for dissection true-negative patients, 591 out of 33,194 were positive for aortic aneurysm (1.8%). A two-proportion z-test suggested that dissection false-positive cases were significantly more likely to have an aortic aneurysm than dissection true negatives (P < 0.0001).
Fig. 5.
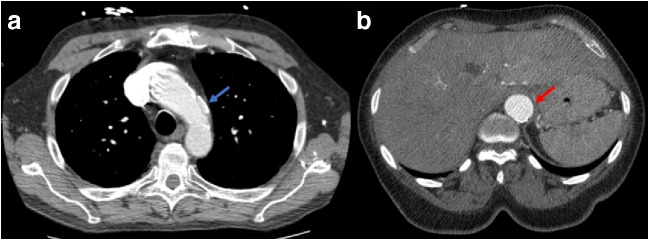
a A false-negative study classified by the aortic injury classification model. The dissection (blue arrow) is shorter than 40 mm and therefore was not picked up by our inference system. b A false-positive study classified by the aortic injury classification model. The aorta is aneurysmal (red arrow) which can sometimes trigger a positive finding
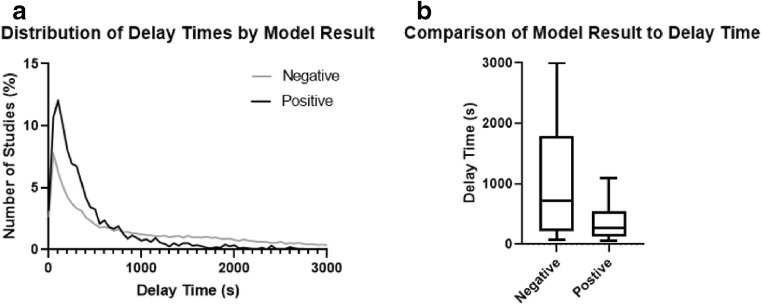
There were 1615 out of 31,662 (5.1%) emergent studies prioritized and 286 out of 3922 (7.3%) trauma studies prioritized, with trauma studies significantly more likely to be prioritized than emergent (two-proportion z-test, P < 0.0001). Histograms suggested a large concentration of delay times below 500 s for both model-positive (true positives + false positives) and model-negative (true negatives + false negatives) studies (Fig. 6a). However, this peak was larger for the model-positive studies, and the tail stretching above 1000 s was larger for the model-negative studies, suggesting that delay times above 1000 s are far less likely to occur for model-positive studies. The delay time distributions were not normally distributed for both model-positive and model-negative studies (Shapiro-Wilk test, P < 0.0001 for both). The model-positive group had significantly reduced delay time compared with the model-negative group (265 s vs. 660 s; Mann-Whitney test, P < 0.0001, Fig. 6b), a difference of 395 s (6.6 min).
Fig. 6.
a Histograms of delay times by model result. b Box-and-whisker plot of delay times by model result. The whisker ends represent the 10% and 90% distributions of delay times; lines within the box represent the median and both quartiles of delay time
Discussion
A high-volume inference system for identifying and prioritizing aortic dissection and rupture studies was implemented in our teleradiology workflow. High specificity in our results was prioritized in order to keep the number of escalated studies at a minimum, as opposed to maximizing the sensitivity. This allows us to reduce the impact of this model on worklist, leaving room for additional pathology models to be implemented in the future. After training and testing this model on retrospective data, the sensitivity and specificity for prospective data were in line with expectations from the test dataset.
One previous study has explored using convolutional neural networks for automated diagnosis of aortic dissections. Li et al. developed a 3D segmentation tool for segmentation of the aorta and lumens for type B aortic dissections [6]. However, our technique works in a simpler fashion and does not require segmentation to perform classification, allowing for a more lightweight model that can perform faster during high-throughput situations. To our knowledge, this study is the first to use machine learning to screen for aortic rupture in addition to dissection and the first to implement these aortic classification models in a clinical prioritization scenario.
We observed a statistically significant difference in the age of patients in our confusion matrix, with older patients being more likely to register a false positive. This is an interesting result and may be due to the typical aging process causing degenerative changes in the aorta that do not rise to the level of a dissection. We also observed a higher proportion of males in the false-positive data compared with the true-negative data. Similar to aging effects, this may suggest that males are more prone to general aortic degeneration that may resemble an aortic injury. Finally, we observed a higher rate of aortic aneurysm in the false-positive data compared with the true-negative data. This suggests that false positives can sometimes be triggered by other aortic conditions such as aneurysm that may be of interest to the radiologist despite not being a critical pathology. The most common type of false negative were studies in which a dissection was present but measured less than the 40-mm threshold. This was the case for a slight majority of our false negatives (8 out of 14). These types of false negatives could be reduced by lowering the dissection length threshold, ideally by retraining the model with more dissection-negative images as described below.
A few improvements remain to be explored regarding this study. First, it is possible that adding more data to our model can improve its accuracy and improve sensitivity and specificity even further. One benefit of our inference workflow is that since all false-positive and false-negative studies are recorded in our database, we can choose to retrieve only these inaccurately classified images and feed them back into the model for retraining. This allows the model to adjust for any image characteristics that it may be systematically misclassifying and correct for those in the next model version. In theory, this technique provides more efficient model retraining than simply adding new randomized data to the model, although due to changes in the structure and training parameters of this model throughout its development, it was not possible to quantitatively verify this effect during this project. An exploration of whether this theory is true would be an interesting undertaking in the future.
Our inference engine may have missed some abdominal aortic dissections in abdomen-pelvis studies that were intentionally not routed through the aortic injury model. In the future, it may be helpful to expand the qualifying study descriptions to include abdomen-pelvis studies to catch additional abdominal aortic dissections. However, this would come at a tradeoff of higher volume and a larger number of false positives. Some dissections were also missed due to a study being non-contrast, where the radiologist was able to diagnose a dissection regardless. We may be able to incorporate non-contrast data in further versions of this model to classify dissection in non-contrast studies, although this will likely be difficult given the utility of contrast in differentiating dissections.
It is possible that more advanced model structures may yield a higher accuracy than our current 5-layer model. Due to the infinite number of possible model structures, we explored only a relatively small model space within 6 sequential layers. Other more complicated standardized networks such as GoogleNet [7] and ResNet [8] could in theory produce better results, although we were not able to get results that improved upon our simple 5-layer model using these networks. Even if a more advanced network did show improvement, the high-throughput nature of this application renders a slight increase in accuracy less valuable than a steep reduction in prediction time, leaving us comfortable with our chosen model.
There were several limitations to this study. Although NLP results were used as a ground truth when calculating sensitivity and specificity, the NLP itself is imperfect. These NLP results were manually reviewed for the 4 weeks of data collected during this study, with the exception of true negatives. However, due to the high volume of studies coming through our system, it would be extremely difficult to manually review all reports for all models moving forward, so this source of error will have to be accepted in future model statistics.
Since the training and validation datasets contain many images from each image series, these samples are not fully independent from each other and this must be kept in mind when considering the large size of these datasets. However, the fact that no images from a series in the training dataset are included in the validation dataset ensures that the validation dataset will not be biased by this effect.
It was sometimes very difficult to determine where dissections near the aortic valve ended and where the valve itself began, as both can look similar on post-contrast CT images. Therefore, some training images from this specific region may have been mislabeled, although the best effort was made to label them correctly. The model also does not have access to 3D data when training, so it must take each slice independently without information from above or below. Other studies have used 3D CNNs which include slices above and below the slice of interest to classify pathology [9]; this type of network may provide an advantage over our more simple 2D CNN method.
Finally, the logic for choosing an optimal post-contrast CT series from a study may have performed imperfectly at times. In situations where both a contrast and a non-contrast series without series names were present in a study, it may have chosen the non-contrast series on occasion and likely resulted in a negative finding for aortic dissection. Similarly, if DICOM header data falsely stated that a study was non-contrast when it did in fact have contrast, that study may have registered as having no usable series and automatically defaulted to a negative pathology finding. These issues could potentially be improved upon by incorporating another CNN for detection of contrast used for choosing series; however, the computational and workflow cost of doing this was determined not to be necessary for the purposes of this experiment.
Conclusions
In conclusion, an aortic injury model capable of detecting both dissections and ruptures was implemented in a high-volume environment at our radiology practice and used for study prioritization. The model performed as expected compared with initial test data and correctly identified most dissections along with all available ruptures and reduced the time between study intake and radiologist read for these patients. This workflow can be expanded to other modalities and pathologies that are candidates for study prioritization.
Footnotes
Publisher’s Note
Springer Nature remains neutral with regard to jurisdictional claims in published maps and institutional affiliations.
References
- 1.Criado FJ: Aortic dissection: a 250-year perspective. Texas Hear. Inst. J., 2011 [PMC free article] [PubMed]
- 2.De León Ayala IA, Chen YF: Acute aortic dissection: An update. Kaohsiung Journal of Medical Sciences., 2012 [DOI] [PMC free article] [PubMed]
- 3.B. A. J. DeBakey ME, Henly MS, Cooley DA, Morris GC Jr, Crawford EW, “Surgical Management of Dissection Aneurysms of the Aorta,” J Thorac Cardiovasc Surg, vol. Jan, no. 49, pp. 130–149, 1965. [PubMed]
- 4.Sebastià C, Pallisa E, Quiroga S, Alvarez-Castells A, Dominguez R, Evangelista A: Aortic Dissection: Diagnosis and Follow-up with Helical CT. RadioGraphics 2013 [DOI] [PubMed]
- 5.Assar AN, Zarins CK. Ruptured abdominal aortic aneurysm: A surgical emergency with many clinical presentations. Postgraduate Medical Journal. 2009;85:268–273. doi: 10.1136/pgmj.2008.074666. [DOI] [PubMed] [Google Scholar]
- 6.Jianning Li WG, Cao L, Ge Y, Cheng W, Bowen M. Multi-Task Deep Convolutional Neural Network for the Segmentation of Type B Aortic Dissection. 2018. [Google Scholar]
- 7.A. Krizhevsky, I. Sutskever, and G. E. Hinton, “ImageNet Classification with Deep Convolutional Neural Networks,” 2012.
- 8.He K, Zhang X, Ren S, Sun J: Deep residual learning for image recognition. Proceedings of the IEEE Computer Society Conference on Computer Vision and Pattern Recognition, 2016
- 9.Chang PD, Kuoy E, Grinband J, Weinberg BD, Thompson M, Homo R, Chen J, Abcede H, Shafie M, Sugrue L, Filippi CG, Su MY, Yu W, Hess C, Chow D. Hybrid 3D/2D convolutional neural network for hemorrhage evaluation on head CT. Am. J. Neuroradiol. 2018;39:1609–1616. doi: 10.3174/ajnr.A5742. [DOI] [PMC free article] [PubMed] [Google Scholar]


