

Abstract
Purpose
Conventional classification of patients with lower urinary tract symptom (LUTS) into diagnostic categories based on a pre-defined symptom complex or predominant symptom appears inadequate, as patients frequently present with multiple urinary symptoms that could not be perfectly categorized into traditional diagnostic groups. We used a novel clustering method to identify male LUTS patient subtypes, based on detailed multi-symptom information.
Materials and Methods
Baseline data from 503 care-seeking men in the LURN Observational Cohort study was analyzed. Symptoms and their severity were assessed using the LUTS Tool and AUA Symptom Index (52 questions total). A resampling-based consensus clustering algorithm identified patient subtypes with distinct symptom signatures.
Results
Four distinct symptom clusters were identified. Patients in cluster M1 (n=166) had predominant symptoms of frequency, nocturia, hesitancy, straining, weak stream, intermittency and incomplete bladder emptying, suggestive of bladder outlet obstruction. Patients in cluster M2 (n=93) mainly endorsed post-micturition symptoms (e.g., post-void dribbling, post-void leakage), with some weak stream. Patients in cluster M3 (n=114) reported mostly urinary frequency without incontinence. Patients in cluster M4 (n=130) reported severe frequency, urgency and urgency incontinence. The majority of other urinary symptoms were statistically different between pairs of clusters. Patient reported outcomes of bowel symptoms, mental health, sleep dysfunction, erectile function, and urologic pain were significantly different across the clusters.
Conclusions
We identified four data-derived clusters among men seeking care for LUTS that were different from traditional diagnostic categories. Further subtype refinement will incorporate clinical data and non-urinary patient-reported outcomes.
Keywords: lower urinary tract symptoms, symptom-based subtypes, consensus clustering
Introduction
Lower urinary tract symptoms (LUTS) due to urine storage, voiding, and post-micturition difficulties are highly prevalent in men. In the population-based EPIC study, 51.3% of men reported storage symptoms, 25.7% voiding symptoms and 16.9% post-micturition symptoms.1 However, the conventional classification of patients with LUTS into diagnostic categories based on a pre-defined symptom complex, or based on the predominant symptom, may be inadequate, as often patients present with other urinary symptoms that are disregarded in the traditional diagnostic groups.
To improve our understanding of the subtypes of male LUTS patients, and to explore an alternative to traditional diagnostic categories, we used a novel method of unbiased clustering of men with LUTS using detailed multi-symptom information from patients. This method identifies groups, or clusters, of individuals based on specified factors so that members of each cluster are as similar as possible to others within their cluster, but as different as possible to those in other clusters.2 Subtypes identified in this manner are based on similarities and differences within the data, without influences from existing clinical definitions or diagnostic categories. Previous investigations on subtyping men with LUTS included the EPIC and BACH studies3,4, which performed cluster analysis on self-reported symptom data in community dwelling cohorts. The ICS-’BPH’ study,5,6,7 a large international study of care-seeking men, focused on the use of urodynamics in diagnosing benign prostatic obstruction (BPO) and development of diagnostic symptom scores, and thus used a different approach to improve diagnosis. A report from the same cohort used factor analysis to identify symptom scales including voiding and incontinence symptoms.7 However, little work has been done to group men with LUTS from a care-seeking population.
The Symptoms of Lower Urinary Tract Dysfunction Research Network (LURN) was established by the National Institute of Diabetes and Digestive and Kidney Diseases (NIDDK) to better understand and improve the management of LUTS in 2012.8 One major goal of LURN is to identify and explain the important subgroups of patients with LUTS. For this purpose, we used an unsupervised clustering method to identify subtypes of treatment-seeking men with LUTS based on responses to symptom questionnaires. This work also complements our previous investigations on symptom-based clustering of women in the LURN Observational Cohort Study.9,10
Materials and Methods
Data
Data were obtained from participants in the LURN Observational Cohort Study, which included 503 men seeking care for LUTS at six US tertiary care centers.10 LURN recruited men presenting to a LURN physician for the first time or return visit. Prior or current treatment of LUTS was not an exclusion criteria for LURN. Baseline data, including demographic information, clinical exam findings, and responses to multiple questionnaires, and prior and current treatment information were collected. The present study focused on responses to two self-administered questionnaires: the LUTS Tool (Lower Urinary Tract Symptom [LUTS] Tool, Version 1.0. Copyright 2007 by Pfizer, Inc. Used with permission)11,12 and the American Urological Association Symptom Index (AUA-SI).13 The LUTS Tool has questions regarding both severity and bother for 22 symptoms using a one-week recall period. The AUA-SI contains seven questions about the severity of seven symptoms and a single overall quality of life question, using a one-month recall period. Participants also completed questionnaires including: Patient-Reported Outcomes Measurement Information System (PROMIS) gastrointestinal constipation, diarrhea, and bowel incontinence subsets14, PROMIS Depression and Anxiety Short Forms15, Perceived Stress Scale16, PROMIS Sleep Disturbance Short Form17, Genitourinary Pain Index [GUPI]18, and International Index of Erectile Function [IIEF]19. The responses to these questionnaires were used to test differences in other symptoms potentially related to LUTS across clusters.
Methods
Consensus cluster analysis20 was performed using responses to the 44 LUTS tool questions (severity and bother), and 8 AUA-SI questions, to identify new subtypes of men with LUTS as described below. Missing data was minimal for the LUTS Tool (<2%) and the AUA-SI (6–8%). Multiple imputation was performed using IVEWare Version 2.021,22 for the small number of the missing participant responses.
Similar to our previous LURN investigation on symptom clustering in women9, we normalized the data by the participant’s overall symptom severity. For each participant, the responses to the 52 questions form a vector. The normalized responses are the original responses divided by the Euclidean length of this vector.
Responses to some questions were expected to be highly correlated (see correlation matrix in Supplementary Figure 1), both because some symptoms commonly occur together and because some questions are about the same or a similar symptom. To allow for the inclusion of all information, while mitigating redundancy, we included all 52 variables in the cluster analysis, but assigned weights to all responses based on correlations between responses to the questions.
We applied a resampling-based consensus clustering method to the normalized and weighted data. A consensus matrix was generated (Figure 1), in which each element can be interpreted as the probability that a pair of participants belong to the same cluster. We also applied established criteria23-27 to assess the “quality of the clustering” of our identified clusters. Differences across clusters in demographics, LUTS, and LUTS-related patient reported outcomes (PROs) were also tested using one-way ANOVA, chi-square tests, and multiple linear regression. A detailed description of the methods can be found in the Supplementary Materials.
Figure 1.
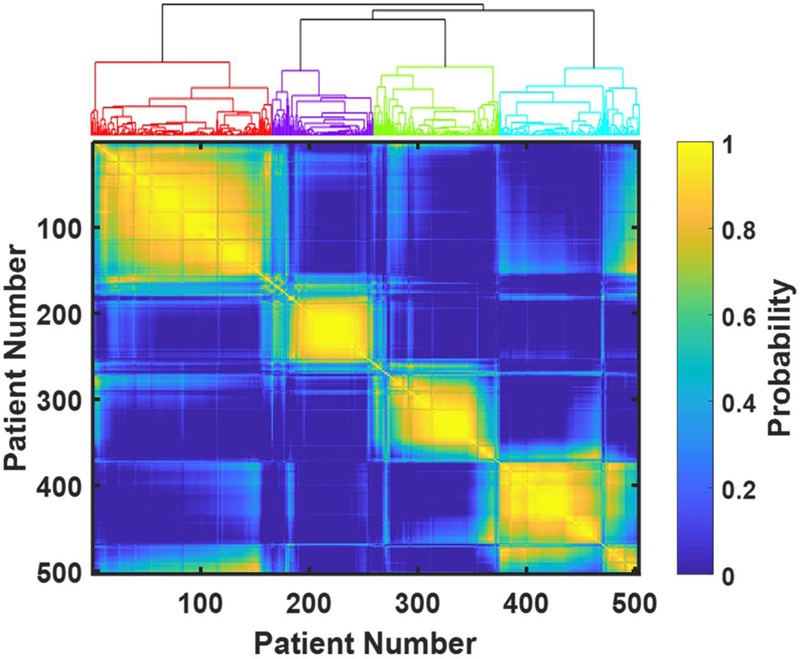
Consensus matrix as a color map and dendrogram for hierarchical clustering. Each time we randomly selected 80% of the patients and performed k-means clustering. We repeated this step for 1000 times and calculated the probability that a pair of patients were clustered into the same cluster (i.e., the number of times this pair of patients being in the same cluster divided by the number of times this pair of patients both being selected). Probability is color-coded: bright yellow represents probability close to one, dark blue – probability close to zero. The index of patients is reordered so that the patients belonging to the same clusters are grouped together. The four bright-yellow blocks along the diagonal of the matrix as well as the dendrogram at the top of the figure both indicate four clusters.
Results
Among 503 male participants in the LURN Observational Cohort Study, we identified four distinct clusters by performing resampling-based consensus clustering using responses from the LUTS Tool and AUA-SI questionnaires administered at the baseline clinic visit (Figure 1). Supplementary Table 2 also demonstrates that four was the optimal number of clusters based on the three criteria used to validate quality of clustering23–27. Figure 2 shows symptom signatures of the four clusters using radar plots, which indicate the average level of severity and bother for each symptom within each cluster. Urinary symptoms were significantly different across the clusters and none of the clusters could be characterized by a single symptom. Rather, each cluster was characterized by a combination of symptoms with varying levels of severity.
Figure 2.
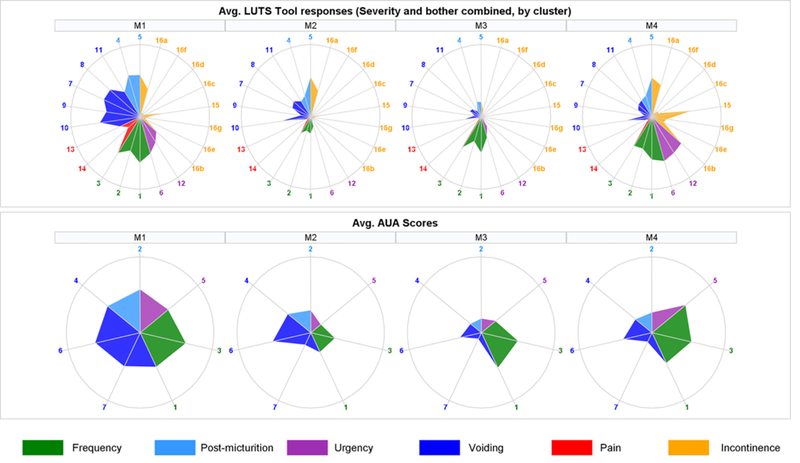
Upper row represents signatures based on the LUTS tool questions, where each “spoke” is an average of symptoms’ severity and bother within each cluster. Questions related to similar symptoms are grouped together and color-coded. LUTS tool questions are as follows: 1-frequency, 2-daytime frequency, 3-nocturia, 4-incomplete emptying, 5-trickle/dribble, 6-urgency, 7-hesitancy, 8-intermittency, 9-strain, 10-weak stream, 11-splitting/spraying, 12-urgency for fear of leaking urine, 13-pain, 14-burning, 15-leakage, 16a-leakage post voiding, 16b-leakage with urgency, 16c-leakage with laugh, 16d- leakage with exercise, 16e-leakage with sleeping, 16f-leakage with sex, 16g-leakage for no reason. Each radar plot in the lower row represents averaged response to the AUA-SI questions within the corresponding cluster. AUA questions are as follows: 1-nocturia, 2-incomplete emptying, 3-frequency, 4-intermittency, 5-urgency, 6-weak stream, 7-strain. Circles represent the highest possible severity level (8 for LUTS questions and 5 for AUA-SI questions).
Patients in cluster M1 (n=166) had predominant symptoms of hesitancy, straining, weak stream, intermittency and incomplete bladder emptying, as well as frequency and nocturia, suggestive of bladder outlet obstruction. Patients in cluster M2 (n=93) mainly endorsed post-micturition symptoms (e.g., post-void dribbling, post-void urinary incontinence), with some weak stream. Patients in cluster M3 (n=114) reported mostly urinary frequency and nocturia without incontinence. Patients in cluster M4 (n=130) reported severe frequency, urgency and urgency incontinence. Patients in clusters M1 and M4 reported much lower satisfaction with their overall urinary conditions than those in cluster M2 and M3, consistent with the more severe symptoms they endorsed, and the negative impact of bladder outlet obstruction and urinary incontinence (UI) symptoms.
Differences across clusters in demographic data are presented in Table 1. Age differed across the clusters with cluster M4 (urgency with incontinence) being significantly older on average than clusters M1, M2 and M3 (64.7 vs. 57.6–61.3, pairwise p-value range≤0.001–0.046, overall p<0.001) and cluster M2 (post-micturition) being significantly younger on average than cluster M3 (57.6 vs 61.3, p=0.046). Race also differed across clusters, with cluster M2 (post-micturition) being more predominantly White (90.3% vs. 72.3%−82.3% in clusters M1, M3, and M4, p=0.02), while cluster M1 (outlet obstruction) had a larger proportion of African American and Asian participants (13.9% vs. 3.2%−10.0% African American in clusters M2-M4, 7.8% vs. 0.8%−3.2% Asian in clusters M2-M4). No differences were detected in other demographic characteristics, including ethnicity, obesity, alcohol use, and smoking status.
Table 1.
Demographics and Characteristics of the Study Participants
| Cluster M1 (N=166) |
Cluster M2 (N=93) |
Cluster M3 (N=114) |
Cluster M4 (N=130) |
P-value | ||
|---|---|---|---|---|---|---|
| Age | Mean (SD) | 60.2 (12.8) | 57.6 (14.1) | 61.3 (13.4) | 64.7 (12.8) | 0.0009 |
| Race | 0.0152 | |||||
| White | 120 (72.3%) | 84 (90.3%) | 93 (81.6%) | 107 (82.3%) | ||
| African American | 23 (13.9%) | 3 (3.2%) | 9 (7.9%) | 13 (10.0%) | ||
| Asian | 13 (7.8%) | 3 (3.2%) | 3 (2.6%) | 1 (0.8%) | ||
| Other | 10 (6.6%) | 3 (3.2%) | 9 (7.9%) | 9 (6.9%) | ||
| Ethnicity | 0.7557 | |||||
| Non-Hispanic | 155 (93.4%) | 86 (92.5%) | 110 (96.5%) | 122 (93.8%) | ||
| Hispanic | 8 (4.8%) | 5 (5.4%) | 3 (2.6%) | 6 (4.6%) | ||
| Obesity | 0.4103 | |||||
| Not Obese | 100 (60.2%) | 61 (65.6%) | 69 (60.5%) | 71 (54.6%) | ||
| Obese | 65 (39.2%) | 31 (33.3%) | 45 (39.5%) | 58 (44.6%) | ||
| Alcohol Use | 0.2576 | |||||
| Never | 46 (27.7%) | 14 (15.1%) | 16 (14.0%) | 25 (19.2%) | ||
| 0–3 Drinks Per Week | 78 (47.0%) | 46 (49.5%) | 65 (57.0%) | 69 (53.1%) | ||
| 4–7 Drinks Per Week | 24 (14.5%) | 19 (20.4%) | 18 (15.8%) | 19 (14.6%) | ||
| More than 7 Drinks Per Week | 15 (9.0%) | 14 (15.1%) | 14 (12.3%) | 17 (13.1%) | ||
| Smoking Status | 0.3425 | |||||
| Never Smoked | 80 (48.2%) | 50 (53.8%) | 63 (55.3%) | 73 (56.2%) | ||
| Former Smoker | 63 (38.0%) | 35 (37.6%) | 45 (39.5%) | 49 (37.7%) | ||
| Current Smoker | 22 (13.3%) | 7 (7.5%) | 6 (5.3%) | 8 (6.2%) | ||
Differences in urinary symptoms across clusters were also assessed. The results of pairwise comparisons for the LUTS Tool severity questions are presented in Figure 3. The majority of symptoms are significantly different between pairs of clusters. Compared with patients in cluster M1, those in clusters M2 and M3 reported lower severity across all symptoms with the exception of post-micturition dribble in cluster M2. Patients in cluster M4 reported more severe urgency and incontinence and less severe post-micturition, voiding symptoms, and pain than those in cluster M1. Compared with patients in cluster M2, those in cluster M3 reported more severe frequency and urgency but less severe post-micturition, voiding symptoms and post-void urinary incontinence, while those in cluster M4 had more severe frequency, urgency and urgency incontinence, but less severe voiding symptoms. Patients in cluster M4 also reported much more severe post-micturition dribbling, urgency, and incontinence than those in cluster M3. Supplementary Table 2 shows that all but two symptom questions were statistically different between at least two clusters.
Figure 3. Mean symptom severity levels by cluster, pairwise symptom severity differences between clusters and statistical significance.
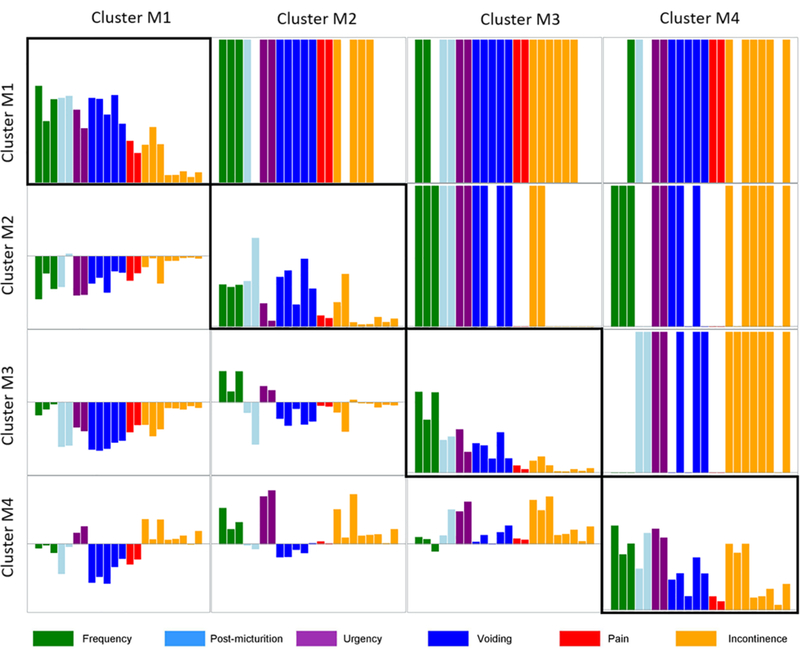
The bar charts along the diagonal present the average level of severity for each of the LUTS Tool questions for each cluster. Each bar chart in the lower triangle of the matrix shows the differences in the average severity levels of symptoms between corresponding clusters (i.e., the average severity levels of symptoms in column cluster subtracted from those of row cluster). Presence of each colored bar in the upper triangle indicates a statistically significant difference in the corresponding pairwise comparison. Absence of a colored bar indicates no significant difference could be detected in the corresponding pairwise comparison. For instance, the second rectangle in the first row demonstrates that 17 symptoms are significantly different in cluster M1 versus cluster M2: three related to frequency, one to post-micturition, two to urgency, five to voiding, two to pain, and four to incontinence.
Using multivariable linear regression we found differences in LUTS-related patient reported outcome (PRO) responses across clusters (Figure 4). Since the PROs had varying scales, all scores were converted to Z-scores with mean 0 and variance 1. Therefore, negative values of PROs indicate that the average value for the cluster was below the overall mean score for a given PRO. Measures of urologic pain, bowel symptoms, and mental health differed significantly across all pairs of clusters except between clusters M2 and M3, for which only the GUPI quality of life subscale and PROMIS depression scores are significantly different. The bar plots of average scores also demonstrate the similarity between clusters M2 and M3. Patients in clusters M1 and M4 reported more severe symptoms than those in clusters M2 and M3 with the exception of cluster M4 reporting higher levels of erectile dysfunction than the other clusters. Compared with patients in cluster M4, those in cluster M1 reported higher PRO scores including GUPI scores, PROMIS constipation, PROMIS Diarrhea, Perceived Stress Scale, PROMIS Sleep Dysfunction, PROMIS Depression, and PROMIS Anxiety scores.
Figure 4. Non-urologic patient reported outcomes (PROs). Matrix of pairwise comparisons of the clusters based on adjusted regression models.
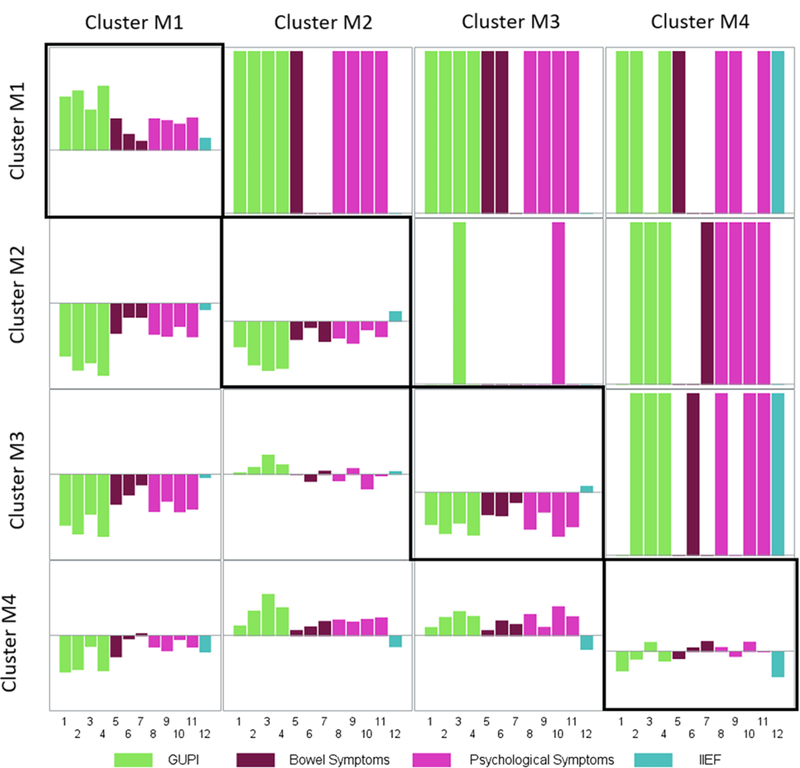
The bar plots along the diagonal illustrate the average score for each of the PROs. Similar to Figure 3, the bar charts in the lower triangle show the adjusted estimated differences in the average scores of the PROs between corresponding clusters. The colored bars in the upper triangle indicates that the corresponding pairs of clusters have significantly different scores on average after adjustment for relevant covariates. For instance, the second rectangle in the first row demonstrates that 9 scores of PROs are significantly different in cluster M1 versus cluster M2: four related to GUPI, one to bowel symptom, and four to psychological symptom. PROs are as follows: 1-GUPI Pain Subscale, 2-GUPI Urine Subscale, 3-GUPI QOL Subscale, 4-GUPI Total Score, 5-PROMIS Constipation, 6-PROMIS Diarrhea, 7-PROMIS Bowel Incontinence, 8-Perceived Stress Scale, 9-PROMIS Sleep Dysfunction, 10-PROMIS Depression, 11-PROMIS Anxiety, 12-IIEF.
Discussion
Cluster analysis provides a novel approach to identify subtypes of men with LUTS. Unlike conventional classification that is based on a pre-defined symptom complex or a predominant symptom, the unsupervised clustering described here does not rely on any preconceived notion that certain clinical symptoms should be grouped together. This unbiased, data-driven approach allows the symptom data to group patients into clusters mathematically. In this present study, we identified four distinct groups of men with LUTS. Clinically, M1 – the largest cluster among the four (33%) – resembled benign prostatic hyperplasia patients with obstruction. M4 (26%) was suggestive of patients with overactive bladder with urgency incontinence. A similar percentage of males (23%) had storage symptoms (frequency) without incontinence or voiding symptoms (M3). A significant percentage (18%) represented younger patients with predominant post-micturition symptoms (M2). The differences in urinary symptoms and LUTS-related PROs across the identified clusters are sufficiently significant to conclude that distinct groups of patients were identified.
Previous studies have attempted to characterize men with LUTS using cluster analysis. In the EPIC study, Coyne et al. found six clusters of men who reported at least one LUTS3. Most of the clusters were characterized by a single symptom, with only one cluster showing multiple symptoms. This group was generally similar to our cluster M1 labeled as bladder outlet obstruction. The clusters characterized by terminal dribbling without post-void UI and terminal dribbling with post-void-UI together would form a group similar to our cluster M2. Four of the six clusters identified in the EPIC study were determined by one predominant symptom with low levels of severity of other symptoms, while our clusters were defined by multiple urinary symptoms. This difference may be in part due to the differing populations studied in LURN and EPIC: patients seeking treatment in the LURN cohort are likely to have more complex symptom combinations than a community population (EPIC cohort). It also explains the absence of a minimal symptoms cluster in our study.
Cluster analysis of 2276 men was performed in the Boston Area Community Health (BACH) study4. 30.1% of the participants were asymptomatic and the rest were divided into five clusters. Three clusters differed by level of severity of frequency, perceived frequency, and nocturia. These three clusters are similar to our cluster M3. BACH cluster 4 was characterized by post-voiding dribbling and UI, similar to our cluster M2. The participants in their cluster 5 endorsed severe frequency, voiding, and urgency symptoms. This cluster was similar to our cluster M1, generally treated as bladder outlet obstruction.
In our study patients in clusters M1 and M4 presented with more severe symptoms than the other two clusters. Both EPIC and BACH studies found a highly symptomatic group similar to our cluster M1 but with some urgency and urinary incontinence as in our cluster M4. This indicates that our study brings new insights into the highly symptomatic patient group found previously. Men with generally severe symptoms constituted 58.8% of our cohort, which was larger than the symptomatic men in EPIC and in BACH studies (9.3% and 5.7% respectively). This is expected given that LURN recruited only treatment-seeking patients.
Compared with clusters of female LURN participants9, where patients in three out of four clusters presented severe UI, participants in male clusters reported less UI; especially stress UI. This can be partly explained by the exclusion of post-prostatectomy patients in our cohort. The symptoms of UI in male clusters were mainly post-void dribble in cluster M2 and urgency incontinence in cluster M4. Cluster M1 also presented some UI but it was not among the predominant symptoms. Cluster F2 from LURN female participants was similar to cluster M4 from LURN male participants with the presence of frequency, urgency, and urgency incontinence. Unlike the LURN female clustering where obesity was significantly different across clusters, age and race differed in male clustering.
The strength of the present subtyping methodology is that the traditional clinical definitions and diagnostic categories were ignored and only patient-reported urinary symptoms were used to derive the objective clusters. This data-driven method can potentially discover associations among symptoms that may be overlooked in clinical practice, and potentially contribute to further understanding of the pathology of male LUTS. A limitation of the current methodology is that clustering without clinical supervision can lead to clusters with predominant symptoms that are unrelated. We do not believe this to be the case given that these clusters have revealed groups of patients that clearly distinguish themselves from one another and are common occurrences in clinical practice. Validation, based on differential treatment efficacy across clusters is needed to determine if these are clinically meaningful subtypes. As LUTS are complex and heterogeneous, we hope that the cluster analysis for male participants in LURN will improve our understanding of the variations in disease pathophysiology. In the near future, we plan to use these putative clusters to compare biomarkers, sensory testing, and neuroimaging results collected by LURN to gain novel insights into the differences between these clusters, and deeper understanding of the underlying pathophysiology of male LUTS.
Conclusions
We identified four data-derived male LUTS clusters that differ from community-based studies among men seeking care for their LUTS. We believe that the identified clusters may be clinically meaningful given that they have revealed several groups of patients that clearly distinguished themselves from one another. Validation of these subtypes will determine if the clusters can guide clinical management. Further group refinement will incorporate clinical assessments, non-urologic factors, bladder diaries, brain imaging, biomarkers, and the longitudinal symptom data collected in the LURN study.
Supplementary Material
Acknowledgements
LURN consists of six research sites and a data coordinating center. This network is conducting a prospective observational study (ClinicalTrials.gov #NCT02485808); details regarding recruitment, inclusion, and exclusion criteria have been published elsewhere.10 The observational cohort study was approved by the Institutional Review Board at each site, and all participants provided informed consent prior to enrollment.
This is publication number 14 of the Symptoms of Lower Urinary Tract Dysfunction Research Network (LURN).
Dr. Siddiqui is supported by grant K23-DK110417 from the National Institute of Diabetes and Digestive and Kidney Diseases (NIDDK).
The following individuals were instrumental in the planning and conduct of this study at each of the participating institutions:
Duke University, Durham, North Carolina (DK097780): PI: Cindy Amundsen, MD, Kevin Weinfurt, PhD; Co-Is: Kathryn Flynn, PhD, Matthew O. Fraser, PhD, Todd Harshbarger, PhD, Eric Jelovsek, MD, Aaron Lentz, MD, Drew Peterson, MD, Nazema Siddiqui, MD, Alison Weidner, MD; Study Coordinators: Carrie Dombeck, MA, Robin Gilliam, MSW, Akira Hayes, Shantae McLean, MPH
University of Iowa, Iowa City, IA (DK097772): PI: Karl Kreder, MD, MBA, Catherine S Bradley, MD, MSCE, Co-Is: Bradley A. Erickson, MD, MS, Susan K. Lutgendorf, PhD, Vince Magnotta, PhD, Michael A. O’Donnell, MD, Vivian Sung, MD; Study Coordinator: Ahmad Alzubaidi
Northwestern University, Chicago, IL (DK097779): PIs: David Cella, Brian Helfand, MD, PhD; Co-Is: James W Griffith, PhD, Kimberly Kenton, MD, MS, Christina Lewicky-Gaupp, MD, Todd Parrish, PhD, Jennie Yufen Chen, PhD, Margaret Mueller, MD; Study Coordinators: Sarah Buono, Maria Corona, Beatriz Menendez, Alexis Siurek, Meera Tavathia, Veronica Venezuela, Azra Muftic, Pooja Talaty, Jasmine Nero. Dr. Helfand, Ms. Talaty, and Ms. Nero are at NorthShore University HealthSystem.
University of Michigan Health System, Ann Arbor, MI (DK099932): PI: J Quentin Clemens, MD, FACS, MSCI; Co-Is: Mitch Berger, MD, PhD, John DeLancey, MD, Dee Fenner, MD, Rick Harris, MD, Steve Harte, PhD, Anne P. Cameron, MD, John Wei, MD; Study Coordinators: Morgen Barroso, Linda Drnek, Greg Mowatt, Julie Tumbarello
University of Washington, Seattle Washington (DK100011): PI: Claire Yang, MD; Co-I: John L. Gore, MD, MS; Study Coordinators: Alice Liu, MPH, Brenda Vicars, RN
Washington University in St. Louis, St. Louis Missouri (DK100017): PI: Gerald L. Andriole, MD, H. Henry Lai; Co-I: Joshua Shimony, MD, PhD; Study Coordinators: Susan Mueller, RN, BSN, Heather Wilson, LPN, Deborah Ksiazek, BS, Aleksandra Klim, RN, MHS, CCRC
National Institute of Diabetes and Digestive and Kidney Diseases, Division of Kidney, Urology, and Hematology, Bethesda, MD: Project Scientist: Ziya Kirkali MD; Project Officer: John Kusek, PhD; NIH Personnel: Tamara Bavendam, MD, Robert Star, MD, Jenna Norton
Arbor Research Collaborative for Health, Data Coordinating Center (DK097776 and DK099879): PI: Robert Merion, MD, FACS; Co-Is: Victor Andreev, PhD, DSc, Brenda Gillespie, PhD, Gang Liu, PhD, Abigail Smith, PhD; Project Manager: Melissa Fava, MPA, PMP; Clinical Study Process Manager: Peg Hill-Callahan, BS, LSW; Clinical Monitor: Timothy Buck, BS, CCRP; Research Analysts: Margaret Helmuth, MA, Jon Wiseman, MS; Project Associate: Julieanne Lock, MLitt
Funding/Support
This study is supported by the National Institute of Diabetes & Digestive & Kidney Diseases through cooperative agreements (grants DK097780, DK097772, DK097779, DK099932, DK100011, DK100017, DK097776, DK099879).
Research reported in this publication was supported at Northwestern University, in part, by the National Institutes of Health’s National Center for Advancing Translational Sciences, Grant Number UL1TR001422. The content is solely the responsibility of the authors and does not necessarily represent the official views of the National Institutes of Health.
Abbreviation Key
- AUA-SI
American Urological Association Symptom Index
- BACH
Boston Area Community Health
- GUPI
Genitourinary Pain Index
- IIEF
International Index of Erectile Function
- ICS-‘BPH
’International Continence Society “Benign Prostatic Hyperplasia”
- LURN
Symptoms of Lower Urinary Tract Dysfunction Research Network
- LUTS
lower urinary tract symptom
- NIDDK
National Institute of Diabetes and Digestive and Kidney Diseases
- PROMIS
Patient-Reported Outcomes Measurement Information System
- PROS
patient reported outcomes
- UI
urinary incontinence
References
- 1.Irwin DE, Milsom I, Hunskaar S, et al. Population-based survey of urinary incontinence, overactive bladder, and other lower urinary tract symptoms in five countries: results of the EPIC study. Eur Urol. 50:1306, 2006. [DOI] [PubMed] [Google Scholar]
- 2.Liao TW. Clustering of time series data -a survey. Pattern Recognit. 38:1857–1874, 2005. [Google Scholar]
- 3.Coyne KS, Matza LS, Kopp ZS et al. Examining lower urinary tract symptom constellations using cluster analysis. BJU Int. 101:1267–73, 2008. [DOI] [PubMed] [Google Scholar]
- 4.Cinar A, Hall SA, Link CL, et al. Cluster analysis and lower urinary tract symptoms in men: findings from the Boston Area Community Health Survey. BJU Int. 101:1247–56, 2008. [DOI] [PubMed] [Google Scholar]
- 5.Abrams P, Donovan JL, de la Rosette JJ, et al. International Continence Society “Benign Prostatic Hyperplasia” Study: background, aims, and methodology. Neurourol Urodyn. 16:79–91, 1997. [PubMed] [Google Scholar]
- 6.Donovan JL, Abrams P, Peters TJ, et al. The ICS-’BPH’ Study: the psychometric validity and reliability of the ICSmale questionnaire. Br J Urol. 77:554–62, 1996. [DOI] [PubMed] [Google Scholar]
- 7.Donovan JL, Peters TJ, Abrams P, et al. Scoring the short form ICSmaleSF questionnaire. International Continence Society. J Urol. 164(6):1948–55, 2000. [PubMed] [Google Scholar]
- 8.Yang CC, Weinfurt KP, Merion RM, et al. Symptoms of Lower Urinary Tract Dysfunction Research Network. J Urol 196:146–52, 2016. [DOI] [PMC free article] [PubMed] [Google Scholar]
- 9.Andreev VP, Liu G, Yang CC, et al. Symptom Based Clustering of Women in the LURN Observational Cohort Study. J Urol. 200:1323–31, 2018. [DOI] [PMC free article] [PubMed] [Google Scholar]
- 10.Cameron AP, Lewicky-Gaupp C, Smith AR et al. Baseline Lower Urinary Tract Symptoms in Patients Enrolled in LURN: A Prospective, Observational Cohort Study. J Urol. 199:1023–1031, 2018. [DOI] [PMC free article] [PubMed] [Google Scholar]
- 11.Coyne KS, Sexton CC, Kopp Z, et al. Assessing patients’ descriptions of lower urinary tract symptoms (LUTS) and perspectives on treatment outcomes: results of qualitative research. Int J Clin Pract. 64:1260–78, 2010. [DOI] [PubMed] [Google Scholar]
- 12.Coyne KS, Barsdorf AI, Thompson C, et al. Moving towards a comprehensive assessment of lower urinary tract symptoms (LUTS). Neurourol. Urodyn. 31:448–454, 2012. [DOI] [PubMed] [Google Scholar]
- 13.Barry MJ, Fowler FJ Jr, O’Leary MP et al. The American Urological Association symptom index for benign prostatic hyperplasia. J Urol 148: 1549–1557, 1992. [DOI] [PubMed] [Google Scholar]
- 14.Spiegel BM, Hays RD, Bolus R, et al. Development of the NIH Patient-Reported Outcomes Measurement Information System (PROMIS) Gastrointestinal Symptom Scales. Am. J. Gastroenterol. 109:1804–14, 2014. [DOI] [PMC free article] [PubMed] [Google Scholar]
- 15.Pilkonis PA, Choi SW, Reise SP, et al. Item banks for measuring emotional distress from the Patient-Reported Outcomes Measurement Information System (PROMIS®): depression, anxiety, and anger. Assessment 18:263–83, 2011. [DOI] [PMC free article] [PubMed] [Google Scholar]
- 16.Cohen S, Kamarck T, Mermelstein R. A global measure of perceived stress. J. Health Soc. Behav. 24:385–96, 1983. [PubMed] [Google Scholar]
- 17.Yu L, Buysse DJ, Germain A, et al. : Development of short forms from the PROMISTM sleep disturbance and Sleep-Related Impairment item banks. Behav Sleep Med. 10: 6–24, 2011. [DOI] [PMC free article] [PubMed] [Google Scholar]
- 18.Clemens JQ, Calhoun EA, Litwin MS, et al. Validation of a Modified National Institutes of Health Chronic Prostatitis Symptom Index to Assess Genitourinary Pain in Both Men and Women. Urology 74:983–7, 2009. [DOI] [PMC free article] [PubMed] [Google Scholar]
- 19.Rosen R, Riley A, Wagner G, et al. The International Index of Erectile Function (IIEF): A multidimensional scale for assessment of erectile dysfunction. Urology 49: 822–830, 1997. [DOI] [PubMed] [Google Scholar]
- 20.Monti S, Tamayo P, Mesirov J, et al. Consensus clustering: A resampling-based method for class discovery and visualization of gene expression microarray data. Mach Learn. 52:91–118, 2003. [Google Scholar]
- 21.Raghunathan TE, Lepkowski JM, Van Hoewyk J, et al. A multivariate technique for multiply imputing missing values using a sequence of regression models. Survey Methodol 27:85–95, 2001. [Google Scholar]
- 22.Raghunathan TE, Solenberger PW, Berglund P, et al. IVEware: Imputation and variance estimation software. Ann Arbor: University of Michigan, Institute for Social Research, Survey Research Center. 2000. [Google Scholar]
- 23.Dunn JC. A Fuzzy Relative of the ISODATA Process and Its Use in Detecting Compact Well-Separated Clusters. J Cybernetics. 3:32–57, 1973. [Google Scholar]
- 24.Dunn JC. Well separated clusters and optimal fuzzy partitions. Journal of Cybernetics, 4:95–104, 1974. [Google Scholar]
- 25.Pal NR, Biswas J. Cluster validation using graph theoretic concepts. Pattern Recognit. 30:847–857, 1997. [Google Scholar]
- 26.Glass GV, Hopkins KD. “Statistical Methods in Education and Psychology (3rd ed.)”. Allyn & Bacon, 1995, ISBN 0–205-14212–5. [Google Scholar]
- 27.Milligan GW. A monte carlo study of thirty internal criterion measures for cluster analysis. Psychometrika. 46:187–99, 1981. [Google Scholar]
Associated Data
This section collects any data citations, data availability statements, or supplementary materials included in this article.