Abstract
Purpose:
Patient body motion during a cardiac Positron Emission Tomography (PET) scan can severely degrade image quality. We propose and evaluate a novel method to detect, estimate, and correct body motion in cardiac PET.
Methods:
Our method consists of three key components: motion detection, motion estimation, and motion-compensated image reconstruction. For motion detection, we first divide PET list-mode data into 1-second bins and compute the center of mass (COM) of the coincidences’ distribution in each bin. We then compute the covariance matrix within a 25-second sliding window over the COM signals inside the window. The sum of the eigenvalues of the covariance matrix is used to separate the list-mode data into “static” (i.e. body motion free) and “moving” (i.e. contaminated by body motion) frames. Each moving frame is further divided into a number of evenly-spaced sub-frames (referred to as “sub-moving” frames), in which motion is assumed to be negligible. For motion estimation, we first reconstruct the data in each static and sub-moving frame using a rapid back-projection technique. We then select the longest static frame as the reference frame and estimate elastic motion transformations to the reference frame from all other static and sub-moving frames using non-rigid registration. For motion-compensated image reconstruction, we reconstruct all the list-mode data into a single image volume in the reference frame by incorporating the estimated motion transformations in the PET system matrix. We evaluated the performance of our approach in both phantom and human studies.
Results:
Visually, the motion-corrected (MC) PET images obtained by the proposed method have better quality and fewer motion artifacts than the images reconstructed without motion correction (NMC). Quantitative analysis indicates that MC yields higher myocardium to blood pool concentration ratios. MC also yields sharper myocardium than NMC.
Conclusion:
The proposed body motion correction method improves image quality of cardiac PET.
Keywords: body motion, bulk motion, motion detection, motion estimation, motion correction, image reconstruction, cardiac PET
1. INTRODUCTION
Positron Emission Tomography (PET) is a powerful imaging technique commonly used in the fields of oncology, neurology, and cardiology. The spatial resolution of PET scanners has greatly improved in recent years owing to advances in hardware (e.g., PET detector) and software (e.g., reconstruction algorithm) technologies. However, the intrinsic resolution of PET is seldom realized in practice because of patient motion. Motion causes image artifacts that can degrade the diagnostic value of PET images1–4. When severe motion occurs, an ongoing scan may have to be aborted or sometimes rescheduled.
Two different types of motion can affect cardiac PET imaging: physiologic motion (i.e. pseudo-periodic motion due to cardiac and respiratory functions) and body motion (i.e. unpredictable changes in the patient’s body position). Cardiac and respiratory motion correction has recently attracted great attention in PET imaging5–10. Methods designed to correct physiologic motion may become inaccurate if data are corrupted by body motion. Therefore, a step toward correction for both types of patient motion is to tackle body motion. Although body motion can be minimized by patient cooperation, it remains a challenging problem in PET11, 12.
Most of body-motion correction methods reported in the past focused on the head region. One group of methods is to employ external markers, such as optical tracking13–15 or wireless or wired magnetic resonance (MR) micro-coils16,17, to track the head motion. Another group of methods is based on image-driven motion correction techniques18–21. The first step of these method is to reconstruct multiple short-frame data for a given scan –typically 10–60 seconds per frame (depending on the tracer used). Subsequently, rigid registrations are performed by aligning all frames to a selected reference frame. The corrected image is formed as the summation of all aligned images. It has been shown that such image-driven methods can effectively improve the cardiac PET image quality22,23.
On the other hand, list-mode event-driven methods were shown to have the capability to detect respiratory and/or cardiac motion signals24–30. A similar technique was applied to detect rigid head movement with time-of-flight (TOF) information31. Inspired by these works, we propose an approach that can detect, estimate, and compensate for body motion using list-mode data in cardiac PET. Visual assessment and quantitative analysis were performed to evaluate the performance of the proposed approach in cardiac PET.
2. MATERIALS AND METHODS
Because body motion in a PET scan is unpredictable, it must always be tracked during the scan. We propose to use list-mode data to detect body motion, which is then estimated and corrected accordingly. Our method consists of three key steps: motion detection, motion estimation, and motion-compensated image reconstruction. Motion detection employs a list-mode event-driven metric to detect body motion, allowing us to split the scan into a set of “static” (i.e. body motion free) and “moving” (i.e. body motion contaminated) frames. The underlying assumption is that body motion will cause shifts in the spatial distribution of measured events that can be captured by event coordinates. Motion estimation obtains elastic transformations that register every static and moving frame to a selected static reference frame. Finally, motion-compensated image reconstruction incorporates the estimated transformations into the PET system matrix. The list-mode data are jointly reconstructed with the updated system matrix to obtain a motion-free image volume in the reference frame. We assessed the performance of our method using both phantom and human studies.
2.A. Motion detection
Given a PET scan, we first divided the list-mode data into 1-second bins and computed a center-of-mass (COM) vector, mb, for each bin using:
| Eq. (1) |
where b is the bin index, Nb is the total number of line of responses (LOR) detected in the bin, (ax,l, ay,l, az,l) is the (x,y,z) coordinate of the center of the lth LOR in the bin.
Outlier events, which were identified using a Hampel filter32, were removed for further analysis. The filtering procedure worked as follows: for each 1-second bin, a median COM was computed over seven bins centered at the bin; then, the standard deviation of COM around the median value was calculated; if the COM of the bin differed from the median value by more than three standard deviations, that bin was discarded.
To define a single metric that can be used to detect body motion, we first computed a covariance matrix C using a sliding window (length=25 seconds, step size=1 second) using:
| Eq.(2) |
where , i, j = x, y, z, and L = 25. The diagonal elements of C provide the variance of position along x, y, and z axis. The off-diagonal elements of C provide covariance information between axes. We then computed the eigenvalues of C using principal component analysis (PCA). The resulting eigenvalues, (δ1, δ2, δ3), were then used to compute the following metric, denoted motion index:
| Eq. (3) |
which represents the degree of movement in the sliding window. The central 1-second list-mode data of each 25-second sliding window were labelled as “static” if β ≤ ρ or “moving” if β > ρ, where ρ is a global adaptive threshold. We set ρ to the motion index value, where the number of 1-second bins equals to 5% of the (static) peak value in the histogram of signal β. After labelling all 1-second bins, they were combined into continuous static (SF) and moving frames (MF). Frames shorter than 25-second were not used for subsequent processing. Each MF was further evenly divided into multiple 25-second sub-moving-frames (sub-MF) (the last sub-MF can be longer than 25 seconds because of the residual data), during which body motion was assumed to be negligible.
2.B. Motion estimation
The list-mode data in each SF and sub-MF were binned into sinograms. For efficient computation, each sinogram was directly back-projected to the image space. The back-projected image was divided by the sensitivity image, followed by applying a Butterworth bandpass filter to enhance the contrast. The resulting images were used to estimate non-rigid motion transformations between a selected reference SF (the longest SF), denoted SFref, and all other SFs and sub-MFs using parametric B-spline registration method. In this study, we used elastic rather than rigid registration to estimate motion. The elastic registration was, however, initialized using a rigid registration to obtain a more accurate motion estimation. The registration method, implemented in the elastix toolbox33, minimizes mutual information between a fixed image and a target image. The convergence of the registration is accelerated using a multi-resolution technique34.
2.C. Motion-compensated Image Reconstruction
We jointly reconstructed all the list-mode data of the motion-contaminated scan into a single image volume, λref, depicting the radioactivity distribution in SFref. This was performed by incorporating the estimated motion transformations into the PET system matrix during an iterative reconstruction process. The forward model for a given SF or sub-MF, k, is
| Eq. (4) |
where ΔDk is a scalar equal to the relative duration of frame k to the whole scan, , , and are the sinograms containing the expected number of prompt, scattered, and random coincidence events, respectively, S is a diagonal matrix containing the LOR sensitivity coefficients, Mref→k is the motion transformation from SFref, to frame k, G is the geometric forward-projection operator, and Ak is a diagonal matrix containing the motion-dependent attenuation coefficients in each sinogram bin derived by deforming the attenuation map in SFref, followed by projection into the sinogram space. Random contribution for each frame was estimated by Gaussian smoothing of a delayed coincidence window. Scatter contribution for each frame was estimated with the single scatter simulation (SSS) method35. Both random and scatter contributions were computed using Siemens e7 tools. Based on this forward model, we used the ordered subset expectation maximization (OSEM)36 to estimate λref. The update equation is:
| Eq. (5) |
where yk is the measured sinogram in frame k, 1I is the sinogram filled with the value of ones, K is the number of frames. Two iterations and 21 angular subsets were used in all reconstructions.
2.D. Phantom and human studies
Both phantom and human studies were performed on a Siemens PET/MR (Biograph mMR, Siemens Healthcare, Knoxville, TN). We performed phantom studies using an anthropomorphic torso phantom (Data Spectrum Corporation, Hillsborough, NC), which consists of multiple compartments. The myocardial defect, myocardium, ventricle cavity, left/right lungs, liver, and soft-tissue background compartments were filled with 0.85, 0.04, 0.67/0.76, 4.39, and 6.6 mCi 18F, respectively. The resulting concentration ratios between all compartments and background were close to previously reported values in cardiac [18F]-Fludeoxyglucose (FDG) PET37. The torso phantom has no “inherent” motion, e.g., deformation of the lung or cardiac compartments. PET list-mode data were acquired during two separate scans. In the first scan, data were acquired for ~4 minutes, during which a sudden movement (~12 mm translation) along the z-axis was induced manually to the phantom ~2 minutes after the start of the acquisition. In the second scan, data were acquired for ~3 minutes, during which a slow movement (up-to 20° rotation lasting for ~50 seconds along an arbitrary axis) was induced right after the start of the acquisition. For each scan, two separate MR scans (2-point gradient echo Dixon) were acquired before and after the movement. Afterwards, motion-free PET data were acquired for ~3 minutes (also another MR scan), which were used as the reference.
Three human cardiac PET-MR scans performed in our institution were retrospectively identified with noticeable motion artifacts. All human studies using 18F-FDG and 18F-TPP were approved by the Massachusetts General Hospital Institutional Review Board (IRB). The first subject was administrated with a bolus injection of ~11 mCi 18F-FDG and scanned for 65 minutes afterwards. The other two subjects were administrated with 4-[18F]-tetraphenylphosphonium (TPP) with a bolus injection of ~8 mCi plus continuous infusion of ~2 mCi and scanned for 90 minutes. For each of the three studies, the attenuation map was measured at the beginning of each PET scan using the vendor’s supplied Magnetic Resonance based Attenuation Correction (MRAC) protocol. The last 20-minute list-mode data of the FDG scan and 10-minute list-mode data of the TPP scans were used for analysis.
For each study, the selected list-mode data were used to perform motion detection and estimation as described in Secs. 2.A–B. The list-mode data were then reconstructed with and without motion correction. The static frame with the longest duration was selected as the reference frame. The list-mode data in the selected reference frame were reconstructed to serve as a motion-free reference image. A dimension of 344×344×127 and voxel size of 2.0×2.0×2.0 mm3 were used for image reconstruction. No post-reconstruction smoothing was applied.
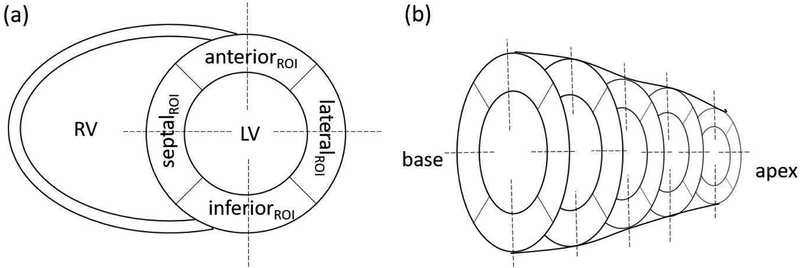
For both phantom and human studies, the quality of motion-corrected (MC), non motion-corrected (NMC), and reference (REF) images was evaluated by comparing myocardium target-to-background-ratio (TBR) and myocardial wall thickness values. First, all the images were re-oriented into short-axis view and five evenly spaced planes from apex to the base were chosen. For each plane, four circular target regions of interest (ROI) (four mm in radius) were drawn in septal, lateral, anterior and inferior walls, separately (See Fig. 1). A background ROI (four mm in radius) was drawn in the middle of the left ventricle (LV) blood pool. For each target ROI, TBR was computed as the ratio between activity concentration in the target and background ROIs. The myocardial wall thickness was quantified by plotting line profiles across different regions in the five short-axis planes, as illustrated in Fig. 1. In the five short-axis planes, a total number of 20 profiles were plotted. For each profile, the wall thickness was quantified as the full-width half maximum (FWHM) of 1-D Gaussian distribution fitted to the profile. Paired t-tests were performed to evaluate differences between NMC and MC for both TBR and measured wall thickness values. A value of p<0.05 was considered statistically significant.
Figure 1:
(a) Illustration of the positioning of ROIs and line profiles for the calculation of myocardium TBR and wall thickness. Circular ROIs (4 mm in radius) were placed approximately at the center of the anterior, inferior, septal, and lateral regions. Another same-size ROI was drawn in the middle of the LV blood pool, (b) Five short-axis planes (from base to apex), in which a total number of 20 ROIs/profiles were made.
3. RESULTS
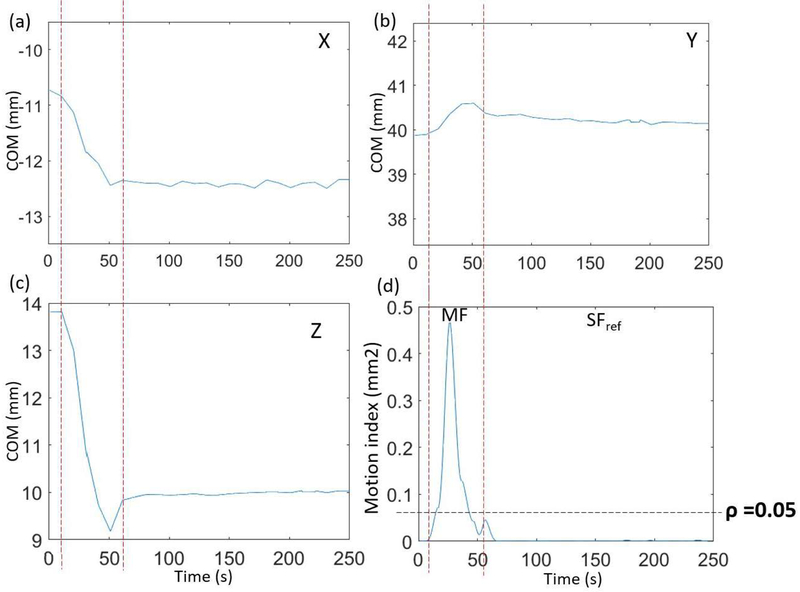
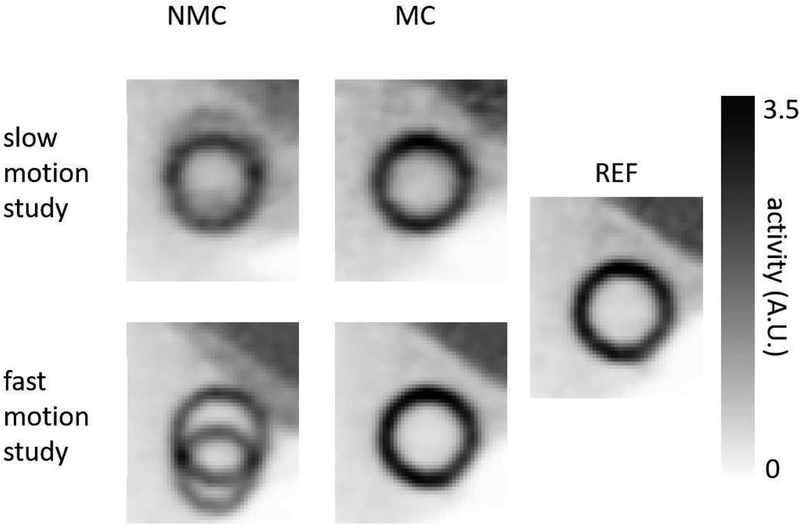
Figs. 2a–c show COM derived from the list-mode data as a function of time along x, y, and z directions for the phantom study with slow motion. Fig. 2d shows the motion index, β, which was derived using Eq. (3), versus time. The motion-contaminated frame can be clearly separated from the SF by thresholding the motion index at ρ = 0.05, which was derived as described in Sec. 2A. Fig. 3 shows images obtained with and without motion correction for both fast- and slow-motion phantom studies. The REF image from the motion-free scan was also shown.
Figure 2:
(a–c) COM in x, y, and z directions, respectively, versus time for the phantom study with manually induced slow motion. Left and right-most vertical dashed lines indicate when motion started and ended, respectively, (d) The motion index of the COMs in a 25-second sliding window versus time. The parameter ρ is the threshold that separates MF from SF frames.
Figure 3:
Short axis-views of NMC, MC, and REF images for the phantom studies.
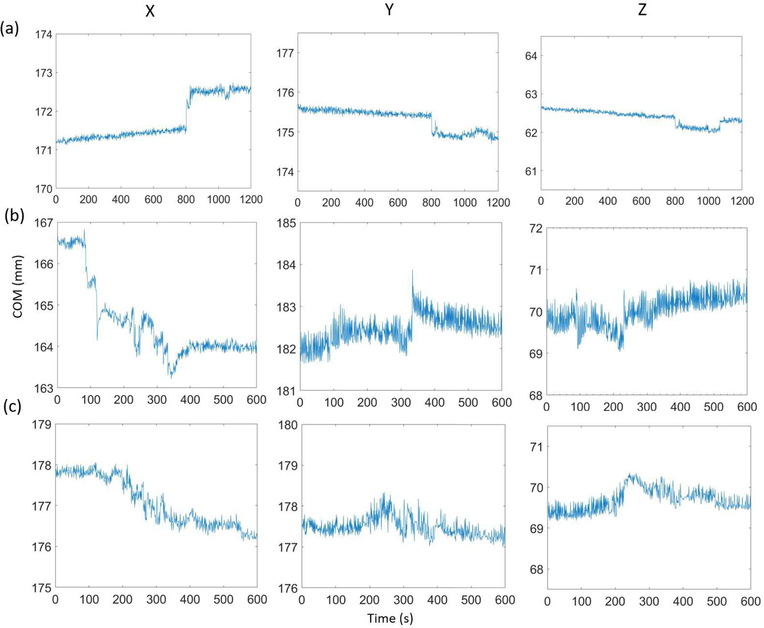
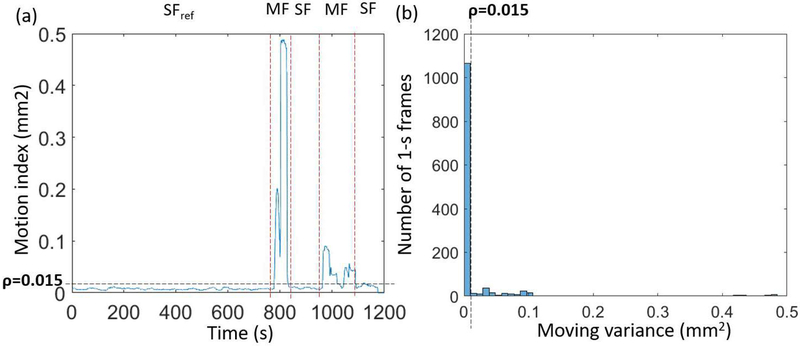
Figs. 4a–c show COM as a function of time along x, y, and z directions for three human studies (a: FDG, b–c: TPP). Subjects 1 and 2 had both non-negligible fast and slow body motion. Subject 3 had only non-negligible slow body motion. Fig. 5a shows the motion index, β, derived using Eq. (3) as a function of time for subject 1. Fig. 5b shows the corresponding histogram of motion index. Again, this histogram allows us to define a threshold to separate MFs from SFs. With a derived threshold, ρ = 0.015, the motion index clearly identifies three SFs and two MFs.
Figure 4:
COM (after removing outliers) in x, y, and z directions versus time for human subjects 1 (a), 2 (b), and 3 (c).
Figure 5:
(a) Motion index versus time for the subject 1. (b) Histogram of motion index for the same subject. The adaptive threshold ρ = 0.015 separates SF from MF.
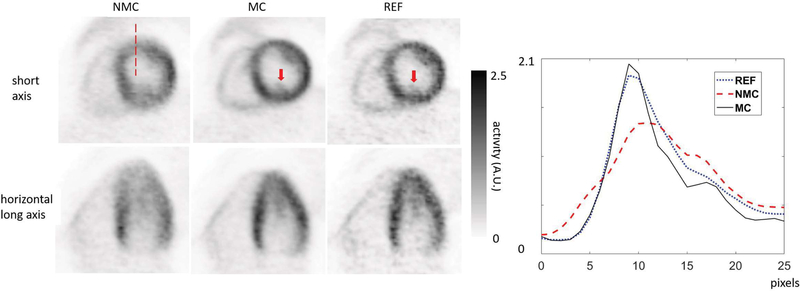
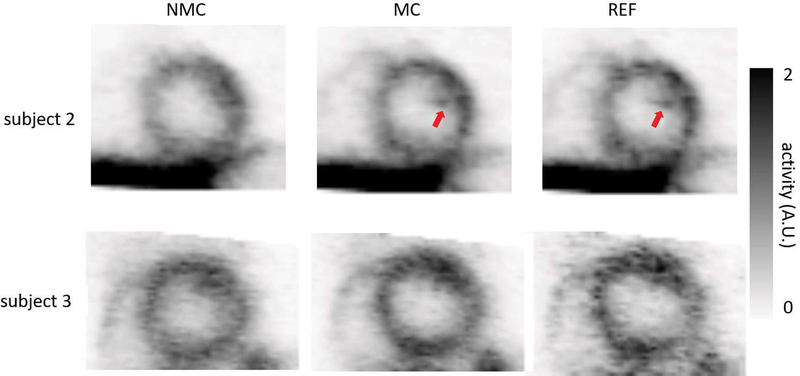
Fig. 6 shows short- and horizontal long-axis views of MC, NMC, and REF myocardium images for subject 1. Fig. 7 shows short-axis views of MC, NMC, and REF myocardium images for subjects 2 and 3. MC images exhibited sharper myocardium, reduced spillover of activity from the myocardium to the blood pool, and more visible structures than NMC, as evidenced by the improved delineation of papillary muscles (see arrows in Figs. 6 and 7). Visually, myocardial walls of MC were also thinner than the ones of NMC. For each subject, both MC and REF images had similar spatial resolutions, although the REF image appeared noisier because it was obtained by reconstructing only the events in the reference frame.
Figure 6:
NMC, MC and REF images for subject 1 (FDG) in short-axis and horizontal long-axis views. The REF images were obtained by reconstructing the data in the selected reference frame. Arrows indicate the papillary muscle, which is visible in both MC and REF, but not in NMC images. The profiles on the right were made along the dashed line shown on the short-axis image on the left.
Figure 7:
NMC, MC and REF images for subjects 2 and 3 (TPP) in short-axis view. Arrows indicate the delineation of the structures.
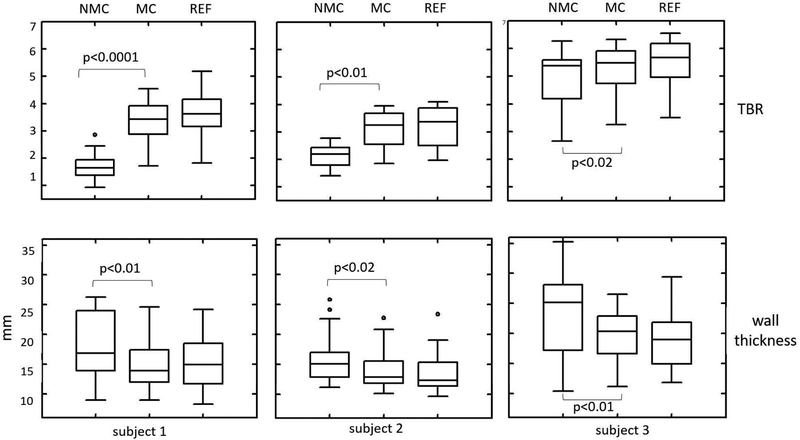
Fig. 8 shows TBR and apparent wall thickness in MC, NMC, and REF images for all three subjects. For all subjects, MC yielded higher TBR (p<0.05) and lower wall thickness (p<0.05) than NMC. The quantitative results were consistent with the visual inspection (See Figs. 6 and 7). Table I summarizes the mean of TBR and measured wall thickness values for both phantom and human studies. In the selected ROIs, the increase in mean TBR after body motion correction was 114.0%, 44.2 % and 6.7 % for each human subject, respectively. For all sampled profiles, the mean decrease in myocardial wall thickness was 16.8 %, 11.2 % and 16.9 % for each subject, respectively.
Figure 8:
Myocardium TBR and wall thickness comparison between NMC, MC and REF images for human subjects. Overall, MC yields higher TBR and lower wall thickness than NMC.
Table I:
TBR and wall thickness measured in NMC, MC and REF images for all phantom and human subject studies. These results were the mean values calculated based on the ROIs and profiles described in Fig. 1.
| Study | TBR | Thickness (mm) | ||||
|---|---|---|---|---|---|---|
| MC | REF | NMC | MC | REF | NMC | |
| Phantom fast | 4.8 | 4.71 | 2.12 | 9.52 | 9.54 | N/A* |
| Phantom slow | 2.53 | 4.57 | 1.76 | 10.86 | 9.42 | 14.32 |
| Subject 1 | 3.66 | 3.78 | 1.71 | 15.1 | 15.28 | 18.14 |
| Subject 2 | 3.1 | 3.19 | 2.15 | 13.98 | 13.46 | 15.74 |
| Subject 3 | 5.28 | 5.47 | 4.95 | 19.7 | 18.82 | 23.72 |
Unable to be quantified due to the ghost artifacts caused by motion in the image (left-bottom in Fig.3).
4. DISCUSSION
In this paper, we proposed a method that can correct body motion in PET imaging. We evaluated the performance of the method using both phantom and human studies. The results suggest that the proposed body motion correction method mitigates body motion artifacts in cardiac PET images. Improved spatial resolution, recovery of the myocardium activity, and reduced spill-over to the blood pool in the left ventricle were observed. Significantly higher TBR (p<0.05 for all the subjects) and lower wall thickness (p<0.05 for all the subjects) were obtained in MC, as compared to NMC images. All regions in myocardium exhibited improvement of image quality after motion correction. MC and REF images have similar image quality except that REF images were noisier. It is worth noting that the proposed approach is not limited to the specific scanner used in this study. Because the motion correction was performed purely based on PET raw data, the approach can be applied to stand-alone PET, PET/CT, and PET/MR as long as the scanner supports data acquisition in list-mode. Furthermore, the proposed approach can be extended to TOF-PET. With TOF information available, COM can be computed using TOF information rather than simply the center of each LOR. As a result, the correlation between COM and movement of activity distribution will be enhanced, therefore, leading to improved motion detection sensitivity and hence overall quality of correction.
Unlike some of the previously developed methods, our approach uses the information only from PET list-mode data, therefore, does not require information from external sensors. This makes it easier to implement the method in clinical settings. Also, the proposed method has two advantages over the conventional image-driven motion correction method (See Sec. 1). First, the conventional image-driven method bins list-mode data into even frames followed by reconstructing the data in each frame. The time duration of each frame is somewhat arbitrary. It ignores intra-frame motion and cannot determine exactly when body motion happens during a scan. Our approach computes a single metric, i.e., motion index, using a sliding window to detect motion. This allows us to bin the data according to the detected body motion during the scan, therefore, making motion compensation more accurate. Second, in our method, motion compensation is performed using a joint image reconstruction framework, which preserves Poisson noise properties in each SF and sub-MF. As a result, the noise level in motion-corrected image volume is not compromised38.
The proposed method is fully automatic that requires no intervention, e.g., manual selection for the adaptive threshold or separation of static and moving frames. To process a 20-minute list-mode data, it took ~7.5 hours in total using a single core on a 2.40-GHz 8-core Intel(R) Xeon(R) CPU. Reading list-mode events into the memory, motion detection, motion estimation, and image reconstruction took ~ 1 hour, 30 seconds, 1 hour, and 5.5 hours, respectively. Parallel computing could be used in the future to speed up the time-consuming steps.
To detect motion, we first divided list-mode data into 1-second bins and computed COM signals using Eq. (1). Because a typical respiratory cycle lasts ~5 seconds, we can see the influence of respiratory motion in the COM signals as shown in Fig. 4. Such respiratory signals, however, will have negligible effect on the motion index, which is used to detect body motion, because we used a 25-second sliding window, which is much longer than a respiratory cycle.
In this study, a given 1-second bin was assigned to either SF or MF by thresholding the motion index signal derived from Eq. (3). In this study, the threshold was set to the motion index value, at which the number of 1-second bins equals to 5% of the (static) peak value in the histogram of motion index. The periods when motion index is less than the threshold were assigned as SFs, otherwise, as MFs. The sensitivity of motion is affected by the value of the threshold as well as by the length of each sub-MF. The lower the threshold or shorter the length of each sub-MF, the higher the sensitivity. The length of each sub-MF, during which no motion is assumed, should be, however, long enough so that enough counts are contained and the effect from the respiratory signals becomes negligible.
We want to point out some limitations associated with our approach. First, we target at static PET scans, in which the tracer distribution remains relatively stable during the scan. Before reaching equilibrium, tracer distribution in the subject changes as a function of time. Such change, especially during the first few minutes after the injection, can contaminate the covariance matrix obtained in Eq. (2), making it difficult to detect motion. However, if motion is much faster than the change of tracer distribution, our approach can still be applied even if the tracer distribution is not at equilibrium. For instance, the 20-minute list-mode data used in this study for subject 1 were acquired ~45 minutes after the injection. During that 20 minutes, the FDG distribution was not at equilibrium yet, but its change was much slower than the speed of body motion. As a result, our approach was able to detect the motion successfully. While we have proved the feasibility of the proposed approach on myocardial viability studies, our approach still needs to be validated for myocardial perfusion imaging (MPI) studies. 82Rb and 13NH3 are the most commonly used PET tracers for MPI. For these two, our motion detection method may not work well because the change of tracer distribution can be fast when data are acquired. However, we expect the proposed approach will work for 18F-flurpiridaz PET imaging39. This new 18F labelled tracer is currently being evaluated in a clinical trial40 and has significant clinical potential because of its long half-life, high extraction factor and slow wash-out rate. Our approach is more important for 18F based tracers because 18F has smaller positron range than other PET radionuclides, hence better spatial resolution. We believe this feasibility study using 18F-FDG and 18F-TPP serves as an important step toward body motion correction for 18F-flurpiridaz PET, which is currently unavailable for human studies. Second, we only detected and corrected body motion in this study. There are three types of motion, which include cardiac, respiratory, and body motion, associated with a cardiac PET scan. We and others have previously studied extensively how to correct for cardiac and respiratory motion alone or together assuming no body motion5–10, 41, 42. One future work is to correct for all types of motion together for cardiac PET. We can assume that cardiac motion is superimposed on top of respiratory motion while respiratory motion is superimposed on top of the body motion. Further studies are needed to investigate how body motion affects motion phase tracking and motion field measurement for both cardiac and respiratory motion.
The proposed approach can be applied to other applications such as the brain and thoracic/abdominal oncologic imaging. Depending on the application, some modifications might be needed in the implementation of our approach. For example, only rigid registration is needed for motion estimation and motion-compensated image reconstruction for brain imaging. Also, the interval of sub-MFs can be less than 25 seconds to achieve more sensitive motion detection if we do not need to average out both cardiac and respiratory effects.
5. CONCLUSION
Body motion, which is unpredictable and should to be tracked all the time during a PET scan, can introduce unacceptable artifacts in PET images. In this study, we have proposed a data-driven approach that can detect and compensate such motion in PET. We detect motion using a sliding time window and estimate motion transformations using back-projected images. We incorporate the estimated motion transformations into PET system matrix and jointly reconstructed data in all frames to obtain a motion-corrected image volume in a static reference time frame without compromising PET statistics. We have applied our technique to cardiac phantom and human studies. Our approach yields improved image quality both visually and quantitatively.
ACKNOWLEDGMENTS
The authors want to thank Julia-Ann Scotton and Marina-Therese Macdonald for their help on human studies. This work was supported in part by grants R01-HL118261, R01-HL137230, P41-EB022544 and T32-EB013180 from National Institute of Health.
Footnotes
CONFLICT OF INTEREST
The authors have no conflicts to disclose.
REFERENCES
- 1.Gillman A, Smith J, Thomas P, Rose S, and Dowson N, PET motion correction in context of integrated PET/MR: Current techniques, limitations, and future projections: Current, Med. Phys 44(12), 430–445 (2017). [DOI] [PubMed] [Google Scholar]
- 2.Carles M, Bach T, Torres-Espallardo I, Baltas D, Nestle U, and Martí-Bonmatí L, Significance of the impact of motion compensation on the variability of PET image features, Phys. Med. Biol 63(6), 065013 (2018). [DOI] [PubMed] [Google Scholar]
- 3.Catana C, Motion correction options in PET/MRI, Semin. Nucl. Med 45(3), 212–223 (2015). [DOI] [PMC free article] [PubMed] [Google Scholar]
- 4.Liu C, Pierce LA, Alessio AM, and Kinahan PE, The impact of respiratory motion on tumor quantification and delineation in static PET/CT imaging, Phys. Med. Biol 54(24), 734520137362 (2009). [DOI] [PMC free article] [PubMed] [Google Scholar]
- 5.Kolbitsch C, Ahlman MA, Davies-Venn C, et al. , Cardiac and Respiratory Motion Correction for Simultaneous Cardiac PET/MR, J. Nucl. Med 58(5), 846–852 (2017). [DOI] [PMC free article] [PubMed] [Google Scholar]
- 6.Petibon Y, Guehl NJ, Reese TG, et al. , Impact of motion and partial volume effects correction on PET myocardial perfusion imaging using simultaneous PET-MR, Phys. Med. Biol 62(2), 326–343 (2017). [DOI] [PMC free article] [PubMed] [Google Scholar]
- 7.Robson PM, Trivieri M, Karakatsanis NA, Padilla M, and Abgral R, Correction of respiratory and cardiac motion in cardiac PET / MR using MR-based motion modeling Correction of respiratory and cardiac motion in cardiac PET / MR using MR-based motion modeling, (2018). [DOI] [PMC free article] [PubMed]
- 8.Yu Y, Chan C, Ma T, et al. , Event-by-Event Continuous Respiratory Motion Correction for Dynamic PET Imaging, J. Nucl. Med 57(7), 1084–1090 (2016). [DOI] [PubMed] [Google Scholar]
- 9.Rubeaux M, Doris MK, Alessio A, and Slomka PJ, Enhancing Cardiac PET by Motion Correction Techniques, Curr. Cardiol. Rep 19(2), 14–17 (2017). [DOI] [PubMed] [Google Scholar]
- 10.Newby DE, Dweck MR, Li D, et al. , Motion Correction of 18F-NaF PET for Imaging Coronary Atherosclerotic Plaques, J. Nucl. Med 57(1), 54–59 (2015). [DOI] [PubMed] [Google Scholar]
- 11.Hunter C, Klein R, Beanlands RS, and Dekemp RA, Patient motion effects on the quantification of regional myocardial blood flow with dynamic PET imaging, Med. Phys 43(4), 1829–1840 (2016). [DOI] [PubMed] [Google Scholar]
- 12.Lee BC, Moody JB, Poitrasson-Rivière A, et al. , Blood pool and tissue phase patient motion effects on 82rubidium PET myocardial blood flow quantification, J. Nucl. Cardiol 1–12 (2018). [DOI] [PMC free article] [PubMed] [Google Scholar]
- 13.Kyme A, Se S, Meikle S, et al. , Markerless Motion Tracking of Awake Animals in Positron Emission Tomography., IEEE Trans. Med. Imaging 33(11), 2180–2190 (2014). [DOI] [PubMed] [Google Scholar]
- 14.Noonan PJ, Howard J, Hallett WA, and Gunn RN, Repurposing the Microsoft Kinect for Windows v2 for external head motion tracking for brain PET, Phys. Med. Biol 60(22), 8753–8766 (2015). [DOI] [PubMed] [Google Scholar]
- 15.Spangler-Bickell MG, Zhou L, Kyme AZ, De Laat B, Fulton RR, and Nuyts J, Optimising rigid motion compensation for small animal brain PET imaging, Phys. Med. Biol 61(19), 7074–7091 (2016). [DOI] [PubMed] [Google Scholar]
- 16.Huang C, Ackerman JL, Petibon Y, et al. , Motion compensation for brain PET imaging using wireless MR active markers in simultaneous PET–MR: Phantom and non-human primate studies, Neuroimage 91, 129–137 (2014). [DOI] [PMC free article] [PubMed] [Google Scholar]
- 17.Huang C, Ackerman JL, Petibon Y, Brady TJ, El Fakhri G, and Ouyang J, MR-based motion correction for PET imaging using wired active MR microcoils in simultaneous PET-MR: Phantom study, Med. Phys 41(4), 41910 (2014). [DOI] [PMC free article] [PubMed] [Google Scholar]
- 18.Jin X, Mulnix T, Gallezot JD, and Carson RE, Evaluation of motion correction methods in human brain PET imaging-A simulation study based on human motion data, Med. Phys 40(10), 1025031–12 (2013). [DOI] [PMC free article] [PubMed] [Google Scholar]
- 19.Mukherjee JM, Lindsay C, Mukherjee A, et al. , Improved frame-based estimation of head motion in PET brain imaging, Med. Phys 43(5), 2443–2454 (2016). [DOI] [PMC free article] [PubMed] [Google Scholar]
- 20.Mohy-ud-Din H, Nicolas A, Willis W, et al. , Intra-frame Motion Compensation in Multi-frame Brain PET Imaging, Front. Biomed. Technol 2(2), 60–72 (2015). [Google Scholar]
- 21.Ye H, Wong K-P, Wardak M, et al. , Automated Movement Correction for Dynamic PET/CT Images: Evaluation with Phantom and Patient Data, PLoS One 9(8), 103745 (2014). [DOI] [PMC free article] [PubMed] [Google Scholar]
- 22.Woo J, Tamarappoo B, Dey D, et al. , Automatic 3D registration of dynamic stress and rest 82Rb and flurpiridaz F 18 myocardial perfusion PET data for patient motion detection and correction, Med. Phys 38(11), 6313–6326 (2011). [DOI] [PMC free article] [PubMed] [Google Scholar]
- 23.Turkington TG, DeGrado TR, Hanson MW, and Coleman RE, Alignment of dynamic cardiac PET images for correction of motion, IEEE Trans. Nucl. Sei 44(2), 235–242 (1997). [Google Scholar]
- 24.Büther F, Dawood M, Stegger L, et al. , List Mode-Driven Cardiac and Respiratory Gating in PET, J. Nucl. Med 50(5), 674–681 (2009). [DOI] [PubMed] [Google Scholar]
- 25.Büther F, Ernst I, Frohwein LJ, Pouw J, Schäfers KP, and Stegger L, Data-driven gating in PET: Influence of respiratory signal noise on motion resolution, Med. Phys 45(7), 3205–3213 (2018). [DOI] [PubMed] [Google Scholar]
- 26.Kesner AL, Chung JH, Lind KE, et al. , Validation of Software Gating: A Practical Technology for Respiratory Motion Correction in PET, Radiology 281(1), 239–248 (2016). [DOI] [PubMed] [Google Scholar]
- 27.Salomon A, Zhang B, Patrick O, and Andreas G, Robust real-time extraction of respiratory signals from PET list-mode data, Phys. Med. Biol 63(11), 115009 (2018). [DOI] [PubMed] [Google Scholar]
- 28.Schleyer PJ, O’Doherty MJ, Barrington SF, and K Marsden P, Retrospective data-driven respiratory gating for PET/CT, Phys. Med. Biol 54(7), 1935–1950 (2009). [DOI] [PubMed] [Google Scholar]
- 29.Schleyer PJ, Thielemans K, and Marsden PK, Extracting a respiratory signal from raw dynamic PET data that contain tracer kinetics, Phys. Med. Biol 59(15), 4345–4356 (2014). [DOI] [PubMed] [Google Scholar]
- 30.Feng T, Wang J, Dong Y, Zhao J, and Li H, A Novel Data-Driven Cardiac Gating Signal Extraction Method for PET, IEEE Trans. Med. Imaging 38(2), 629–637 (2019). [DOI] [PubMed] [Google Scholar]
- 31.Schleyer PJ, Dunn JT, Reeves S, Brownings S, Marsden PK, and Thielemans K, Detecting and estimating head motion in brain PET acquisitions using rawtime-of-flight PET data, Phys. Med. Biol 60(16), 6441–6458 (2015). [DOI] [PubMed] [Google Scholar]
- 32.Liu H, Shah S, and Jiang W, On-line outlier detection and data cleaning, Comput. Chem. Eng 28(9), 1635–1647 (2004). [Google Scholar]
- 33.Klein S, Staring M, Murphy K, Viergever MA, and Pluim JPW, elastix: A Toolbox for Intensity-Based Medical Image Registration, IEEE Trans. Med. Imaging 29(1), 196–205 (2010). [DOI] [PubMed] [Google Scholar]
- 34.Rueckert D, Sonoda L.l., Hayes C, Hill DLG, Leach MO, and Hawkes DJ, Nonrigid registration using free-form deformations: application to breast MR images, IEEE Trans. Med. Imaging 18(8), 712–721 (1999). [DOI] [PubMed] [Google Scholar]
- 35.Watson CC, New, faster, image-based scatter correction for 3D PET, IEEE Trans. Nucl. Sei 47(4), 1587–1594 (2000). [Google Scholar]
- 36.Hudson HM and Larkin RS, Ordered subsets of projection data, IEEE Trans. Med. Imaging 13(4), 601–609 (1994). [DOI] [PubMed] [Google Scholar]
- 37.Okazumi S, Dimitrakopoulou-Strauss A, Schwarzbach MHM, and Strauss LG, Quantitative, dynamic 18F-FDG-PET for the evaluation of soft tissue sarcomas: relation to differential diagnosis, tumor grading and prediction of prognosis., Hell J Nucl Med 12(3), 223–228 (2009). [PubMed] [Google Scholar]
- 38.Polycarpou I, Tsoumpas C, and Marsden PK, Analysis and comparison of two methods for motion correction in PET imaging, Med. Phys 39(10), 6474–6483 (2012). [DOI] [PubMed] [Google Scholar]
- 39.Yu M, Guaraldi MT, Mistry M, et al. , BMS-747 158–02: a novel PET myocardial perfusion imaging agent, J. Nucl. Cardiol 14(6), 789–798 (2007). [DOI] [PubMed] [Google Scholar]
- 40.Taillefer R and Harel F, Radiopharmaceuticals for cardiac imaging: Current status and future trends, J. Nucl. Cardiol 25(4), 1242–1246 (2018). [DOI] [PubMed] [Google Scholar]
- 41.Petibon Y, Huang C, Ouyang J, et al. , Relative role of motion and PSF compensation in whole-body oncologic PET-MR imaging, Med. Phys 41(4), 42503 (2014). [DOI] [PMC free article] [PubMed] [Google Scholar]
- 42.Ouyang J, Li Q, and El Fakhri G, Magnetic Resonance-Based Motion Correction for Positron Emission Tomography Imaging, Semin. Nucl. Med 43(1), 60–67 (2013). [DOI] [PMC free article] [PubMed] [Google Scholar]


