

Abstract
Background
Our previous study found a novel fluid combination with better resuscitation effects under hypotensive condition at the early stage of uncontrolled hemorrhagic shock (UHS). However, the optimal recovery concentration of hypertonic saline in this fluid combination remains unknown. This experiment aimed to explore the optimal concentration.
Material/Methods
New Zealand white rabbits (n=40) were randomly divided into 5 groups, including a sham-operated group (SO), a shock non-treated group (SNT), a normal saline group (NS), and hypertonic saline groups (4.5% and 7.5%). We established an UHS model and administered various fluid combinations (dose-related sodium chloride solution+crystal-colloidal solution) to the groups followed by monitoring indexes of hemodynamic and renal function, measuring infusion volume and blood loss, and analyzing pathological morphology by hematoxylin and eosin staining.
Results
The hypertonic saline groups showed more stable hemodynamic indexes, reduced blood loss, fewer required infusions, and milder decreases in renal function than those of control groups (SNT and NS groups), and exhibited fewer pathological changes in the heart, lung, kidney, and liver. All indexes in the 4.5% and 7.5% groups were better than those of the NS group, and the hemodynamic indexes in the 7.5% group were more stable than those of the 4.5% group (P<0.05), with reduced blood loss and infusion volume and a milder decrease in renal function.
Conclusions
The novel fluid combination with 7.5% hypertonic saline group had a better recovery effect at the early stage of UHS before hemostasis compared to that of the 4.5% hypertonic saline group. This result may provide guidance for clinical fluid resuscitation.
MeSH Keywords: Hemodynamics; Pathologic Processes; Resuscitation; Saline Solution, Hypertonic; Shock, Hemorrhagic
Background
As we all known, major trauma is an important contributing factor of death worldwide. Hemorrhage is the most common preventable cause of death after trauma, accounting for up to 30–40% of trauma-related deaths [1]. Hemorrhagic shock is a common complication of trauma and is the main cause of death of the wounded [2]. This is especially true on the battlefield, where the most severe and complex injuries and various types of trauma occur due to a complexity of damaging factors. Uncontrolled hemorrhagic shock (UHS) is a primary type of hemorrhagic shock on the battlefield, and considered high risk of death for soldiers in the battlefield [2]; the wounded face a variety of problems including insufficient fluid resuscitation and undetermined fluid concentrations. Fluid resuscitation is one of the effective treatments for UHS.
An early fluid resuscitation program reported use of “sufficient” aggressive resuscitation to guarantee normal circulation blood volume [3]. However, recent studies have shown that aggressive resuscitation before surgical hemostasis can lead to severe hemodilution and coagulation dysfunction, negatively affecting oxygen delivery and aggravating bleeding [4–7]. Therefore, aggressive resuscitation protocols are not appropriate for the recovery of UHS [8]. Restrictive hypotensive fluid resuscitation aims to provide necessary doses of fluid to ensure the basic blood supply to vital organs, maintaining mean arterial pressure (MAP) in a lower range. Mihara et al. showed that limiting fluid resuscitation is a relatively safe way to keeping MAP at low levels [9]. Controlling MAP at 50–60 mmHg during UHS effectively reduces blood loss and prolongs survival time [10,11]. Studies have confirmed that the effect of hypotensive resuscitation combined with hypertonic saline is more ideal, based on maintaining organ perfusion pressure but not pursuing “normal blood pressure” [12]. Based on current research results, our research team conducted a large number of preliminary studies and reached these conclusions: hypotensive resuscitation with the novel combination of fluids via 7.5% hypertonic saline solution (HSS) and lactate Ringer’s solution (LRS)+6% hydroxyethyl starch 130/0.4 solution (HES) (ratio of 2: 1) has a more effective treatment at the early stage of UHS before hemostasis [13]. However, whether or not a 7.5% of hypertonic saline solution has the best resuscitation effect in this novel combination remains to be discussed.
Recent studies showed that 3–7.5% sodium chloride solution was safe and effective in resuscitation [14]. Hypertonic saline restores blood volume, enhances myocardial contractility, reduces peripheral resistance, and promotes anti-inflammation, thus protecting the function of important organs (heart, brain, lung, and kidney), and exerts favorable anti-shock effects [15–17]. Based on our previous experiments, the main purpose of this study was to explore which concentration had the best effect at the early stage of UHS before hemostasis. Therefore, we designed 2 concentrations of hypertonic saline (4.5% and 7.5%) with the novel combination in the safe concentration range, and set the normal saline group (0.9% sodium chloride solution) with the same combination as one of the control groups.
Material and Methods
Resuscitation fluids
Five fluids were used: 0.9% sodium chloride solution (Center of the Air Force Medical University), 4.5% hypertonic saline solution and 7.5% hypertonic saline solution (self-generated based on 0.9% sodium chloride solution), crystal-colloidal solution: lactated Ringer’s solution (LRS, Huaren Pharmaceutical Co., Ltd.), and hydroxyethyl starch 130/0.4 sodium chloride solution (HES, Beijing Fresenius Kabi Pharmaceutical Co., Ltd.).
Ethics statement
This study was conducted in strict accordance with the standards of the Guide for the Care and Use of Laboratory Animals by the National Institutes of Health (NIH Publications No. 8023, revised 1978). The animal experiment protocol was audited by the Animal Care and Use Committee of the Air Force Military Medical University. The experimenters endeavored to minimize pain in the animals; the experiment was performed under anesthesia and the treatment of animals followed principles of humanistic care.
Animals management
Forty New Zealand white rabbits (2.0–3.0 kg) were purchased from Laboratory Animal Centre of the Air Force Medical University (Permission Number: SYXK–military 2012–0023), and there were no significant differences in gender, weight, and age among the 40 rabbits (P>0.05). Rabbits were housed in environments with ambient temperature of 22–26°C and relative humidity approximately 55%, for 7 days to acclimate to the environment. They were then fasted but were allowed water ad libitum for 12 hours before the experiment.
Surgical procedures
First, a UHS model was established using 4 steps: anesthesia, fixation, intubation, and hemorrhage. On the day of the experiment, the rabbits were anaesthetized with 3% sodium pentobarbital 30 mg/kg through ear vein intravenous injection, and anesthesia was maintained by additional doses as necessary. The rabbits were kept supine and spontaneously breathing during the experiments. After the pain reflex disappeared, the rabbits were fixed on the operating table. After routine tincture disinfection and skin preparation, skin tissue was cut along the median position of the neck, and the connective tissue around the trachea was separated and the trachea was freed for approximately 5 cm with a separator. In the position of the thyroid cartilage of the trachea, the “T” incision was cut, and we inserted the “Y” tracheal intubation in the direction of chest cavity, ligated it and fixed it. Based on the previous experiments of our research group, we applied the method of hypotensive resuscitation in this study. The UHS model was established by transecting the rabbit’s spleen, and femoral artery blood draw maintained the arterial pressure at a low-pressure level (40–45 mmHg). In the lateral resection of the spleen parenchyma, the blood of the spleen was free to flow into the abdominal cavity (avoiding damage to the branch of the aorta around the spleen during surgery). Ten minutes after the transection operation, blood was drawn from the femoral artery to lower MAP to 40–45 mmHg. After reaching the low-pressure level, MAP was maintained for 15 minutes by returning the blood and continuing to draw additional blood (Figure 1). The blood was placed into a sterile heparinized syringe and stored at room temperature for returning.
Figure 1.
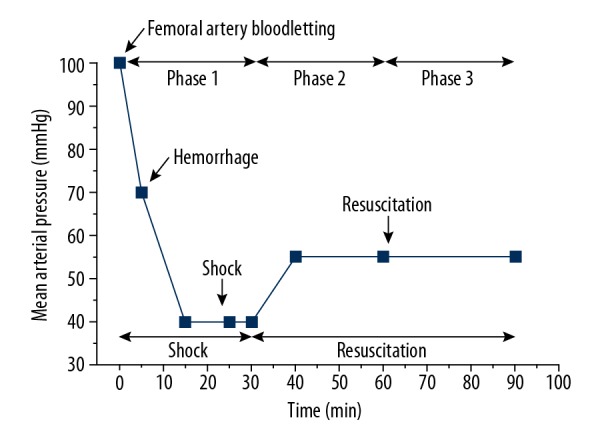
Protocol of establishing UHS model. Rabbits were subjected to UHS by bleeding via the femoral artery, followed by drawing additional amounts of blood to maintain MAP of 40–45 mmHg for 15 minutes. At T30, the blood was allowed to flow free. Animals were treated with the dose-related saline at 10 minutes. Then, rabbits were treated with LRS+HES (ratio of 2: 1) to maintain MAP of 50–55 mmHg (hypotensive resuscitation). UHS – uncontrolled hemorrhagic shock; MAO – mean arterial pressure; LRS – lactate Ringer’s solution; HES – 6% hydroxyethyl starch 130/0.4 solution.
Experimental protocol
Experimental phases
This experiment was divided into 3 phases. Phase 1 was the acute shock stage (0–30 minutes). The main task of this stage was to establish UHS model. Phase 2 was the initial recovery stage (30–60 minutes), and the resuscitation fluid combination we used was a novel combination of fluids that was validated in the early experience, 4 mL/kg dose of 0.9% sodium chloride solution, 4.5% hypertonic saline or 7.5% hypertonic saline infused with LRS+HES (ratio of 2: 1). Then, the infusion speed was controlled to maintain MAP between 50–55 mmHg. Phase 3 was the resuscitation-maintenance stage (60–90 minutes), and fluid resuscitation was maintained using the aforementioned recovery plan.
Grouping operation
Forty rabbits were randomly divided into 1 of the following 5 experimental groups (n=8 per group). The first group, the sham operated (SO) group, underwent a sham operation in which the rabbits were subjected to all the surgical procedures experienced by the hemorrhaged animals but were not hemorrhaged or transfused. The second group, the shock non-treated (SNT) group, underwent the operation of acute shock stage (hemorrhage with no fluid resuscitation) to maintain the rabbits in the state of active hemorrhage. The next 3 groups were the normal saline (NS) group (0.9% sodium chloride solution with LRS+HES [ratio of 2: 1]), the 4.5% group (4.5% hypertonic saline solution with LRS + HES [ratio of 2: 1]), and the 7.5% group (7.5% hypertonic saline solution with LRS+HES [ratio of 2: 1]).
Left ventricular systolic pressure (LVSP), maximal rate of the increase of left ventricular pressure, and maximal rate of the change of left ventricular pressure (±dp/dtmax), central venous pressure (CVP) and heart rate (HR) were captured dynamically at T0, T30, T60, and T90 from a biological function experimental data acquisition system. Femoral artery blood samples of approximately 2 mL were drawn at 4 time points, and after centrifugation at 3000 rpm, the supernatants were labelled and placed in centrifuge tubes at −20°C to be used for measuring blood urea nitrogen (BUN) and serum creatinine (SCR) at the end of the experiment. Total blood loss and total fluid infusion were calculated for each group through the summation of the next 2 phases. To observe the degree of damage of the pathological sections, the rabbits were sacrificed, and hearts, lungs, kidneys, and livers were removed.
Systemic parameters measurements and blood analysis/renal function analysis
Hemodynamic indexes were captured directly and monitored continuously from the BL-420F biological function experimental data acquisition system (Chengdu Taimeng Technology Co., Ltd.). BUN and SCR were measured by centrifuging blood via high-speed centrifuge (Germany Eppendorf AG) and Scr spectrophotometry (Shanghai Huguang Medical Technology Co., Ltd.).
Pathological section
Rabbits were sacrificed with overdoses of sodium pentobarbital after the relevant experimental data were collected at the end of the experiment. The hearts, lungs, kidneys, and livers of rabbits in each group were removed for samples, and were fixed with 10% buffered formalin; tissue sections were prepared (dehydration, transparency, wax immersion, embedding, slicing, patching, baking, dewaxing, hydration) and stained with hematoxylin and eosin (H&E) for microscopic examination.
Statistical analysis
Results, including hemodynamic indexes, renal function indexes, and histopathologic injury scores, were expressed as the means ± standard deviation (SD) unless otherwise noted, and analyzed by 2-way analysis of variance with repeated measures. If a variable changed significantly between different points in time, multiple comparison tests (least significant difference, LSD-t) were used. Analysis was performed with a statistical software package for notebook computers (SPSS17.0). P<0.05 (2-sided) was considered statistically significant.
Results
Mean age, baseline-weight, and initial MAP of each group were not significantly altered according to one-way ANOVA (Table 1).
Table 1.
Comparison of basic status between the various groups.
| Groups | N | Age (months) | Baseline-weight (kg) | MAP (mmHg) |
|---|---|---|---|---|
| SO group | 8 | 5.35±0.64 | 2.28±0.65 | 95.26±0.64 |
| SNT group | 8 | 5.50±0.71 | 2.46±0.12 | 96.01±0.53 |
| NS group | 8 | 5.48±0.68 | 2.43±0.26 | 95.79±0.64 |
| 4.5% group | 8 | 5.42±0.67 | 2.34±0.72 | 95.83±0.45 |
| 7.5% group | 8 | 5.53±0.56 | 2.39±0.24 | 95.37±0.51 |
| P | 0.434 | 0.924 | 0.912 |
No significant differences in age (months), baseline-weight, or MAP were found between the groups. MAP – mean arterial pressure; SO – sham-operated; SNT – shock non-treated group; NS – normal saline group; 4.5% – 4.5% hypertonic saline solution; 7.5% – 7.5% hypertonic saline solution.
Hemodynamic indexes
At T0, there were no significant differences in any parameter between the groups. After bloodletting, parameters of the SNT group were significantly lower in terms of LVSP, from 133.86±14.30 to 90.98±9.64 mmHg (Figure 2A), and in terms of CVP from 3.38±0.62 to1.45±0.08 cm H2O (Figure 2B), reaching the lowest level at T15. Within the next 15 minutes, the LVSP and CVP levels of the SNT group recovered slightly (Figure 2). Similar changes in LVSP and CVP were observed in the NS group, the 4.5% group, and the 7.5% group (Figure 2). At T30, the LVSP and CVP of the SO group were significantly different from those of the other 4 groups (P<0.05, Figure 2). And LVSP and CVP showed no significant differences among the NS group, the 4.5% group, and the 7.5% group (Figure 2). From T30–T90, in the SNT group, the level of LVSP decreased from 91.32±9.41 to 68.45±10.91 mmHg (Figure 2A), and the level of CVP decreased from 1.46±0.09 to 1.01±0.13 cm H2O (Figure 2B). From T30–T60, the LVSP of the NS group increased slowly from 93.42±7.43 to 93.59±7.28 mmHg (Figure 2A), and the CVP increased from 1.53±0.32 to 1.72±0.34 cm H2O (Figure 2B). However, the LVSP and CVP of the 4.5% group had a rapid increase from T30–T45 first and then markedly dropped at T45–T90 (Figure 2). The 7.5% group showed similar changes to those of the 4.5% group. At T60 and T90, LVSP and CVP in the SNT group were significantly lower than those of the other groups (P<0.001; Figure 2). By further comparison, the LVSP of the NS group was significantly lower than that in the 4.5% group and the 7.5% group (P<0.05; Figure 2A), and that of the 7.5% group was significantly higher than that of the 4.5% group (P<0.05; Figure 2A). The differences of CVP among the NS group, the 4.5% group, and the 7.5% group were not significant.
Figure 2.

(A, B) LVSP, CVP at T0, T15, T30, T45, T60 and T90. * P<0.05: at T15 and T30, LVSP, CVP in group SO were significantly higher than those in the SNT group, the NS group, the 4.5% group, and the 7.5% group. @ P<0.05: at T45, LVSP, CVP in the 7.5% group were significantly higher than those in the SNT group and the NS group. At T45, # P<0.05: LVSP in the 7.5% group was significantly higher than in the 4.5% group. Abbreviations: SO, sham-operated, SNT, shock non-treated group; NS, normal saline group; 4.5% – 4.5% hypertonic saline solution; 7.5% – 7.5% hypertonic saline solution; n=8 for all groups.
During the acute shock stage (T0–T30), parameters of the SNT group showed a significant decrease in +dp/dtmax from 6711.30±1392.78 to 2225.00±1113.16 mmHg/s (Figure 3A), and in −dp/dtmax from 5047.50±1227.86 to 2168.80±1268.77 mmHg/s (Figure 3B), reaching the lowest level at T15. Then, in the next 15 minutes, the ±dp/dtmax of levels of SNT group recovered slightly (Figure 3). A similar change in +dp/dtmax was observed in the 4.5%, group and the 7.5% group (Figure 3A), and the change in −dp/dtmax was similar to that of the NS, group, the 4.5% group, and 7.5% group (Figure 3B). After entering the initial recovery stage, the ±dp/dtmax of the SNT group decreased continuously without fluid resuscitation (Figure 3). The parameters of the NS group in ±dp/dtmax showed a mild increase. However, ±dp/dtmax of the 4.5% group was observed to change from rise to fall, reaching the peak at T45 and the same change was seen in the 7.5% group. At T60 and T90, ±dp/dtmax in the SNT group was significantly lower than those in the other groups (P<0.05; Figure 3). Then, the ±dp/dtmax of NS group was significantly lower than those in the 4.5% group and the 7.5% group (P<0.05; Figure 3) and that of the 7.5% group was significantly higher than that of the 4.5% group (P<0.05; Figure 3).
Figure 3.

(A, B) ±dp/dtmax at T0, T15, T30, T45, T60 and T90. * P<0.05: at T15, T30, ±dp/dtmax in the SO group was significantly higher than in the SNT group, the NS group, the 4.5% group, and the 7.5% group. @ P<0.05: at T45, ±dp/dtmax in the 7.5% group was significantly higher than in the SNT group and the NS group. # P<0.05: ±dp/dtmax in the 7.5% group was significantly higher than in 4.5% group. SO – sham-operated; SNT – shock non-treated group; NS – normal saline group; 4.5% – 4.5% hypertonic saline solution; 7.5% – 7.5% hypertonic saline solution; n=8 for all groups.
The heart rate changes in all groups due to surgery and bloodletting were relatively consistent, and the heart rate values were all higher at T0–T30 (Figure 4); however, the differences were not significant. After entering the initial recovery stage, the heart rate in the SO group, the SNT group, and NS group were generally stable. The level of heart rate in the 4.5% group declined from 225.75±22.81 to 204.63±29.45 beats/min (Figure 4) and the 7.5% group showed a similar fall. Compared with baseline, the difference in heart rate between the 4.5% group and the 7.5% group was significant (P<0.05; Figure 4); however, there was no statistically significant difference between the groups at T90.
Figure 4.

HR at T0, T15, T30, T45, T60 and T90. * P<0.05: at T90, HR in group 7.5% were significantly higher than those in the NS group and the 4.5% group. SO – sham-operated; SNT – shock non-treated group; NS – normal saline group; 4.5% – 4.5% hypertonic saline solution; 7.5% – 7.5% hypertonic saline solution; n=8 for all groups.
Changes in the function of the kidney (BUN and SCR)
At T0, there were no significant differences in BUN and SCR among rabbits in each group. During the acute shock stage, the BUN and SCR in all groups except the SO group had significant rises during the acute shock (T0–T30) (Figure 5). At T30, the BUN and SCR showed no significant difference between the groups except for the SO group. During T30–T90, the index of the NS group in the BUN had a rapid rise at T30–T60, then decreased at T60–T90 (Figure 5A), and SCR increased from 104.46±15.88 to 120.52±10.35 μmol/L (Figure 5B). The indexes of the 4.5% group showed a significant fall in BUN from 6.55±1.04 to 6.13±1.06 mmol/L (Figure 5A), and in SCR from 103.50±9.78 to 107.00±17.82 μmol/L (Figure 5B). The BUN and SCR of the 7.5% group declined faster than those of the 4.5% group (Figure 5). At T60 and T90, BUN and SCR in the SNT group were significantly higher than those in the other groups (P<0.05; Figure 5). Moreover, the BUN and SCR of the NS group were significantly higher than those of the 4.5% group and the 7.5% group (P<0.05; Figure 5). The BUN and SCR showed no significant differences between the 4.5% group and the 7.5% group (Figure 5).
Figure 5.

(A, B) BUN and SCR at T0, T30, T60 and T90. * P<0.05: at T30, BUN and SCR in the SO group were significantly lower than those in the SNT group, the NS group, the 4.5% group, and the 7.5% group. @ P<0.05: at T60, BUN and SCR in the 7.5% group were significantly lower than in the NS group. # P<0.05: at T90, BUN and SCR in 7.5% group were significantly lower than those in the NS group. SO – sham-operated, SNT, shock non-treated group; NS, normal saline group; 4.5% – 4.5% hypertonic saline solution; 7.5% – 7.5% hypertonic saline solution; n=8 for all groups.
The changes of pathological section at heart, lung, kidney and liver
The organs’ histopathology changes are shown in Figure 6. The pathological scores of the various tissues are shown in Figure 7. Among them, cardiac tissue severity score [18,19]: only showed a rare degenerative lesion or inflammatory cell infiltration score of 0. There were multiple moderate cell degeneration lesions scored 1; and increased inflammatory cell infiltration and moderate fibroblast infiltration score 2. The score of severe degeneration and inflammatory infiltration but no necrosis was 3; acute degeneration, necrosis, severe inflammatory cell infiltration, mineralization and extensive fibrous tissue were scored 4. The scoring criteria for lung tissue [20]: 0, none; 1, mild injury; 2, moderate injury; 3, severe injury with pulmonary edema; 4, interstitial inflammatory cell infiltration and hemorrhage. The severity of renal tubular damage was assessed by assessing the extent of epithelial or luminal necrosis in the cortex and outer medulla, the percentage of tubular dilatation and hemorrhage: 0, none; 1, <5%; 2, 5% to 25%; 3, 25% to 75%; 4, >75% [21]. Degree of liver tissue damage: 0 points, normal liver structure; 1 point, epithelial damage or less than 25% of liver damage; 2 points, liver area damage 25–49%; 3 points, liver area damage 50–74% 4 points, >75% of liver damage [22].
Figure 6.

The changes of pathological section at heart, lung and kidney of UHS rabbits. (A) photomicrographs of heart; (B) photomicrographs of lung; (C) photomicrographs of kidney; (D) photomicrographs of liver. SO – sham-operated; SNT – shock non-treated group; NS – normal saline group; 4.5% – 4.5% hypertonic saline solution; 7.5% – 7.5% hypertonic saline solution; n=8 for all groups.
Figure 7.

The histopathologic injury score in the (A) heart, (B) lung, (C) kidney, and (D) liver after uncontrolled hemorrhagic shock (UHS). * P<0.05 for the NS group compared with the 4.5% group. @ P<0.05 for the NS group compared with the 7.5% group. # P<0.05 for 4.5% group compared with the 7.5% group.
Heart
In the SO group, cardiac muscle fibers were aligned, and there were no obvious histopathologic alterations observed in sections. In the SNT group, myocardial fibers were arranged loosely (the arrow mark) and there were breaks in the fibers, with some scattered infiltrated inflammatory cells. In the NS group, cardiac muscle fibers were arranged relatively regularly, with scattered inflammatory cells. In the 4.5% group and the 7.5% group, myocardial fibers were arranged neatly and had a basic continuity, with sporadic inflammatory cells (Figure 6A). Compared with the NS group, the injury scores of heart were lower in 7.5% group (@ P<0.05; Figure 7A). Moreover, 7.5% hypertonic saline decreased the injury scores of heart compared with 4.5% hypertonic saline after UHS (# P<0.05; Figure 7A).
Lung
In the SO group, alveolar structure was normal. However, in the SNT group, the integrity of the alveolar structure was compromised, the pulmonary vascular was showed edema, congestion, and alveolar wall thickening. Alveolar capillaries showed histopathologic alterations with visible red cells and alveolar atrophy (the arrow mark). In the NS group, lung tissue structure was basically integrated. Alveolar walls were slightly thickened with some inflammatory cells, and pulmonary arteriovenous and alveolar capillary walls were normal. In the 4.5% group and the 7.5% group, similar histopathologic alterations to those of the NS group were observed, but the pathologic changes were milder than those of the NS group (Figure 6B). Which was consistent with the histopathologic injury scores of heart. Compared with the NS group, the injury scores of lung were lower in the 7.5% group (@ P<0.05; Figure 7B), and the scores of 7.5% group were lower compared with 4.5% group (# P<0.05; Figure 7B).
Kidney
Under high-power microscope, the pathological sections of renal tissues in the SO group were normal, with normal glomerular structure. In the SNT group, kidney tissue showed mild edema. The structure of the glomeruli was mildly broken, with swollen renal tubular epithelial cells, narrow lumens and slight congestion in renal blood vessels (the arrow mark). The pathological sections of the NS group, the 4.5% group, and the 7.5% group changed slightly; however, they were not more substantial than those of the SNT group. The glomerular structures of those groups were basically normal, with sporadic inflammatory cells and occasional congestion in renal vessels (Figure 6C). Compared with the NS group, the injury scores of kidney were lower in the 4.5% group and the 7.5% group (* P<0.05, @ P<0.05; Figure 7C), and the scores of the 7.5% group were lower than the 4.5% group (# P<0.05; Figure 7C).
Liver
The SO group was basically no damage as a control group. In the SNT group, the degree of liver tissue damage was the heaviest, followed by the NS group. The damage of the hypertonic saline group was lighter than that of the NS group. Among them, the 7.5% group had lighter damage in the liver tissue than that in the 4.5% group (Figure 6D). The injury scores of the 7.5% group were significantly lower than that of the NS group (@ P<0.05; Figure 7D), but the scores of the 4.5% group and the 7.5% group were not statistically significant.
Infused volume, blood loss
The infusion volume of the NS group, the 4.5% group, and the 7.5% groups decreased successively. These 3 groups were given different fluid combinations (dose-related saline solutions+HES+LRS). The NS group (72.13±9.46 mL) was significantly higher than the 4.5% group (57.00±15.49 mL) and the 7.5% group (52.00±17.81 mL) (P<0.05; Table 2). There was no significant difference between the 4.5% group and the 7.5% groups. At T30–T90, the blood loss of the SNT group (3.04±0.16 mL) was significantly less than that of the NS group, the 4.5% group, and the 7.5% groups (P<0.05; Table 2). The loss of 7.5% group was the least of these 3 groups; however, the difference was not statistically significant.
Table 2.
Infused volume and blood loss.
| Groups | Infused Volume (mL) | |||
|---|---|---|---|---|
| 30–60 minutes infused volume | 60–90 minutes infused volume | Total infused volume | Blood loss (mL) | |
| SNT group | – | – | – | 3.24±0.16 |
| NS group | 40.50±4.11 | 31.75±6.56 | 72.13±9.46 | 6.15±0.56* |
| 4.5% group | 34.25±6.56 | 22.50±7.52 | 57.00±15.49 | 5.12±0.23* |
| 7.5% group | 29.38±12.88 | 23.50±10.20 | 52.00±17.81# | 4.89±0.34* |
P<0.05, 7.5% group versus the NS group;
P<0.05, other groups versus the SNT group.
SNT – shock with untreated; NS – normal saline; 4.5% – 4.5% hypertonic saline solution; 7.5% – 7.5% hypertonic saline solution. n=8 for all groups.
Discussion
Bleeding model could be built by damaging a single large vessel. Although blood loss through the large vessel is good for controlling speed, it cannot create a state of UHS and does not meet the requirements of UHS model. In addition, the study of Zink et al. showed that the change in hemodynamics resulted in chaos of the coagulation mechanism, and bleeding in a single blood vessel were limited [23]. UHS can be simulated by damaging substantial organs, usually established by injuring the parenchymal tissue (including impairment of the liver or spleen) [24]. Bleeding can present an uncontrolled state by destroying the parenchymal organs, however, there are some difficulties to quantify the rate of bleeding and the degree of damage [25]. In the previous phase of the experiment, our team identified an effective novel combination of fluids (brine and LRS+HES [ratio of 2: 1]) and demonstrated that maintaining hypotensive resuscitation is more conducive to first aid recovery than maintaining normal blood pressure. The method of establishing the model was to cross the spleen, which was ideal, and the amount of bleeding could be assessed by weighing the bloodsucker. Similarly, in this study, we established a UHS model by transecting the rabbit’s spleen. After the UHS model was established, we returned blood through the femoral artery to maintain blood pressure at a lower level. This method provided good controllability, and our team has a wealth of operational experience and a more accurate assessment method.
Hemodynamic index is used to assess the heart function. LVSP and +dp/dtmax are affected by cardiopulmonary load and cardiac contractility, the level of which can reflect the tension of the ventricular wall and the diastolic function of left ventricular cardiomyocytes [26]. The results of the present study showed that the hemodynamic indexes were comparatively sensitive to dose-related hypertonic saline and could appropriately reflect the effects of recovery. Compared with the NS group, the 7.5% group and the 4.5% group were closer to the SO group at each stage; and overall, the 7.5% group was closer to the SO group than the 4.5% group. It can be seen that the application of the liquid combination in the 7.5% group can make the individual more normal to the hemodynamic index. The possible explanation may be that hypertonic saline increased the concentration of Na+ in myocardial cells, promoted the exchange of Na+ and Ca2+, and significantly enhanced myocardial contractility. CVP reflects effective circulation blood volume (ECBV) and right heart function, and it is an essential basis for adjusting rehydration fluids and infusion speed. When acute bleeding occurs, the level of catecholamine secretion in the body will increase, accelerating the HR to increase blood volume of the heart pump and tissue perfusion. However, we found that changes in HR levels in rabbits with UHS were not substantial, possibly because the regulation mechanism of shock in rabbit is different from that of humans. Therefore, the selection of indexes needs to be further synchronized according to species differences.
We also found that hypertonic saline improved renal function under hypotensive conditions, restoring urine volume and reducing BUN and SCR levels. Moreover, the renal function index of the 7.5% group was closer to the SO group than the 4.5% group. This finding further supports the conclusion of Sondeen et al. that hypertonic saline for the recovery of hemorrhagic shock not only restores mean arterial pressure and cardiac output but also better maintains renal function [27]. Nevertheless, the underlying mechanisms remain unclear. According to the theory of ischemia-reperfusion injury, more severe cell damage occurs when the ischemia organs restore blood perfusion. The reason is that excessive oxygen produces superoxide anion free radicals during reperfusion, possibly aggravating renal dysfunction [28]. Interestingly, hypertonic saline, which has protective effects on ischemia reperfusion, as well as antioxidant and anti-apoptotic effects [29,30], protect kidneys from injury. Furthermore, Kreimier et al. showed that hypertonic saline solution effectively improved renal microcirculation [31] and protected shock kidney by infusion of small doses [32]. This study basically supports this theory. And the hypertonic saline combination was significantly better than the normal saline, and the 7.5% fluid combination was superior to the 4.5% group. But the difference between the 7.5% group and the 4.5% groups was not as obvious as the hypothesis, and this may have been related to the number of subjects and the close concentration in the experimental scheme, which was consistent with the problems in the study of Wu et al. [33]. Notably, BUN and SCR are 2 delayed biomarkers that take time to be regulated by the kidneys. The lower level of BUN and SCR also means that the plasma is diluted by the crystalloid infused to the rabbits. Hypertonic solutions absorb more fluid from extravascular compartment to the intravascular side and changes in BUN and SCR may more reflect the volume of intravascular compartment rather than renal function. Therefore, we also combined with other indicators such as hemodynamics to judge the resuscitation effect.
We infused the resuscitation solution at a low-pressure level without a large amount of perfusion. In the amount of infusion, the combination of hypertonic saline was significantly better than NS group, and the infusion volume required by 7.5% was less than 4.5%. In terms of blood loss, we found that with the increase of saline concentration, the blood loss gradually reduced, which proves the advantages of a combination of hypertonic saline. Interestingly, the SNT group that was not infused had the least amount of blood loss, so we explored the reason for this performance. As the study of Li found that with the increase in infusion volume, it may increase the total blood volume in the circulation and increase the speed and quantity of bleeding [34], and the reason for this performance in this study may also be the same. The results of the H&E staining of the heart, lung, kidney and liver are more helpful in demonstrating the advantages of combined hypertonic saline recovery. The degree of tissue destruction in the 7.5% and 4.5% groups was significantly lower than in the normal saline group. However, since this study focused on the tissue changes of rabbits in the early stage of UHS, and the degree of tissue destruction in the rabbits of each group was not serious, the difference in tissue section staining between the 7.5% and 4.5% groups was not significantly different.
The concentration exploration in this study was carried out against the backdrop of restrictive hypotensive resuscitation. A large number of animal experiments and some clinical experiments have confirmed that, for patients with UHS, restrictive hypotensive resuscitation is more effective than positive fluid resuscitation before complete hemostasis [16,35]. This study is also an experimental design using low-pressure resuscitation and low-dose infusion. And we found that on this basis combined with the hypertonic saline combination, the UHS model requires less infusion, which is consistent with the study by Helm et al. [36]. When in the rescue scene and battlefield situation, the 7.5% group required the least amount of fluid infusion, which was very beneficial to the field fluid allocation; therefore, the hypotensive resuscitation with hypertonic saline may be an optimal option for first aid and life-saving of the wounded in military activities. At present, there are no strict standards for the specific usage and mass fraction of hypertonic saline resuscitation, and no systematic and scientific scheme has been generated. This study has a guiding significance in this respect. Nevertheless, some limitations should be discussed. First, the UHS model was established with rabbits, which differs from the patients in the process of shock and resuscitation. It is difficult to simulate real uncontrolled bleeding at the battle site, therefore, the model needs to be further improved. Second, this study selected young, healthy rabbits to establish the model, possibly not reflecting the UHS status of older rabbits or those with cardiovascular disease (CVD). Third, the indicators of monitoring and observation are not sufficiently comprehensive. There was no physical analysis of the survival time, although the study focused on the physical histopathology of rabbit organs.
Conclusions
Fluid resuscitation is one of the most important measures for early treatment of hemorrhagic shock; it plays an important role in rescuing the wounded with hemorrhagic shock on the battlefield. This experiment proves that higher concentration (7.5%) of hypertonic saline with novel combinations of fluids shows better recovery effects on UHS rabbits in hypotensive conditions, possibly suggesting more effective recovery strategies for clinical first aid and advanced development of infusion equipment.
Footnotes
Source of support: Departmental sources
References
- 1.Larsson M, Forsman P, Hedenqvist P, et al. Extracorporeal membrane oxygenation improves coagulopathy in an experimental traumatic hemorrhagic model. Eur J Trauma Emerg Surg. 2017;43:701–9. doi: 10.1007/s00068-016-0730-1. [DOI] [PMC free article] [PubMed] [Google Scholar]
- 2.Ryan KL, Walter B. Cannon’s World War I experience: Treatment of traumatic shock then and now. Adv Physiol Educ. 2018;42:267–76. doi: 10.1152/advan.00187.2017. [DOI] [PubMed] [Google Scholar]
- 3.Frank A, Bonney M, Bonney S, et al. Myocardial ischemia reperfusion injury: From basic science to clinical bedside. Semin Cardiothorac Vasc Anesth. 2012;16:123–32. doi: 10.1177/1089253211436350. [DOI] [PMC free article] [PubMed] [Google Scholar]
- 4.Stern SA, Dronen SC, Birrer P, et al. Effect of blood pressure on hemorrhage volume and survival in a near-fatal hemorrhage model incorporating a vascular injury. Ann Emerg Med. 1993;22:155–63. doi: 10.1016/s0196-0644(05)80195-7. [DOI] [PubMed] [Google Scholar]
- 5.Yu Y, Gong S, Sheng C, et al. Increased survival with hypotensive resuscitation in a rabbit model of uncontrolled hemorrhagic shock in pregnancy. Resuscitation. 2009;80:1424–30. doi: 10.1016/j.resuscitation.2009.08.024. [DOI] [PubMed] [Google Scholar]
- 6.Stern SA, Zink BJ, Mertz M, et al. Effect of initially limited resuscitation in a combined model of fluid-percussion brain injury and severe uncontrolled hemorrhagic shock. J Neurosurg. 2000;93:305–14. doi: 10.3171/jns.2000.93.2.0305. [DOI] [PubMed] [Google Scholar]
- 7.Deniz T, Agalar C, Ozdogan M, et al. Mild hypothermia improves survival during hemorrhagic shock without affecting bacterial translocation. J Invest Surg. 2009;22:22–28. doi: 10.1080/08941930802566706. [DOI] [PubMed] [Google Scholar]
- 8.Kwan I, Bunn F, Chinnock P, et al. Timing and volume of fluid administration for patients with bleeding. Cochrane Database Syst Rev. 2014;3:D2245. doi: 10.1002/14651858.CD002245.pub2. [DOI] [PMC free article] [PubMed] [Google Scholar]
- 9.Mihara R, Takasu A, Maemura K, et al. Prolonged severe hemorrhagic shock at a mean arterial pressure of 40 mmHg does not lead to brain damage in rats. Acute Med Surg. 2018;5:350–57. doi: 10.1002/ams2.361. [DOI] [PMC free article] [PubMed] [Google Scholar]
- 10.Li T, Zhu Y, Hu Y, et al. Ideal permissive hypotension to resuscitate uncontrolled hemorrhagic shock and the tolerance time in rats. Anesthesiology. 2011;114:111–19. doi: 10.1097/ALN.0b013e3181fe3fe7. [DOI] [PubMed] [Google Scholar]
- 11.Carrick MM, Morrison CA, Tapia NM, et al. Intraoperative hypotensive resuscitation for patients undergoing laparotomy or thoracotomy for trauma: Early termination of a randomized prospective clinical trial. J Trauma Acute Care Surg. 2016;80:e886–96. doi: 10.1097/TA.0000000000001044. [DOI] [PubMed] [Google Scholar]
- 12.Carrick MM, Leonard J, Slone DS, et al. Hypotensive resuscitation among trauma patients. Biomed Res Int. 2016;2016 doi: 10.1155/2016/8901938. 8901938. [DOI] [PMC free article] [PubMed] [Google Scholar]
- 13.Zhang Y, Gao B, Wang J, et al. Effect of hypotensive resuscitation with a novel combination of fluids in a rabbit model of uncontrolled hemorrhagic shock. Plos One. 2013;8:e66916. doi: 10.1371/journal.pone.0066916. [DOI] [PMC free article] [PubMed] [Google Scholar]
- 14.Isayama K, Murao Y, Saito F, et al. Effects of hypertonic saline on CD4+CD25+Foxp3+ regulatory T cells after hemorrhagic shock in relation to iNOS and cytokines. J Surg Res. 2012;172:137–45. doi: 10.1016/j.jss.2010.07.042. [DOI] [PubMed] [Google Scholar]
- 15.Palmer L, Martin L. Traumatic coagulopathy – part 1: Pathophysiology and diagnosis. J Vet Emerg Crit Care (San Antonio) 2014;24:63–74. doi: 10.1111/vec.12130. [DOI] [PubMed] [Google Scholar]
- 16.Dias C, Silva MJ, Pereira E, et al. Post-traumatic multimodal brain monitoring: Response to hypertonic saline. J Neurotrauma. 2014;31:1872–80. doi: 10.1089/neu.2014.3376. [DOI] [PubMed] [Google Scholar]
- 17.Frithiof R, Ramchandra R, Hood SG, et al. Hypertonic sodium resuscitation after hemorrhage improves hemodynamic function by stimulating cardiac, but not renal, sympathetic nerve activity. Am J Physiol Heart Circ Physiol. 2011;300:H685–92. doi: 10.1152/ajpheart.00930.2010. [DOI] [PubMed] [Google Scholar]
- 18.Brewer LA, Lwamba HC, Murtaugh MP, et al. Porcine encephalomyocarditis virus persists in pig myocardium and infects human myocardial cells. J Virol. 2001;75:11621–29. doi: 10.1128/JVI.75.23.11621-11629.2001. [DOI] [PMC free article] [PubMed] [Google Scholar]
- 19.Killingsworth CR, Melnick SB, Litovsky SH, et al. Evaluation of acute cardiac and chest wall damage after shocks with a subcutaneous implantable cardioverter defibrillator in Swine. Pacing Clin Electrophysiol. 2013;36:1265–72. doi: 10.1111/pace.12173. [DOI] [PMC free article] [PubMed] [Google Scholar]
- 20.Yang FL, Subeq YM, Lee CJ, et al. Rosiglitazone protects against severe hemorrhagic shock-induced organ damage in rats. Med Sci Monit. 2011;17:BR282–89. doi: 10.12659/MSM.881975. [DOI] [PMC free article] [PubMed] [Google Scholar]
- 21.Lee CJ, Lee RP, Subeq YM, et al. Propofol protects against hemorrhagic shock-induced organ damage in conscious spontaneously hypertensive rats. Biol Res Nurs. 2009;11:152–62. doi: 10.1177/1099800409334750. [DOI] [PubMed] [Google Scholar]
- 22.Lee CC, Lee RP, Subeq YM, et al. Fluvastatin attenuates severe hemorrhagic shock-induced organ damage in rats. Resuscitation. 2009;80:372–78. doi: 10.1016/j.resuscitation.2008.12.003. [DOI] [PubMed] [Google Scholar]
- 23.Zink BJ, Stern SA, McBeth BD, et al. Effects of, ethanol on limited resuscitation in a model of traumatic brain injury and hemorrhagic shock. J Neurosurg. 2006;105:884–93. doi: 10.3171/jns.2006.105.6.884. [DOI] [PubMed] [Google Scholar]
- 24.Redl H, Schlag G, Bahrami S. Animal models of sepsis and shock: A review and lessons learned. Edwin A Deitch. Shock. 1998;10:442–45. [PubMed] [Google Scholar]
- 25.Hauser CJ. Preclinical models of traumatic, hemorrhagic shock. Shock. 2005;24(Suppl 1):24–32. doi: 10.1097/01.shk.0000191387.18818.43. [DOI] [PubMed] [Google Scholar]
- 26.Nunes RB, Alves JP, Kessler LP, et al. Interval and continuous exercise enhances aerobic capacity and hemodynamic function in CHF rats. Braz J Phys Ther. 2015;19:257–63. doi: 10.1590/bjpt-rbf.2014.0098. [DOI] [PMC free article] [PubMed] [Google Scholar]
- 27.Sondeen JL, Gonzaludo GA, Loveday JA, et al. Hypertonic saline/dextran improves renal function after hemorrhage in conscious swine. Resuscitation. 1990;20:231–41. doi: 10.1016/0300-9572(90)90006-z. [DOI] [PubMed] [Google Scholar]
- 28.McCord JM. Oxygen-derived free radicals in post-ischemic tissue injury. N Engl J Med. 1985;312:159–63. doi: 10.1056/NEJM198501173120305. [DOI] [PubMed] [Google Scholar]
- 29.Li D, Ai Y. Hydrogen saline suppresses neuronal cell apoptosis and inhibits the p38 mitogenactivated protein kinasecaspase3 signaling pathway following cerebral ischemia reperfusion injury. Mol Med Rep. 2017;16:5321–25. doi: 10.3892/mmr.2017.7294. [DOI] [PMC free article] [PubMed] [Google Scholar]
- 30.Ribeiro RJ, Couteiro RP, Monteiro AM, et al. Perconditioning associated to hypertonic saline solution on liver function improvement after ischemia/reperfusion injury. Acta Cir Bras. 2017;32:949–55. doi: 10.1590/s0102-865020170110000006. [DOI] [PubMed] [Google Scholar]
- 31.Kreimeier U, Messmer K. [Use of hypertonic NaCl solutions in primary volume therapy]. Zentralbl Chir. 1992;117:532–39. [in German] [PubMed] [Google Scholar]
- 32.Brito MV, Yasojima EY, Percario S, et al. Effects of hypertonic saline solution associated to remote ischemic perconditioning in kidney ischemia/reperfusion injury in rats. Acta Cir Bras. 2017;32:211–18. doi: 10.1590/S0102-865020170030000005. [DOI] [PubMed] [Google Scholar]
- 33.Wu MC, Liao TY, Lee EM, et al. Administration of hypertonic solutions for hemorrhagic shock: A systematic review and meta-analysis of clinical trials. Anesth Analg. 2017;125:1549–57. doi: 10.1213/ANE.0000000000002451. [DOI] [PubMed] [Google Scholar]
- 34.Li T, Fang Y, Zhu Y, et al. A small dose of arginine vasopressin in combination with norepinephrine is a good early treatment for uncontrolled hemorrhagic shock after hemostasis. J Surg Res. 2011;169:76–84. doi: 10.1016/j.jss.2010.02.001. [DOI] [PubMed] [Google Scholar]
- 35.Meybohm P, Cavus E, Bein B, et al. Small volume resuscitation: A randomized controlled trial with either norepinephrine or vasopressin during severe hemorrhage. J Trauma. 2007;62:640–46. doi: 10.1097/01.ta.0000240962.62319.c8. [DOI] [PubMed] [Google Scholar]
- 36.Helm M, Hauke J, Kohler J, et al. Das Konzept der „small volume resuscitation“ im Rahmen des präklinischen Traumamanagements. Der Unfallchirurg. 2013;116:326–31. doi: 10.1007/s00113-011-2096-5. [in German] [DOI] [PubMed] [Google Scholar]