

Abstract
Objective
To examine associations between dietary intake of omega‐3 (n‐3; generally antiinflammatory) and omega‐6 (n‐6; generally proinflammatory) fatty acids and patient‐reported outcomes in systemic lupus erythematosus (SLE).
Methods
This study was based on the population‐based Michigan Lupus Epidemiology and Surveillance cohort. Estimates of n‐3 and n‐6 intake were derived from Diet History Questionnaire II items (past year with portion size version). Patient‐reported outcomes included self‐reported lupus activity (Systemic Lupus Activity Questionnaire [SLAQ]). Multivariable regression, adjusted for age, sex, race, and body mass index, was used to assess associations between absolute intake of n‐3 and n‐6, as well as the n‐6:n‐3 ratio, and patient‐reported outcomes.
Results
Among 456 SLE cases, 425 (93.2%) were female, 207 (45.4%) were African American, and the mean ± SD age was 52.9 ± 12.3 years. Controlling for potential confounders, the average SLAQ score was significantly higher by 0.3 points (95% confidence interval [95% CI] 0.1, 0.6; P = 0.013) with each unit increase of the n‐6:n‐3 ratio. Both lupus activity and Patient‐Reported Outcomes Measurement Information System (PROMIS) sleep disturbance scores were lower with each 1‐gram/1,000 kcal increase of n‐3 fatty acids (SLAQ regression coefficient β = –0.8 [95% CI –1.6, 0.0]; P = 0.055; PROMIS sleep β = –1.1 [95% CI –2.0, –0.2]; P = 0.017). Higher n‐3 intakes were nonsignificantly associated with lower levels of depressive symptoms and comorbid fibromyalgia, and with higher quality of life, whereas results for the n6:n3 ratio trended in the opposite direction.
Conclusion
This population‐based study suggests that higher dietary intake of n‐3 fatty acids and lower n‐6:n‐3 ratios are favorably associated with patient‐reported outcomes in SLE, particularly self‐reported lupus activity and sleep quality.
INTRODUCTION
Systemic lupus erythematosus (SLE) is one of a number of rheumatic and musculoskeletal diseases 1 and is associated with substantial comorbidities, including renal impairment and premature cardiovascular disease 2, 3. In general, advances in diagnosis and management have led to improved outcomes for patients with SLE 4. However, fatigue, poor sleep, chronic and often widespread pain, depression, and diminished quality of life remain challenging and prevalent issues for patients with SLE. As many as 85% of patients with SLE report significant levels of persistent fatigue 5, 57% ongoing issues with sleep 6, 75% depressive disorders 7, and >20% chronic pain pervasive enough to meet criteria for comorbid fibromyalgia 8. Nonpharmacologic interventions that address these persistent symptoms could have a significant impact on quality of life for patients with SLE. Modification of dietary polyunsaturated fatty acid (PUFA) intake could be one such approach.
SIGNIFICANCE & INNOVATIONS.
This is the first study to show that lower dietary intake levels of omega‐6 (proinflammatory) fatty acids and higher dietary intake levels of omega‐3 (antiinflammatory) fatty acids are favorably associated with patient‐reported outcomes in lupus, including decreased lupus activity and better sleep quality.
The finding that dietary intake levels of omega‐6 and omega‐3 fatty acids appeared to oppose one another, including after adjustment for omega‐3 supplement use (fish and/or flaxseed oil), suggests that use of supplements alone might be less likely than a broader dietary approach to influence patient‐reported outcomes in lupus.
This study should prompt health care providers to consider reviewing the US Department of Agriculture 2015–2020 Dietary Guidelines for Americans with their patients with SLE to promote intake of fatty fish, nuts, and seeds, thereby encouraging a better balance of fatty acids from dietary sources.
Omega‐3 (n‐3) PUFA, found in fatty fish, nuts, seeds, and oils, and consumed at relatively low levels in the US diet, have been found to have antiinflammatory and immunomodulatory effects 9, 10. In contrast, omega‐6 (n‐6) PUFA, including linoleic acid and arachidonic acid, are generally considered proinflammatory 9, 10 and are ubiquitous in the US food supply (e.g., corn and soybean oils) 11. Due to the uneven distribution of n‐6 and n‐3 fatty acids in the food supply, the ratio of n‐6:n‐3 consumption in the US is as high as 15:1 11. The substantially higher intake of n‐6 fatty acids is thought to adversely impact health; products derived from n‐6 fatty acids include inflammatory eicosanoids (i.e., prostaglandin E2), as compared to eicosanoids derived from n‐3s, which are considered antiinflammatory substances (i.e., prostaglandin E3) 10, 11, 12. Because n‐6 and n‐3 compete for the same desaturation and elongation enzymes 13, both high absolute levels of n‐6 consumption, as well as high ratios of n‐6 relative to n‐3, may contribute to a systemic proinflammatory state and immune dysfunction 13, 14, 15. Studies in lupus‐prone mouse models have reported favorable effects associated with n‐3 fatty acid consumption, including reduced levels of autoantibodies, proteinuria, and glomerulonephritis, as well as down‐regulation of relevant CD4+ T cell–associated genes 16. An intriguing study found that dietary enrichment with the n‐3 fatty acid docosahexaenoic acid (DHA) in lupus‐prone NZBWF1 mice suppressed crystalline silica–induced autoimmunity in a dose‐response fashion, including inhibition of proinflammatory cytokines and reduced glomerulonephritis 17. However, precise mechanisms concerning PUFA‐related immunomodulation and lupus outcomes require further elucidation.
Four human studies of n‐3 supplementation have reported improved lupus disease activity compared to placebo groups 18, 19, 20, 21, while others have detected no differences 22, 23, 24. One of the clinical trials examined the impact of n‐3 supplementation on quality of life and common symptoms such as pain and fatigue in SLE and found trends toward improvement 21. However, studies in SLE have focused primarily on n‐3 supplementation, not dietary intake of fatty acids. In contrast to trials of individual supplements, measures of routine dietary intake allow for more comprehensive profiling of nutrient exposures (including n‐6 fatty acids and the n‐6:n‐3 ratio) and may reflect more stable or habitual patterns of exposure over time.
We performed a cross‐sectional study within the population‐based Michigan Lupus Epidemiology and Surveillance (MILES) cohort, to assess the association between dietary intake of n‐3 and n‐6 fatty acids and their ratio on patient‐reported outcomes of SLE disease activity, quality of life, fatigue, pain, depression, and sleep. We anticipated that higher dietary intakes of n‐3 fatty acids and lower ratios of n‐6:n‐3 would be associated with more favorable patient‐reported outcomes.
PATIENTS AND METHODS
Study population
This study was based on data from the MILES cohort, a population‐based cohort of individuals with SLE from southeastern Michigan. Ethics approval was obtained from the institutional review boards of the University of Michigan and the Michigan Department of Health and Human Services, and cohort participants signed written, informed consent. Lupus cases for the MILES cohort were recruited from the MILES Surveillance Registry, one of the National US Lupus Registries supported by the Centers for Disease Control and Prevention and described elsewhere 2, 25. Briefly, the MILES registry included individuals who were residents of Wayne or Washtenaw counties in Michigan (which encompass a source population of approximately 2.4 million and include the cities of Detroit and Ann Arbor) during 2002–2005, and with a new or existing diagnosis of SLE during this calendar period. Baseline enrollment for the MILES cohort was conducted between February 2014 and September 2015.
Baseline characteristic variables
Sociodemographic variables (e.g., race, ethnicity) were based on self‐report. Height and weight were measured at the research clinic visit, and body mass index (BMI) was computed as weight divided by height squared (kg/m2).
Dietary assessment and omega fatty acid variables
Dietary intake was assessed using an abbreviated version of the Diet History Questionnaire II (DHQ II; past year version, with portion size) by the National Cancer Institute Epidemiology and Genomic Research Program, that focused on fatty foods (see Supplementary Table 1, available on the Arthritis Care & Research web site at http://onlinelibrary.wiley.com/doi/10.1002/acr.23925/abstract) 26. Diet*Calc software, version 1.5.0 27, was used to link dietary data to nutrient databases from the US Department of Agriculture (USDA) (for n‐6) and the Nutrition Data System for Research (NDSR) (for n‐3) for generation of nutrient intake estimates 28. The Diet*Calc/NDSR n‐3 fatty acid variable represented the sum of the following fatty acids: alpha‐linolenic acid (18:3n‐3), parinaric acid (18:4n‐3), eicosapentaenoic acid (EPA; 20:5n‐3), docosapentaenoic acid (22:5n‐3), and DHA (22:6n‐3) 29. Omega‐6 was calculated as total octadecadienoic acid or linoleic acid (18:2n‐6).
Total n‐3 and n‐6 were adjusted for fat calorie intake (per 1,000 kcal) to remove extraneous variation and control for confounding 30. The fat energy–adjusted n‐3 and n‐6 variables were used as independent variables in the multivariable models and to compute the n‐6:n‐3 ratio. While the dietary assessment did not include quantification of supplement use, omega‐3 supplements (fish oil and flaxseed oil) were recorded as yes/no if used more than once per week. Thus, in secondary models, we included omega‐3 supplement use as a binary covariate.
Patient‐reported outcomes measures
Detailed sociodemographic and patient‐reported outcome data were collected at baseline and included the measures described below. The Systemic Lupus Activity Questionnaire (SLAQ) 31 was used to assess SLE disease activity. The SLAQ is a self‐administered tool developed for epidemiologic studies and is not intended for clinical management. It includes 24 symptom questions and a numerical rating scale assessing disease activity during the past 3 months. The SLAQ yields scores ranging from 0 to 47, with higher scores indicating greater disease activity.
The Survey Criteria for Fibromyalgia (FM Scale) 32 was used to assess the presence of fibromyalgia/widespread pain. The FM Scale consists of the widespread pain index that provides a count of the number of body regions reported as painful by the patient (range 0–19) and the symptom severity scale that assesses fatigue, nonrefreshing sleep, cognitive problems, and the extent of somatic symptoms (range 0–12). Based on the FM Scale, participants were classified as fulfilling criteria for fibromyalgia if the following were met: widespread pain index ≥7 and symptom severity ≥5, or widespread pain index of 3–6 and symptom severity ≥9; and with symptoms present at a similar level for at least 3 months in the absence of a disorder that would otherwise explain the pain.
The Patient‐Reported Outcomes Measurement Information System (PROMIS) depression short form, version 1.0, is an 8‐item measure used to assess self‐reported negative mood, views of self, and social cognition, as well as positive affect and engagement. Scores can range from 37.1 to 81.1, with higher scores representing worse depressive symptoms 33. The PROMIS sleep disturbance short form, version 1.0, is an 8‐item measure used to assess perception of sleep quality, which includes sleep depth and restoration associated with sleep. Scores range from 28.9 to 76.5, with higher scores representing worse sleep disturbance 34.
The RAND Medical Outcomes Study Short Form 36 (SF‐36) instrument 35 was used to measure health‐related quality of life (HRQoL). It is a self‐report questionnaire consisting of 36 items aggregated to score 8 subscales related to physical and mental health. Subscales include physical functioning, role physical, bodily pain, general health, energy/fatigue, social function, role emotional, and mental health. The subscale scores are normalized for a mean of 50 with an SD of 10; higher scores indicate better HRQoL.
The Lupus Quality of Life Questionnaire (LQoL) 36 was used to assess disease‐specific quality of life. The LQoL is a 34‐item scale, and scores are aggregated into 8 subscales including physical health, emotional health, body image, pain, planning, fatigue, intimate relationships, and burden to others. Scores range from 0 to 100, with higher scores indicating better HRQoL.
Statistical analysis
Descriptive statistics were computed, with mean ± SD for continuous variables, and frequency and percentage for categorical variables. Univariate logistic or linear regression were performed for dichotomous and continuous outcomes, respectively, to examine the associations between fat energy–adjusted fatty acid intake (n‐3, n‐6, and the ratio of n‐6:n‐3) and patient‐reported outcomes. Outcomes for linear regression models were normally distributed. Separate models were constructed for each patient‐reported outcome. Multivariable models were adjusted for covariates determined a priori to be relevant to the exposures and outcomes based on prior research (age, sex, race, and BMI in primary models; secondary models also included n‐3 supplement use) 37, 38, 39, 40. Effect estimates from the multivariable logistic models (odds ratios [ORs]) and linear regression models (beta coefficients, mean outcome changes associated with 1‐unit change of the covariate) with 95% confidence intervals (95% CIs) are shown. Electronic data capture and management used the REDCap tools hosted at the University of Michigan 41. Statistical analysis was conducted using SPSS Statistics software, version 23, and Stata software, version 14.
RESULTS
At the baseline visit, 462 lupus cases were enrolled, of whom 456 completed the dietary questionnaire and were included in this study. Characteristics of the study population are shown in Table 1. Over 93% of the participants were female, average age was 53 years, and self‐identified race was primarily white (52%) or African American (45%).
Table 1.
Baseline characteristics and patient‐reported outcome scores among patients with systemic lupus erythematosus (n = 456)a
| Characteristic | Value |
|---|---|
| Age, mean ± SD years | 52.9 ± 12.3 |
| Female, no. (%) | 425 (93.2) |
| Race, no. (%) | |
| White | 235 (51.5) |
| African American | 207 (45.4) |
| Asian | 4 (0.9) |
| Other/unspecified | 10 (2.2) |
| Hispanic ethnicity, no. (%) | 17 (3.7) |
| Body mass index, mean ± SD kg/m2 | 30.0 ± 8.0 |
| Fat energy intake, mean ± SD kcal | 131.0 ± 151.4 |
| Dietary n‐3 intake, grams/1,000 kcal | 3.1 ± 0.9 (0.7–7.2) |
| Dietary n‐6 intake, grams/1,000 kcal | 20.1 ± 7.5 (5.0–36.7) |
| Flaxseed and/or fish oil supplement use, no. (%) | 112 (26.8) |
| Patient‐reported outcomes | |
| SLAQ | 13.0 ± 8.0 (0–38) |
| FM Scale positive, no. (%) | 188 (41.2) |
| PROMIS depression | 51.8 ± 9.9 (37.1–81.1) |
| PROMIS sleep disturbance | 56.5 ± 8.8 (28.9–76.5) |
| SF‐36 subscales | |
| Physical functioning | 56.2 ± 30.2 (0–100) |
| Role functioning/physical | 41. 8 ± 42.5 (0–100) |
| Role functioning/emotional | 58.1 ± 43.5 (0–100) |
| Energy/fatigue | 39.8 ± 21.9 (0–100) |
| Emotional/well‐being | 69.5 ± 19.2 (4–100) |
| Social functioning | 64.3 ± 29.0 (0–100) |
| Pain | 51.8 ± 27.0 (0–100) |
| General health | 42.1 ± 23.8 (0–100) |
| LupusQoL domains | |
| Physical health | 65.0 ± 27.3 (0–100) |
| Pain | 63.7 ± 28.6 (0–100) |
| Planning | 74.4 ± 28.3 (0–100) |
| Intimate relationships | 70.7 ± 33.7 (0–100) |
| Burden to others | 65.5 ± 31.9 (0–100) |
| Emotional health | 80.7 ± 20.0 (8.3–100) |
| Body image | 74.8 ± 24.6 (0–100) |
| Fatigue | 61.6 ± 26.5 (0–100) |
Values are the mean ± SD (range) unless indicated otherwise. Sample sizes for variables with >1% missing: LQoL intimate relationships (n = 392); LQoL body image (n = 402). SLAQ = Systemic Lupus Activity Questionnaire; FM Scale = Survey Criteria for Fibromyalgia; PROMIS = Patient‐Reported Outcome Measurement Information System; SF‐36 = 36‐item Short‐Form survey instrument; LupusQoL = Lupus Quality of Life Questionnaire.
PUFA intake
The fat energy–adjusted dietary intake of n‐3 was mean ± SD 3.1 ± 0.9 grams/1,000 kcal (range 0.7–7.2). The mean n‐6 intake was mean ± SD 20.1 ± 7.5 grams/1,000 kcal (range 5.0–36.7). The mean ± SD n‐6:n‐3 ratio was 6.9 ± 2.9, with ratios ranging from 1.2 to 18.0. Use of flaxseed and/or fish oil supplements was reported in 112 of 456 (26.8%) of the participants.
PUFA intake and patient‐reported outcomes
Estimated associations between PUFA intake and patient‐reported outcomes from the primary models are shown in forest plots (Figures 1, 2, 3, 4). These models were adjusted for sex, age, race, and BMI. Self‐reported lupus disease activity was significantly associated with PUFA intake (Figure 1); for each unit increase in the ratio of n‐6:n‐3, the mean SLAQ score was correspondingly higher by 0.3 points (95% CI 0.1, 0.6; P = 0.013). Furthermore, an association between greater absolute n‐3 intake and reduced SLE activity bordered on significance, where for each unit increase of n‐3 intake, the SLAQ score was lower by 0.8 points (regression coefficient β = –0.8 [95% CI –1.6, 0.0]; P = 0.055). Cut points for clinically meaningful changes on the SLAQ have not been defined, but as a patient‐reported outcome measure, scores represent activity perceptible to the patient and thus potentially meaningful from the patient perspective.
Figure 1.
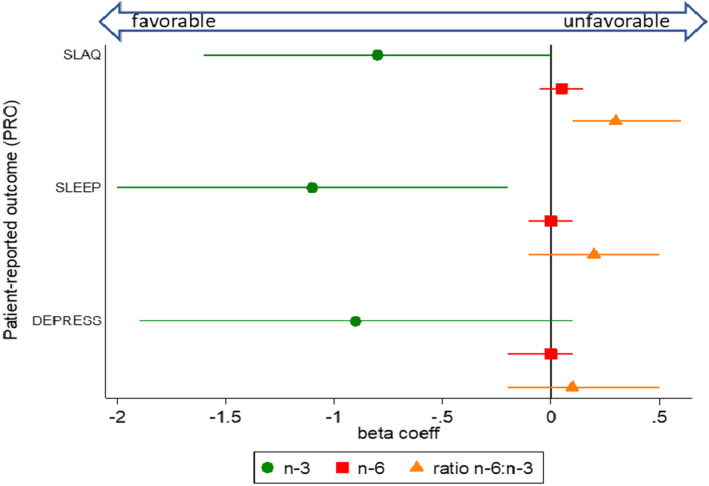
Associations between dietary polyunsaturated fatty acid intake (n‐3, n‐6, and ratio n‐6:n‐3) and patient‐reported outcome measures for lupus activity (Systemic Lupus Activity Questionnaire [SLAQ]), sleep quality (Patient‐Reported Outcomes Measurement Information System [PROMIS] sleep disturbance), and depression (PROMIS depression), from separate multivariable models. The circle, square, and triangle markers indicate regression (beta) coefficients, which represent mean outcome changes associated with each 1‐unit increase of the respective polyunsaturated fatty acid variable; horizontal lines indicate 95% confidence intervals. Lower scores for the SLAQ and PROMIS measures indicate better outcomes (coefficients below 0 indicate favorable associations, and above 0 indicate unfavorable associations). The n‐3 and n‐6 fatty acid variables were fat energy–adjusted (grams/1,000 kcal). Multivariable models were adjusted for the covariates sex, age, race, and body mass index. coeff = coefficient.
Figure 2.
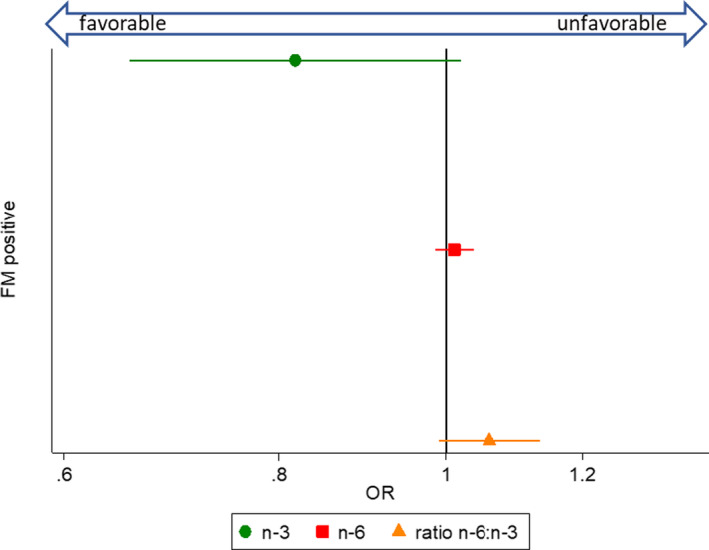
Associations between dietary fatty acid intake (n‐3, n‐6, and ratio n‐6:n‐3) and fulfillment of fibromyalgia (FM) survey criteria, from separate multivariable models. The circle, square, and triangle markers designate odd ratios (ORs), and horizontal lines indicate 95% confidence intervals. ORs below 1 indicate favorable associations, and above 1 indicate unfavorable associations. The n‐3 and n‐6 fatty acid variables were fat energy–adjusted (grams/1,000 kcal). Multivariable models were adjusted for the covariates sex, age, race, and body mass index.
Figure 3.
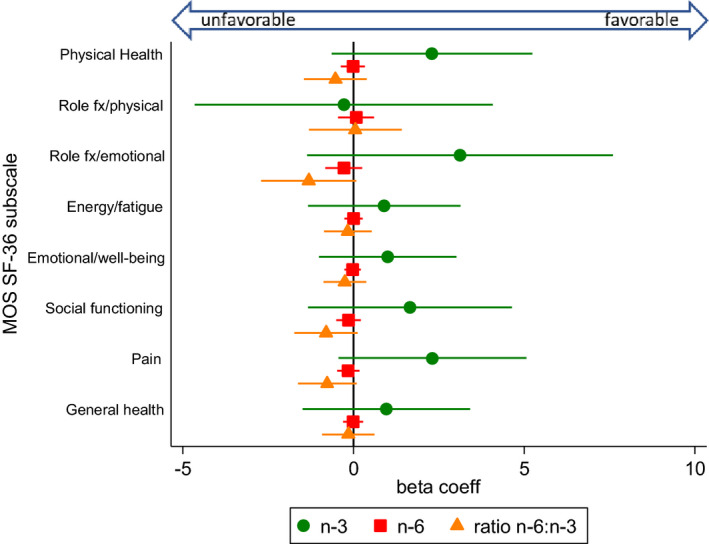
Associations between dietary fatty acid intake (n‐3, n‐6, and ratio n‐6:n‐3) and health related quality of life, measured by the Medical Outcomes Study Short Form 36 (MOS SF‐36), from separate multivariable models. The circle, square, and triangle markers indicate regression (beta) coefficients, which represent mean outcome changes associated with each 1‐unit increase of the respective polyunsaturated fatty acid variable; horizontal lines indicate 95% confidence intervals. Higher scores indicate better health‐related quality of life. The n‐3 and n‐6 fatty acid variables were fat energy–adjusted (grams/1,000 kcal). Multivariable models were adjusted for the covariates sex, age, race, and body mass index. fx = functioning; coeff = coefficient.
Figure 4.
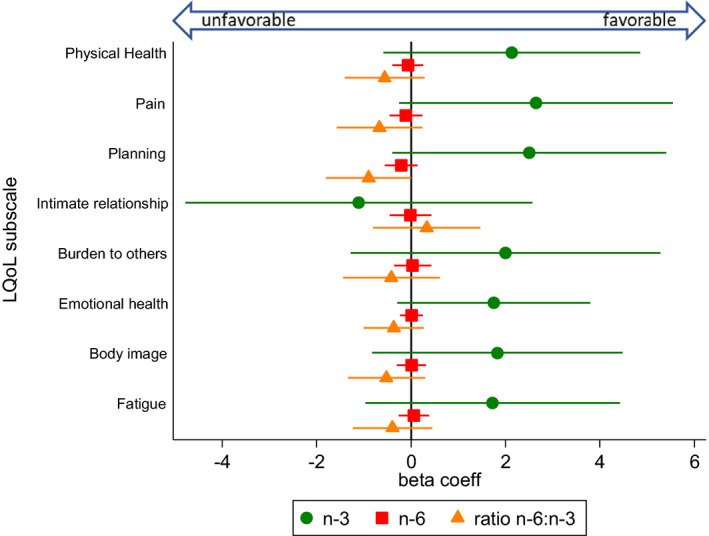
Associations between dietary fatty acid intake (n‐3, n‐6, and ratio n‐6:n‐3) and lupus‐specific quality of life, measured by the Lupus Quality of Life Questionnaire (LQoL), from separate multivariable models. The circle, square, and triangle markers indicate regression (beta) coefficients, which represent mean outcome changes associated with each 1‐unit increase of the respective polyunsaturated fatty acid variable; horizontal lines indicate 95% confidence intervals. Higher scores indicate better health‐related quality of life. The n‐3 and n‐6 fatty acid variables were fat energy–adjusted (grams/1,000 kcal). Multivariable models were adjusted for the covariates sex, age, race, and body mass index. coeff = coefficient.
Perceived sleep quality (Figure 1) was also significantly associated with PUFA intake, whereby each unit increase of n‐3 intake was associated with a lower mean PROMIS sleep disturbance score by –1.1 points (95% CI –2.0, –0.2; P = 0.017). However, the ratio of n6:n3 was not significantly associated with sleep disturbance (β = 0.2 [95% CI –0.1, 0.5]; P = 0.111). We did not detect significant associations for depression and PUFA intake (Figure 1) (n‐3 β = –0.9 [95% CI –1.9, 0.1]; P = 0.093; ratio n6:n3 β = 0.1 [95% CI –0.2, 0.5]; P = 0.369).
We assessed 3 dimensions of pain: fibromyalgia/widespread pain as a dichotomous measure representing fulfillment of the FM Scale (Figure 2), the continuous pain subscales of the SF‐36 (Figure 3), and the LQoL (Figure 4). There were not significant associations between PUFAs and the 3 pain measures. However, there was an inverse association between n‐3 intake and comorbid FM that bordered on significance, such that with each unit increase of n‐3 intake, fulfillment of FM survey criteria was approximately 20% lower (OR 0.82 [95% CI 0.66, 1.02]; P = 0.07).
For general and disease‐specific quality of life measures (SF‐36 and LQoL, respectively) (Figures 3 and 4), significant associations were not detected for any of the PUFA measures. However, a general trend was observed for the majority of subscales (14 of 16), whereby higher n‐3 intakes were associated with higher subscale scores, higher ratios of n‐6:n‐3 were negatively associated, and absolute n‐6 intake remained around a null association. For the SF‐36, subscale scores that deviate from the mean of 50 by 1 SD (SD = 10) are generally thought to be clinically relevant. PROMIS measures similarly are standardized with a mean of 50.
Secondary models were constructed including n‐3 supplement use (flaxseed and/or fish oil), in addition to the other covariates from the main models (see Supplementary Table 2, available on the Arthritis Care & Research web site at http://onlinelibrary.wiley.com/doi/10.1002/acr.23925/abstract). There were no substantive changes to results. However, the association between absolute n‐3 intake and reduced SLE activity, which bordered on significance in the main model, now reached significance (β = –0.8 [95% CI –1.7, 0.0]; P = 0.049).
DISCUSSION
In this population‐based, cross‐sectional study, lower ratios of n‐6 (proinflammatory) to n‐3 (antiinflammatory) fatty acids and higher levels of n‐3 fatty acid intake were significantly associated with improved self‐reported lupus disease activity. Higher levels of n‐3 intake were also significantly associated with better perceived sleep quality. Absolute intake levels of n‐6 fatty acids, without accounting for n‐3 fatty acid intake, were not independently associated with any of the patient‐reported outcomes.
Across the remaining outcomes of depression, fibromyalgia, pain, and HRQoL, although results did not reach statistical significance, the direction and magnitudes of association were generally consistent, in that increased n‐3 intake and decreased ratios of n‐6:n‐3 appeared favorable, whereas n‐6 intake alone hovered around a null association.
Our findings of associations between PUFA intake and patient‐reported SLE disease activity are consistent with some prior studies in patients with SLE. A cross‐sectional study of patients with SLE found that adipose tissue levels of EPA and DHA were negatively correlated with disease activity 42. A 4‐month open‐label trial of fish oil supplementation (3 grams/day) 20, as well as 3 approximately 6‐month trials of fish oil supplementation (3–4.5 mg/day) versus olive oil placebo, found decreases in SLE activity 18, 19, 21. However, a 12‐week trial of fish oil (3 grams/day) versus corn starch placebo 22 and 2 small trials (one in pediatric lupus, the other in lupus nephritis) failed to detect improvement in lupus activity 23, 24. With the positive trials having intervention periods of approximately 4–6 months, shorter interventions may be insufficient to impact lupus activity. Notably, supplement trials are not directly comparable to studies of dietary intake, and n‐3 doses in clinical trials often exceed dietary intake levels (the average n‐3 dietary intake in our lupus population was 0.42 grams/day, unadjusted for energy intake).
In terms of HRQoL, one of the above referenced trials in SLE found that none of the SF‐36 subscales was significantly improved after 6 months of fish oil supplementation compared to placebo, though there were nonsignificant trends of improvement in the energy/fatigue and emotional well‐being subscales in the fish oil group compared to placebo group 21. We likewise observed nonsignificant associations of benefit in these domains.
Our finding of a small but significant association between n‐3 intake and sleep quality is compatible with findings from a study from coastal Ecuador, in which higher DHA blood levels and oily fish consumption were significantly associated with improved sleep quality 43. Another study in which male forensic patients were randomized to consumption of fatty fish versus meat 3 times per week for 6 months found significantly improved sleep and daily functioning in the fish group 44. Further, n‐3 levels in red blood cells have been found to be inversely associated with obstructive sleep apnea severity 45. Although the mechanisms of how n‐3 fatty acids impact sleep quality are unclear, 43 such effects might be due to the role that n‐3s, particularly EPA and DHA, play in increasing serotonin secretion 46; low serotonin levels result in sleep disruption and sleep disorders, including insomnia.
There are several limitations in our study. First, the abbreviated dietary questionnaire that we used mainly captured PUFA intake from cooking oil, seafood, beans and eggs, which could underestimate absolute PUFA intake. Although cooking oils and marine products are the main dietary sources of n‐3 and n‐6, we were unable to capture data on PUFA intake from other sources such as leafy greens, nuts, seeds, and meat. Quantification of n‐3 supplement use was not possible given the yes/no format for supplements in the dietary questionnaire; however, we included n‐3 supplement use as a binary variable in secondary models. Thus, we likely underestimated both n‐3 and n‐6, though underestimation of n‐6 was more likely given its greater presence in the food supply. The average n‐6:n‐3 ratio in our study population (roughly 7:1) is lower than that expected from the standard American diet (up to 15:1) 11. In comparison, a larger cohort study in Detroit, Michigan of colorectal cancer cases and controls that used a food frequency questionnaire assessing the entire diet found the ratio of n‐6:n‐3 to be approximately 10:1 47; while this result is higher than the ratio in our lupus population from the same region, it is still lower than typically reported for the US population. There is some evidence for a downward shift of n‐6:n‐3 in recent years due to increased use of canola oil (which is n‐3 rich) in the American food supply 9.
A second limitation is that the brief dietary questionnaire limited us from calculating a global measure of diet quality, or from estimating total energy intake from all the food groups that can be used for energy adjustment. The energy adjustment from only fat intake might overestimate the energy‐adjusted absolute amount of PUFAs. Dietary questionnaires are also subject to recall bias and are less quantitative than biomarker measurements. However, a strength of dietary questionnaires is that they cover average intake over preceding months and not exposure at a single time point. Another limitation was that our outcome measure for lupus activity (SLAQ) was based on self‐report. While this tool has been validated for epidemiologic research and is a preferred tool for self‐reported lupus activity measurement, tools that incorporate rheumatologist assessment and laboratory findings are the gold‐standard for use in a clinical setting.
Unfortunately, the clinician‐centric tools are rarely feasible in epidemiologic field research. In addition, while we adjusted for potential confounders in multivariable models, unrecognized confounders may not have been accounted for, which would result in residual confounding. Finally, the cross‐sectional nature of our study did not allow for exploration of temporality or causal effects of variations in PUFA intake on disease outcomes.
Future research should focus on examination of PUFA intake from all dietary sources and supplements and should also incorporate objective measurement of PUFAs in blood. More refined PUFA measurement would increase the accuracy and precision of estimated relationships between PUFA and outcomes in SLE. Randomized clinical trials of n‐3 rich diets are also warranted to assess causality.
In the absence of dietary trials manipulating PUFA levels in SLE, review of the USDA 2015–2020 Dietary Guidelines for Americans might be considered as part of patient education. These guidelines recommend that adults eat at least 8 ounces of seafood per week, with a target intake of at least 250 mg per day of the omega‐3 fatty acids EPA and DHA. However, awareness of seafood advisories and US Food and Drug Administration/Environmental Protection Agency advice on the best seafood choices should be included 48, so that species most likely to be contaminated with toxicants such as mercury can be avoided. While the seafood guidelines are targeted to children and women of reproductive age, they may also be of particular relevance to lupus and autoimmune populations, because even low‐levels of methylmercury exposure (for which the primary route of exposure is ingestion of contaminated seafood) have been associated with autoantibody positivity 49. Species of fish high in omega‐3 and low in mercury include salmon and sardines. The USDA Dietary Guidelines also recommend consuming 1 oz per day (approximately one‐fourth cup) of nuts and seeds, with particular emphasis on those high in n‐3s, such as flaxseeds, walnuts, and chia seeds, and shifting to canola oil in cooking 50. Adherence to the above guidelines would be expected to favorably shift personal n‐6:n‐3 ratios.
In conclusion, lower ratios of n‐6:n‐3 and higher absolute levels of n‐3 fatty acids in the diet of individuals with SLE were significantly associated with lower self‐reported lupus disease activity scores and with better sleep quality, and trended toward favorable associations with a range of patient‐reported outcomes of clinical importance in SLE, including pain, depression, and quality of life. Given that treatment of lupus frequently requires multiple pharmacologic agents, a nonpharmacologic intervention that could target various comorbidities is a particularly attractive prospect. Future studies are needed to help elucidate the mechanisms by which PUFAs impact outcomes in lupus, and to assess whether dietary manipulation of PUFAs can translate into clinically meaningful disease control. In the meantime, nutritional education on omega‐3 rich seafood (low‐mercury species), nuts, seeds, and seed oils may be beneficial for SLE patients.
AUTHOR CONTRIBUTIONS
All authors were involved in drafting the article or revising it critically for important intellectual content, and all authors approved the final version to be submitted for publication. Dr. Somers had full access to all of the data in the study and takes responsibility for the integrity of the data and the accuracy of the data analysis.
Study conception and design
Charoenwoodhipong, Harlow, Hassett, Wang, Mancuso, Somers, Zick.
Acquisition of data
Charoenwoodhipong, Harlow, Marder, McCune, Somers, Zick.
Analysis and interpretation of data
Charoenwoodhipong, Harlow, Hassett, Gordon, Helmick, Barbour, Wang, Mancuso, Somers, Zick.
Supporting information
ACKNOWLEDGMENT
The authors thank the Michigan Department of Health and Human Services for their expertise during the development of the MILES Program.
Dr. Somers and Ms Zick contributed equally to this article.
No potential conflicts of interest relevant to this article were reported.
REFERENCES
- 1. Van der Heijde D, Daikh DI, Betteridge N, Burmester GR, Hassett AL, Matteson EL, et al. Common language description of the term rheumatic and musculoskeletal diseases (RMDs) for use in communication with the lay public, healthcare providers, and other stakeholders endorsed by the European League Against Rheumatism (EULAR) and the American College of Rheumatology (ACR). Arthritis Rheumatol 2018;70:826–31. [DOI] [PubMed] [Google Scholar]
- 2. Somers EC, Marder W, Cagnoli P, Lewis EE, DeGuire P, Gordon C, et al. Population‐based incidence and prevalence of systemic lupus erythematosus: the Michigan lupus epidemiology and surveillance program. Arthritis Rheumatol 2014;66:369–78. [DOI] [PMC free article] [PubMed] [Google Scholar]
- 3. Somers EC, Zhao W, Lewis EE, Wang L, Wing JJ, Sundaram B, et al. Type I interferons are associated with subclinical markers of cardiovascular disease in a cohort of systemic lupus erythematosus patients. PLoS One 2012;7:e37000. [DOI] [PMC free article] [PubMed] [Google Scholar]
- 4. Bertsias GK, Salmon JE, Boumpas DT. Therapeutic opportunities in systemic lupus erythematosus: state of the art and prospects for the new decade. Ann Rheum Dis 2010;69:1603–11. [DOI] [PubMed] [Google Scholar]
- 5. Zonana‐Nacach A, Roseman JM, McGwin G, Friedman AW, Baethge BA, Reveille JD, et al. Systemic lupus erythematosus in three ethnic groups. VI: Factors associated with fatigue within 5 years of criteria diagnosis. LUMINA Study Group. LUpus in MInority populations: NAture vs Nurture. Lupus 2000;9:101–9. [DOI] [PubMed] [Google Scholar]
- 6. Mirbagher L, Gholamrezaei A, Hosseini N, Sayed Bonakdar Z. Sleep quality in women with systemic lupus erythematosus: contributing factors and effects on health‐related quality of life. Int J Rheum Dis 2016;19:305–11. [DOI] [PubMed] [Google Scholar]
- 7. Palagini L, Mosca M, Tani C, Gemignani A, Mauri M, Bombardieri S. Depression and systemic lupus erythematosus: a systematic review. Lupus 2013;22:409–16. [DOI] [PubMed] [Google Scholar]
- 8. Wolfe F, Petri M, Alarcón GS, Goldman J, Chakravarty EF, Katz RS, et al. Fibromyalgia, systemic lupus erythematosus (SLE), and evaluation of SLE activity. J Rheumatol 2009;36:82–8. [DOI] [PMC free article] [PubMed] [Google Scholar]
- 9. Kris‐Etherton PM, Taylor DS, Yu‐Poth S, Huth P, Moriarty K, Fishell V, et al. Polyunsaturated fatty acids in the food chain in the United States. Am J Clin Nutr 2000;71:179s–88s. [DOI] [PubMed] [Google Scholar]
- 10. Simopoulos AP. The importance of the omega‐6/omega‐3 fatty acid ratio in cardiovascular disease and other chronic diseases. Exp Biol Med 2008;233:674–88. [DOI] [PubMed] [Google Scholar]
- 11. Simopoulos AP. Evolutionary aspects of diet, the omega‐6/omega‐3 ratio and genetic variation: nutritional implications for chronic diseases. Biomed Pharmacother 2006;60:502–7. [DOI] [PubMed] [Google Scholar]
- 12. Ergas D, Eilat E, Mendlovic S, Sthoeger ZM. n‐3 fatty acids and the immune system in autoimmunity. Isr Med Assoc J 2002;4:34–8. [PubMed] [Google Scholar]
- 13. Simopoulos AP. Omega‐3 polyunsaturated fatty acids: nutrigenetic and nutrigenomic aspects in the determination of dietary requirements, development, and chronic diseases In: Encyclopedia of human nutrition. Waltham (MA): Elsevier; 2013. p. 405–12. [Google Scholar]
- 14. Kohli P, Levy BD. Resolvins and protectins: mediating solutions to inflammation. Br J Pharmacol 2009;158:960–71. [DOI] [PMC free article] [PubMed] [Google Scholar]
- 15. Serhan CN, Petasis NA. Resolvins and protectins in inflammation resolution. Chem Rev 2011;111:5922–43. [DOI] [PMC free article] [PubMed] [Google Scholar]
- 16. Pestka JJ, Vines LL, Bates MA, He K, Langohr I. Comparative effects of n‐3, n‐6 and n‐9 unsaturated fatty acid‐rich diet consumption on lupus nephritis, autoantibody production and CD4+ T cell‐related gene responses in the autoimmune NZBWF1 mouse. PLoS One 2014;9:e100255. [DOI] [PMC free article] [PubMed] [Google Scholar]
- 17. Bates MA, Brandenberger C, Langohr II, Kumagai K, Lock AL, Harkema JR, et al. Silica‐triggered autoimmunity in lupus‐prone mice blocked by docosahexaenoic acid consumption. PLoS One 2016;11:1–31. [DOI] [PMC free article] [PubMed] [Google Scholar]
- 18. Duffy EM, Meenagh GK, McMillan SA, Strain JJ, Hannigan BM, Bell AL. The clinical effect of dietary supplementation with omega‐3 fish oils and/or copper in systemic lupus erythematosus. J Rheumatol 2004;31:1551–6. [PubMed] [Google Scholar]
- 19. Wright SA, O'Prey FM, McHenry MT, Leahey WJ, Devine AB, Duffy EM, et al. A randomised interventional trial of omega‐3‐polyunsaturated fatty acids on endothelial function and disease activity in systemic lupus erythematosus. Ann Rheum Dis 2008;67:841–8. [DOI] [PubMed] [Google Scholar]
- 20. Lozovoy MA, Simao AN, Morimoto HK, Scavuzzi BM, Iriyoda TV, Reiche EM, et al. Fish oil N‐3 fatty acids increase adiponectin and decrease leptin levels in patients with systemic lupus erythematosus. Mar Drugs 2015;13:1071–83. [DOI] [PMC free article] [PubMed] [Google Scholar]
- 21. Arriens C, Hynan LS, Lerman RH, Karp DR, Mohan C. Placebo‐controlled randomized clinical trial of fish oil's impact on fatigue, quality of life, and disease activity in systemic lupuseErythematosus. Nutr J 2015;14:82. [DOI] [PMC free article] [PubMed] [Google Scholar]
- 22. Bello KJ, Fang H, Fazeli P, Bolad W, Corretti M, Magder LS, et al. Omega‐3 in SLE: a double‐blind, placebo‐controlled randomized clinical trial of endothelial dysfunction and disease activity in systemic lupus erythematosus. Rheumatol Int 2013;33:2789–96. [DOI] [PMC free article] [PubMed] [Google Scholar]
- 23. Clark WF, Parbtani A, Huff MW, Spanner E, de Salis H, Chin‐Yee I, et al. Flaxseed: a potential treatment for lupus nephritis. Kidney Int 1995;48:475–80. [DOI] [PubMed] [Google Scholar]
- 24. Ilowite NT, Copperman N, Leicht T, Kwong T, Jacobson MS. Effects of dietary modification and fish oil supplementation on dyslipoproteinemia in pediatric systemic lupus erythematosus. J Rheumatol 1995;22:1347–51. [PubMed] [Google Scholar]
- 25. Lim SS, Drenkard C, McCune WJ, Helmick CG, Gordon C, DeGuire P, et al. Population‐based lupus registries: advancing our epidemiologic understanding. Arthritis Care Res (Hoboken) 2009;61:1462–6. [DOI] [PubMed] [Google Scholar]
- 26. National Cancer Institute/Epidemiology and Genomics Research Program . Diet History Questionnaire, version 2.0. 2010. URL: https://epi.grants.cancer.gov/dhq2/forms/.
- 27. National Cancer Institute/Epidemiology and Genomics Research Program . Diet History Questionnaire II (DHQ II): diet*calc software. 2012. URL: https://epi.grants.cancer.gov/dhq2/dietcalc/.
- 28. National Cancer Institute/Epidemiology and Genomics Research Program . Development of the DHQ II and C‐DHQ II nutrient & food group database. 2018. URL: https://epi.grants.cancer.gov/dhq2/database/.
- 29. University of Minnesota Nutrition Coordinating Center . NDSR nutrients, nutrient ratios, and other food components. 2018. URL: http://www.ncc.umn.edu/products/nutrients-nutrient-ratios-and-other-food-components/.
- 30. Willett WC, Howe GR, Kushi LH. Adjustment for total energy intake in epidemiologic studies. Am J Clin Nutr 1997;65:1220S–8S. [DOI] [PubMed] [Google Scholar]
- 31. Karlson EW, Daltroy LH, Rivest C, Ramsey‐Goldman R, Wright EA, Partridge AJ, et al. Validation of a systemic lupus activity questionnaire (SLAQ) for population studies. Lupus 2003;12:280–6. [DOI] [PubMed] [Google Scholar]
- 32. Wolfe F, Clauw DJ, Fitzcharles MA, Goldenberg DL, Katz RS, Mease P, et al. The American College of Rheumatology preliminary diagnostic criteria for fibromyalgia and measurement of symptom severity. Arthritis Care Res (Hoboken) 2010;62:600–10. [DOI] [PubMed] [Google Scholar]
- 33. Patient‐Reported Outcomes Measurement Information System . Depression. 2015. URL: http://www.healthmeasures.net/administrator/components/com_instruments/uploads/15-09-01_13-54-58_PROMISDepressionScoringManual.pdf.
- 34. Patient‐Reported Outcomes Measurement Information System . Sleep disturbance. 2015. URL: http://www.healthmeasures.net/administrator/components/com_instruments/uploads/15-09-01_15-11-24_PROMISSleepDisturbanceScoringManual.pdf.
- 35. Ware JE, Sherbourne CD. The MOS 36‐item short‐form health survey (SF‐36). I. Conceptual framework and item selection. Med Care 1992;30:473–83. [PubMed] [Google Scholar]
- 36. McElhone K, Abbott J, Shelmerdine J, Bruce IN, Ahmad Y, Gordon C, et al. Development and validation of a disease‐specific health‐related quality of life measure, the LupusQol, for adults with systemic lupus erythematosus. Arthritis Rheum 2007;57:972–9. [DOI] [PubMed] [Google Scholar]
- 37. Koutoubi S, Verbovski MJ, Kestin M, Huffman FG. Essential fatty acid intake and coronary heart disease risk factors among college students of 3 ethnic groups. J Natl Med Assoc 2011;103:99–108. [DOI] [PubMed] [Google Scholar]
- 38. Steffen BT, Steffen LM, Tracy R, Siscovick D, Jacobs D, Liu K, et al. Ethnicity, plasma phospholipid fatty acid composition and inflammatory/endothelial activation biomarkers in the Multi‐Ethnic Study of Atherosclerosis (MESA). Eur J Clin Nutr 2012;66:600–5. [DOI] [PMC free article] [PubMed] [Google Scholar]
- 39. Muthukumar A, Sun D, Zaman K, Barnes JL, Haile D, Fernandes G. Age associated alterations in costimulatory and adhesion molecule expression in lupus‐prone mice are attenuated by food restriction with n‐6 and n‐3 fatty acids. J Clin Immunol 2004;24:471–80. [DOI] [PubMed] [Google Scholar]
- 40. Aghdassi E, Ma DW, Morrison S, Hillyer LM, Clarke S, Gladman DD, et al. Alterations in circulating fatty acid composition in patients with systemic lupus erythematosus: a pilot study. J Parenter Enteral Nutr 2011;35:198–208. [DOI] [PubMed] [Google Scholar]
- 41. Harris PA, Taylor R, Thielke R, Payne J, Gonzalez N, Conde JG. Research electronic data capture (REDCap); a metadata‐driven methodology and workflow process for providing translational research informatics support. J Biomed Inform 2009;42:377–81. [DOI] [PMC free article] [PubMed] [Google Scholar]
- 42. Elkan AC, Anania C, Gustafsson T, Jogestrand T, Hafstrom I, Frostegard J. Diet and fatty acid pattern among patients with SLE: associations with disease activity, blood lipids and atherosclerosis. Lupus 2012;21:1405–11. [DOI] [PubMed] [Google Scholar]
- 43. DelBrutto OH, Mera RM, Ha JE, Gillman J, Zambrano M, Castillo PR. Dietary fish intake and sleep quality: a population‐based study. Sleep Med 2016;17:126–8. [DOI] [PubMed] [Google Scholar]
- 44. Hansen AL, Dahl L, Olson G, Thornton D, Graff IE, Froyland L, et al. Fish consumption, sleep, daily functioning, and heart rate variability. J Clin Sleep Med 2014;10:567–75. [DOI] [PMC free article] [PubMed] [Google Scholar]
- 45. Ladesich JB, Pottala JV, Romaker A, Harris WS. Membrane level of omega‐3 docosahexaenoic acid is associated with severity of obstructive sleep apnea. J Clin Sleep Med 2011;7:391–6. [DOI] [PMC free article] [PubMed] [Google Scholar]
- 46. Patrick RP, Ames BN. Vitamin D and the omega‐3 fatty acids control serotonin synthesis and action. Part 2: relevance for ADHD, bipolar disorder, schizophrenia, and impulsive behavior. FASEB J 2015;29:2207–22. [DOI] [PubMed] [Google Scholar]
- 47. Kato I, Majumdar AP, Land SJ, Barnholtz‐Sloan JS, Severson RK. Dietary fatty acids, luminal modifiers, and risk of colorectal cancer. Int J Cancer 2010;127:942–51. [DOI] [PMC free article] [PubMed] [Google Scholar]
- 48. U.S. Food and Drug Administration . Advice about eating fish: for women who are or might become pregnant, breastfeeding mothers, and young children. 2017. URL: https://www.fda.gov/Food/ResourcesForYou/Consumers/ucm393070.htm.
- 49. Somers EC, Ganser MA, Warren JS, Basu N, Wang L, Zick SM, et al. Mercury exposure and antinuclear antibodies among females of reproductive age in the United States: NHANES. Environ Health Perspect 2015;123:792–8. [DOI] [PMC free article] [PubMed] [Google Scholar]
- 50. U.S. Department of Health and Human Services . Dietary guidelines for Americans 2015‐2020, eighth edition. 2015. URL: https://health.gov/dietaryguidelines/2015/guidelines/.
Associated Data
This section collects any data citations, data availability statements, or supplementary materials included in this article.
Supplementary Materials