

Abstract
CMV infection remains a major complication after allogeneic hematopoietic cell transplantation (allo-HCT). We conducted a retrospective study to determine the clinical and economic burden of pre-emptive therapy (PET) for CMV infection in 100 consecutive hospitalized adult CMV positive serostatus allo-HCT recipients and compared their hospitalization cost with allo-HCT recipients hospitalized with graft versus host disease without CMV infection (control group) and across 19 US cancer centers for hospitalized patients with CMV infection between 2012– 2015 (Vizient Database). A total of 192 CMV episodes of PET for CMV infection occurred within 1 year post-HCT. PET consisted of ganciclovir (41% of episodes), foscarnet (40%), and valganciclovir (38%) with the longest average length of stay in foscarnet-treated patients (41 days). The average direct cost per patient admitted for PET was $116,976 (range $7,866-$641,841) compared to $12,496 (range $2,004-$43,069) in the control group (p<0.0001). The total direct cost per encounter was significantly higher in patients treated with foscarnet and had nephrotoxicity ($284,006) compared to those who did not ($112,195). The average cost amongst the 19 US cancer centers, including our institution, was $42,327 with major disparities in cost and clinical outcomes. PET for CMV infection is associated with high economic burden in allo-HCT recipients.
Keywords: Cytomegalovirus, Pre-emptive therapy, Hematopoietic cell transplant, cost
Introduction
Cytomegalovirus (CMV) is a significant infectious complication after allogeneic hematopoietic cell transplantation (allo-HCT).1,2 CMV infection or reactivation, defined as isolation of the CMV virus or detection of viral proteins or nucleic acid in any body fluid or tissue specimen,3 may occur as early as 14 to 30 days after transplantation regardless of whether allo-HCT recipients received non-myeloablative or myeloablative conditioning regimens.4 Additionally, in the first 100 days after allo-HCT, CMV infection is associated with increased rates of non-relapse mortality.5
When CMV reactivation is detected after allo-HCT, preemptive therapy (PET) can be initiated. This strategy consist in starting HCT recipients on antiviral therapy once CMV is detected in the blood.6 PET is more frequently used than prophylaxis for the prevention of CMV disease in allo-HCT recipients.7 PET is associated with significant morbidity and mortality and subsequent high economic burden due to hospitalization and management of antiviral drug toxicities including myelosuppression (observed with the use of antivirals such as ganciclovir, valganciclovir, and cidofovir) and nephrotoxicity (with foscarnet and cidofovir).8–10 However, this strategy has aided in decreasing the incidence of CMV end-organ disease to <10%.1,11,12
Limited data are available on the overall clinical and economic burden of CMV infection in allo-HCT recipients who underwent PET. In one single-center study, Jain et al. found that patients treated with PET for CMV infection incurred an additional cost of $58,000 to $74,000 per patient and longer hospitalization within the first 6 months after allo-HCT.13 Another study by Robin et al. concluded that having two or more CMV episodes within the first year of allo-HCT significantly increased the transplant cost.14 We aimed in this study to better assess the clinical and economic burden of PET for CMV infections and its associated toxicities in adult allo-HCT recipients during the first year after transplantation at our institution. In addition, we compared the direct cost and outcomes of CMV infections in hospitalized allo-HCT recipients from 19 major U.S. cancer centers by analysing data from the Vizient database.
Methods
Data source
Vizient, formerly known as UHC (University HealthSystem Consortium), hosts the Clinical Data Base/Resource Manager.15 Data from the Vizient Clinical Data Base/Resource Manager were utilized with the permission of Vizient. Access to Vizient data is granted to only those who are designated by one of the affiliated hospitals and have a valid hospital and institutional email address.
Study design and study population
Patient analysis.
The first part of our study was a retrospective descriptive cohort study with a cost analysis. It included 100 consecutive adult allo-HCT recipients with positive CMV serostatus who were admitted to our institution between January 2012 and December 2015 for or with CMV infection. Patients were identified using the Vizient database 15, the institutional electronic medical record (EMR), and the Department of Stem Cell Transplantation and Cellular Therapy database (HCT database). International Classification of Diseases, Ninth Revision, and Clinical Modification (ICD-9) codes for HCT/bone marrow transplantation (ICD-9 codes: V4281, V4282) and CMV infections (ICD-9 code: 771.1) on hospital discharge records were used to identify allo-HCT recipients with evidence of a subsequent CMV infection. In total, we included one hundred consecutive patients in this part of the study who had 192 CMV infections requiring PET within 1 year after allo-HCT. In addition, we collected cost data on fifty consecutive adult allo-HCT recipients who were hospitalized for or with graft versus host disease (GVHD) between January 2012 and December 2015 and did not experience CMV infection through the course of their transplant (control group). The University of Texas MD Anderson Cancer Center Institutional Review Board granted approval and waiver of consent for this study.
U.S. cancer centers analysis.
CMV encounters were studied for the top 19 centers in the 2016 ranking by U.S. News and World Report for cancer care in the United States, including our institution, from September 2012 to August 2015. In total, 1,041 CMV encounters were observed in adult CMV seropositive allo-HCT recipients within 1 year of transplant, and cost data from these events were recorded.
CMV surveillance
CMV infection was monitored using the antigenemia assay and/or the CMV viral load by polymerase chain reaction (PCR) on at least weekly basis after transplant. Pre-emptive strategy consisted of initiating CMV directed antiviral therapy for any positive CMV antigenemia assay or CMV viral load above 500 international units per ml (IU/ml) for high-risk patients (i.e. haplo-identical, cord blood recipients, patients with GvHD, patients on steroids at time of CMV infection) and with a CMV antigenemia assay equal or more than 5 cells per million white blood cells 16 or for a CMV viral load above 1,000 IU/ml 17 for low risk patients (i.e. matched related donor transplant, patients without GvHD, etc).
Data collection
We searched the Vizient Clinical Data Base (CDB) for observed cost methodology and total charges for each discharge (encounter). Figure 1 delineates the algorithm of direct cost index into line item charges using the respective revenue codes (four-digit number representing a type of activity or product), including supplies, devices, medications, services, procedures, and other items for which a distinct charge to the patient exists. In addition, every member’s Medicare Cost Report was extracted and a Ratio of Cost to Charge (RCC) was generated. Unadjusted direct cost was calculated using the RCC. Wage index was applied to the labor portion of the unadjusted cost reflecting the geographic area of each hospital (factoring the regional variation in wage) compared to the national average hospital wage level. Briefly, using the 2014 risk adjustment model, the expected direct cost of the encounter or specific drug cost was obtained using three steps: 1) assignment of a severity of illness level and risk of mortality to each encounter accounting for differences in patient characteristics, 2) selection of a patient population to serve as the basis of the model to identify the “mainstream” population to be used for direct cost model generation, and 3) usage of multiple regression techniques to predict direct cost based on the normative patient population (Figure 1).
Figure 1.
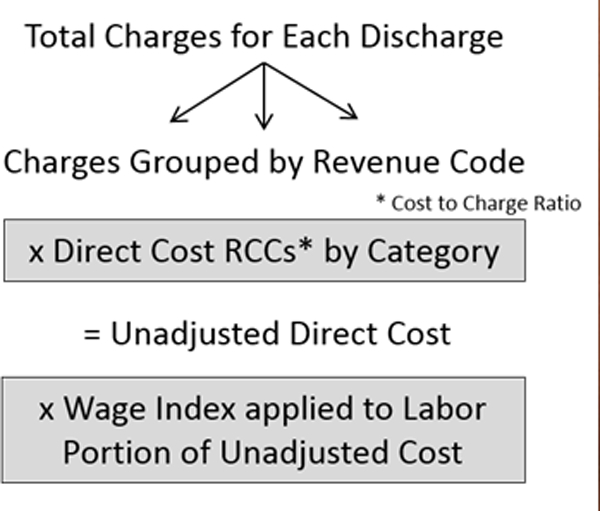
Vizient database’s method of calculating direct cost 15.
Patient analysis.
Clinical characteristics for the 100 consecutive allo-HCT patients at our institution were extracted for in-depth analysis from the institutional EMR (ClinicStation™ and Epic) and SCT database. The data collected for this study included demographics, underlying malignancy, graft-versus-host disease (GvHD), CMV episodes, CMV antiviral utilization and toxicities, and outcomes, including all-cause mortality. Risk factors such as steroid use, type of transplant, time to engraftment, time from transplantation to CMV event, absolute neutrophil count, and absolute lymphocyte count were also collected. In addition, we evaluated the economic burden by measuring direct medical costs, including hospitalization and intensive care unit (ICU) admission costs associated with CMV infection/reactivation and/or end-organ disease. Treatment costs for each anti-CMV medication were also collected, and costs were compared between patients with and without evidence of toxicities from PET for all the associated episodes. Similar data was collected for the 50 consecutive allo-HCT recipients who were hospitalized for or with GvHD and without CMV infection (control group) during the course of their transplant. We selected this control group based on the high likelihood of GvHD post allo-HCT and its association with other complications such as bacterial or fungal infections in hospitalized patients.
U.S. cancer centers analysis.
For the comparison of the 19 U.S. cancer centers, direct costs, health care utilization (including mean length of stay and ICU length of stay), and mortality data for CMV infection in HCT recipients were extracted from the Vizient database utilizing ICD-9 codes. Centers were de-identified as per Vizient’s publishing policy.
Definitions
CMV infection is defined as isolation of the CMV virus or detection of viral proteins or nucleic acid in any body fluid or tissue specimen.3 Recurrent CMV infection is defined as new detection of CMV infection in a patient who has had previously documented infection and who has not had virus detected for an interval of at least 4 weeks during active surveillance. Recurrent infection may result from reactivation of latent virus or reinfection.3 CMV end-organ disease is defined by the presence of signs and/or symptoms of end-organ disease, combined with detection of CMV in the tissue samples of the involved organ along with the demonstration of CMV infection in a biopsy specimen, depending on the organ involved.3 CMV event or CMV episode were determined as per these definitions. Patient hospitalization for or with CMV infection is defined as an admission to the hospital with the primary cause directly related or not related to CMV infection, respectively. Nephrotoxicity was defined as an increase in creatinine by 50% or more from baseline (at initiation of foscarnet) and/or decrease in eGFR by at least 25%. Myelosuppression was defined as a decrease in the absolute neutrophil or platelets counts by at least 50% from baseline after initiation of ganciclovir or valganciclovir.18
Statistical analysis
Descriptive statistics were used to summarize information on patients and their CMV infections, including demographic, clinical, treatment, outcome, and treatment cost data. Categorical variables were compared using chi-square or Fisher exact test, as appropriate. Continuous variables were compared using Wilcoxon rank-sum test. All tests were two sided with a significance level of 0.05. For understanding the economic burden of CMV infections in HCT recipients, we calculated encounter-specific mean and total costs. We also compared costs associated with different CMV antiviral therapy regimens. A 2-sided p-value of 0.05 was considered statistically significant. All statistical analyses were performed using the computer software SAS version 9.3 (SAS Institute Inc., Cary, NC).
Results
Patient analysis.
One hundred and fifty adult allo-HCT recipients were included in this study. Demographic and clinical characteristics of patients are shown in Table 1. For patients with CMV infections, the median age was 56 years (range: 20–76), the majority were men (55%), had underlying leukemia (73%), and most had undergone matched unrelated donor transplantation (47%). At the time of hospitalization, most patients had acute GvHD (62%), and received steroids (59%) within 30 days of CMV reactivation. CMV reactivation occurred at a median of 32 days after allo-HCT (range: 2 −174). Progression to CMV disease occurred in 4 patients (4%) and affected the gastrointestinal tract in 3 patients (3%) and the lungs in 1 patient (1%). All-cause mortality was 59% for patients who had CMV reactivation and/or CMV disease. Similar characteristics were observed in the control group of the 50 allo-HCT recipients who were hospitalized for or with GVHD and without CMV infections except that these patients had higher incidence of negative recipient CMV serostatus, more underwent matched related donor transplantation, had shorter time to engraftment, and longer time from HCT to fatal outcome (Table 1).
Table 1.
Demographic and Clinical Characteristics of Patients With or Without CMV Infections
| Characteristics | CMV episodes N (%) (n=100) |
Control group (GVHD) N (%) (n=50) |
P-value |
|---|---|---|---|
| Age (years), median (range) | 56 (20–76) | 51 (19–80) | 0.13 |
| Sex, Male | 55 (55) | 30 (60) | 0.56 |
| Race/ethnicity* | 0.13 | ||
| White | 61 (63) | 35 (70) | |
| Black | 13 (13) | 3 (6) | |
| Hispanic | 14 (14) | 11 (22) | |
| Other | 9 (9) | 1 (2) | |
| Recipient CMV serostatus at time of transplantation | 0.016 | ||
| Non-reactive | 3 (3) | 7 (14) | |
| Reactive | 97 (97) | 43 (86) | |
| Donor CMV serostatus | 0.36 | ||
| Non-reactive | 46 (46) | 27 (54) | |
| Reactive | 54 (54) | 23 (46) | |
| Underlying malignancy | 0.052 | ||
| Leukemia | 73 (73) | 33 (66) | |
| Lymphoma | 10 (10) | 9 (18) | |
| Myelodysplastic syndrome | 16 (16) | 5 (10) | |
| Aplastic anemia | 1 (1) | 0 (0) | |
| Other | 0 (0) | 3 (6) | |
| Prophylaxis for CMV during conditioning regimen | |||
| Ganciclovir | 32 (32) | - | - |
| Foscarnet | 15 (15) | ||
| ValAcyclovir | 77 (77) | ||
| Transplant type | < .001 | ||
| MUD (Matched unrelated donor) | 47 (47) | 27 (54) | |
| MRD (Matched related donor) | 15 (15) | 16 (32) | |
| Haplo-identical | 26 (26) | 3 (6) | |
| Cord | 12 (12) | 2 (4) | |
| Others | 0 (0) | 2 (4) | |
| Time to engraftment, median in days (range) | 14 (0–34) | 12 (0–36) | 0.003 |
| Time from HCT to first CMV infection, median in days (range) | 32 (2–174) | - | - |
| Acute GvHD at time of CMV infection | 62 (62) | - | - |
| Number of CMV episodes within 1 year from HCT, median in days (range) | 2 (1–5) | - | - |
| Number of hospitalizations for CMV within 1 year from HCT, median in days (range) | 1 (1–3) | - | - |
| Number of hospitalizations for any cause within 1 year from HCT, median in days (range) | 4 (1–18) | 3 (0–12) | 0.11 |
| LOS (days), median (range) | 31 (19–101) | 5 (1–23) | < .0001 |
| CMV end-organ disease | 4 (4) | - | - |
| All-cause mortality | 59 (59) | 23 (46) | 0.13 |
| Time from HCT to fatal outcome, median in days (range) | 217 (69–908) | 351 (72–3188) | 0.034 |
Data available for 97 patients with CMV infections and in all patients without CMV infections.
Abbreviations: CMV, cytomegalovirus; HCT, hematopoeitic cell transplant; GvHD, graft versus host disease.
Specific data for the CMV episodes are depicted in Table 2. PET consisted of ganciclovir (41% of episodes), foscarnet (40%), and valganciclovir (38%). Intravenous immunoglobulins (IVIGs) were also used as adjunct therapy in 20% of the episodes. The mean length of stay for patients treated with ganciclovir or foscarnet was 32 days (2–141) and 41 days (1–177), respectively. The mean cost of CMV antiviral drug per hospitalization was $6,096 for IVIGs, $2,410 for foscarnet, $836 for ganciclovir, and $780 for valganciclovir (Table 2). The median length of stay of patients with CMV episodes was significantly longer then for patients admitted without CMV infections and with GVHD (31 days (19–101) and 5 days (1–23), respectively; p<.0001). In addition, the average direct cost for patients undergoing PET for CMV infections was significantly higher compared to patients hospitalized for or with GVHD without CMV infections ($116,976 vs. $12,496, respectively; p< .0001) (Table 2).
Table 2.
CMV Episodes, Treatment Characteristics, and Cost Analysis in Patients Hospitalized With or Without CMV Infections.
| Variables | Admitted with CMV infection (n=165) N (%) |
Admitted for CMV infection (n=27) N (%) |
p-value |
Total CMV episodes (n=192) N (%) |
Control group (GVHD) (n=50) N (%) |
p-value |
|---|---|---|---|---|---|---|
| Systemic corticosteroids (within 30 days prior to CMV episode or GVHD) | 95 (58) | 18 (67) | 0.37 | 113 (59) | 35 (70) | 0.15 |
| No corticosteroids | 70 (42) | 9 (33) | 0.56 | 79 (41) | 15 (30) | < .0001 |
| <1 mg/kg | 93 (56) | 18 (67) | 111 (58) | 4 (8) | ||
| 1–2 mg/kg | 2 (1) | 0 | 2 (1) | 31 (62) | ||
| Immunosuppressants used (within 30 days prior to CMV episode or GVHD) | ||||||
| Tacrolimus | 114 (69) | 25 (93) | 0.011 | 139 (72) | 41 (82) | 0.17 |
| Mycophenolate | 28 (17) | 10 (37) | 0.015 | 38 (20) | 3 (6) | 0.021 |
| Duration of CMV episode, median in days (range) | 19 (0–177) | 63 (6–273) | < .0001 | 22 (0–273) | - | - |
| Days from first CMV antigenemia assay to CMV antigenemia peak, median in days (range) | 4 (0–122) | 14 (0–180) | 0.003 | 5 (0–180) | - | - |
| Peak CMV antigenemia levels (cells per million white blood cells), median (range) | 12 (1–6400) | 96 (1–791) | < .0001 | 16 (1–6400) | - | - |
| Peak CMV viral load by PCR, median in IU/mL (range) | 250 (137–1,038,889) | 1656 (250 – 2,142,019) | 0.005 | 258 (137–2,142,019) | - | - |
| Pre-emptive therapy*: | ||||||
| Ganciclovir | 60 (36) | 18 (67) | 0.003 | 78 (41) | - | - |
| Valganciclovir | 59 (36) | 14 (52) | 0.11 | 73 (38) | ||
| Foscarnet | 56 (34) | 20 (74) | < .0001 | 76 (40) | ||
| Cidofovir | 7 (4) | 6 (22) | 0.004 | 13 (7) | ||
| Leflunomide | 14 (8) | 9 (33) | 0.001 | 23 (12) | ||
| CMV disease** | 2 (50) | 2 (50) | 0.10 | 4 (4) | - | - |
| Number of days on ganciclovir, median (range) | 16 (1–66) | 23 (2–51) | 0.40 | 18 (1–66) | - | - |
| LOS in days for patients treated with ganciclovir, median (range) | 31 (3–141) | 36 (2–110) | 0.66 | 32 (2–141) | - | - |
| LOS in days for patients treated with Foscarnet, median (range) | 40 (1–177) | 44 (2–146) | 0.76 | 41 (1–177) | - | - |
| Cost of ganciclovir for hospitalized patients (for each CMV episode) ($), mean (range) | 871 (137–3,554) | 736 (68–2,015) | 0.45 | 836 (68–3,554) | - | - |
| Cost of valganciclovir for hospitalized patients (for each CMV episode) ($), mean (range) | 818 (117–5,859) | 616 (129–1,288) | 0.68 | 780 (117–5,859) | - | - |
| Cost of foscarnet for hospitalized patients (for each CMV episode) ($), mean (range) | 2,340 (145–14,379) | 2,592 (311–12,065) | 0.91 | 2,410 (145–14,379) | - | - |
| Cost of IVIGs ($), mean (range) | 5,578 (2,892–14,460) | 7,415 (2,892–23,136) | 0.46 | 6,096 (2,892–23,136) | - | - |
| Total direct cost per encounter ($), mean (range)*** | 126,039 (7,866–641,841) | 97,455 (8,086–394,146) | 0.32 | 116,976 (7,866–641,841) | 12,496 (2,004–43,069) | < .0001 |
Abbreviations: GVHD, graft versus host disease; LOS, Length of stay; PCR, polymerase chain reaction, IVIGs, Intravenous Immunoglobulins
Note: The number of days used for calculating total direct cost per day is based on the total number of inpatient days when the patient was receiving ganciclovir and/or foscarnet therapy.
The total number of episodes receiving pre-emptive therapy is more than 100% because some agents were used in combination with leflunomide.
CMV disease occurred in the gastrointestinal tract (3 patients) and in the lungs (1 patient).
The risk adjustment process adopted by Vizient uses multiple regression techniques to predict direct cost based on the normative patient population and assigns expected direct cost that incorporate various coefficients for each clinical condition. Specifically, observed direct costs in this study incorporates Vizient’s risk adjustment calculation due to the sensitivity of collecting such information at the national level with complete transparency for benchmarking purpose among Academic Medical Centers.
Myelosuppression and nephrotoxicity from PET were observed in 35% of patients who received ganciclovir and/or valganciclovir and 12% of patients who received foscarnet, respectively. Table 3 depicts the cost comparison and drug toxicities for patients treated with ganciclovir and foscarnet. The total direct cost per encounter was significantly higher in patients who had serious side effects from foscarnet than in those who did not.
Table 3.
Cost of hospitalized patients who developed drug toxicities after antiviral therapy for CMV infections.
| Cost of CMV episodes treated with the indicated drug, stratified by occurrence of toxicity* | |||
|---|---|---|---|
| Yes | No | p-value | |
| Foscarnet | |||
| Cost of foscarnet (for each CMV episode) ($), mean (range) | 3,342 (207–14,379) | 2,309 (145–12,065) | 0.95 |
| (n=7)† | (n=46) | ||
| Total direct cost for the encounter ($), mean (range) | 284,006 (58,930–565,745) | 112,195 (8,086–394,146) | 0.021 |
| (n=7) | (n=33) | ||
| Ganciclovir | |||
| Cost of ganciclovir (for each CMV episode) ($), mean (range) | 809 (68–3,023) | 854 (68–3,554) | 0.47 |
| (n=21)** † | (n=33) | ||
| Total direct cost for the encounter ($), mean (range) | 108,547 (9,362–426,898) | 145,838 (7,866–641,841) | 0.34 |
| (n=17)*** | (n=26) | ||
Nephrotoxicity in patients treated with foscarnet; myelosuppression in patients treated with ganciclovir.
Neupogen: 11/21 (52%), Cost of Neupogen ($), mean (range): 1,178 (419–2,667)
Neupogen: 9/17 (53%), Cost of Neupogen ($), mean (range): 1,160 (419–2,667)
Episodes experiencing toxicities with available data were included in this table (21/27 for ganciclovir and 7/9 for foscarnet).
U.S. cancer centers analysis.
We calculated an overall total cost of $49,693,604.00 associated with CMV infections in allo-HCT recipients across 19 cancer centers during the 36 months of the study period (Table 4). The average direct total cost per encounter was $42,327 (interquartile range (IQR): $21,273.5). A total of 15,532 hospitalization days were attributed to CMV infections, with an average length of stay of 15 days per patient. The average ICU admission rate was 20%. Among the 1,041 total CMV encounters, an overall in-hospital mortality rate of 11% was observed (Table 4).
Table 4.
Direct Cost of CMV Infections (Encounters) in Allogeneic HCT Recipients from September 2012 to August 2015 in 19 Cancer Centers Across the United States.
| Cancer Centers |
Encounters | Mean LOS (Observed) (Days) |
ICU Cases (%) |
Mean ICU LOS (Days) |
Deaths (%) |
Mean Direct Cost (Observed) ($) |
Total Cost (Observed) ($) |
|---|---|---|---|---|---|---|---|
| Center 1 | 41 | 22.33 | 17.08 | 23.87 | 11.27 | 79,914 | 3,276,470 |
| Center 2 | 30 | 11.30 | 14.96 | 11.11 | 8.71 | 38,929 | 1,167,861 |
| Center 3 | 38 | 13.34 | 21.84 | 9.88 | 19.44 | 60,909 | 2,314,533 |
| Center 4 | 46 | 18.02 | 25.00 | 6.29 | 8.61 | 55,081 | 2,533,728 |
| Center 5 | 6 | 5.50 | 16.67 | 3.00 | 0.00 | 18,949 | 113,691 |
| Center 6 | 32 | 13.26 | 8.17 | 22.00 | 10.10 | 32,216 | 1,030,913 |
| Center 7 | 34 | 16.46 | 11.90 | 5.67 | 7.14 | 30,245 | 1,028,317 |
| Center 8 | 47 | 8.48 | 1.56 | 2.00 | 4.17 | 30,632 | 1,439,724 |
| Center 9 | 15 | 10.92 | 16.67 | 7.50 | 16.67 | 22,145 | 332,170 |
| Center 10 | 20 | 17.38 | 24.17 | 9.33 | 6.67 | 33,681 | 673,612 |
| Center 11 | 38 | 10.04 | 27.28 | 4.52 | 16.76 | 31,520 | 1,197,770 |
| Center 12 | 32 | 14.69 | 21.90 | 7.89 | 25.48 | 41,792 | 1,337,350 |
| Center 13 | 150 | 22.10 | 21.65 | 8.99 | 9.82 | 28,825 | 4,323,766 |
| Center 14 | 20 | 14.99 | 41.67 | 19.50 | 2.78 | 48,343 | 966,856 |
| Center 15 | 31 | 17.53 | 23.82 | 4.88 | 17.20 | 39,998 | 1,239,941 |
| Center 16 | 25 | 9.30 | 31.88 | 6.17 | 22.50 | 24,333 | 608,336 |
| Center 17 | 10 | 29.71 | 22.92 | 14.75 | 0.00 | 82,098 | 820,979 |
| Center 18 | 322 | 17.34 | 18.11 | 25.03 | 11.01 | 66,096 | 21,282,820 |
| Center 19 | 104 | 10.81 | 16.30 | 4.30 | 5.12 | 38,507 | 4,004,769 |
| Mean (IQR) | 55 (21) | 14.92 (6.59) | 20.19 (7.51) | 10.35 (7.66) | 10.71 (10.82) | 42,326.95 (21,273.5) | 2,615,453 (1,530,213) |
| Total | 1,041 | - | - | - | - | - | 49,693,604 |
Abbreviations: HCT, Hematopoeitic cell transplant; LOS, length of stay; ICU, intensive Care Unit; IQR, interquartile range.
Discussion
In this study, the cost of PET and its associated toxicities as well as patient and treatment characteristics were evaluated in allo-HCT recipients with or without CMV infections to better understand the clinical and economic burden of CMV infections. Our main findings during the first year after transplantation were that the average direct cost per allo-HCT recipient admitted for PET for CMV infections at our institution during the study period was high ($116,976, range: $7,866-$641,841) and the total direct cost per encounter was significantly higher in patients who had kidney injury from foscarnet than in those who did not ($284,006 vs. $112,195). This could be explained in part by the high cost of foscarnet and the extended length of stay for patients who experienced nephrotoxicitiy (Table 2). In the US and according to the World Health Organization, 2018 defined daily dosage cost of intravenous foscarnet is estimated around $405/day whereas intravenous ganciclovir is around $53/day. In the absence of CMV infection and PET, the average direct cost for allo-HCT hospitalized for or with GVHD was much lower ($12,496). When comparing CMV encounters across the 19 U.S. cancer centers, a wide spectrum of direct costs was observed.
The average direct cost associated with CMV infection and PET across the 19 cancer centers extracted from the Vizient database did not mirror the average direct cost calculated for each episodes of CMV infection in our institution. This could be explained in part by the referral biais of higher risk patients for HCT to our institution and mainly by the overestimation of costs when granular cost data is collected, in contrast to cost data provided in databases. In fact, the Vizient CDB allows for comparisons by accounting for patient level risk at the individual clinical cohort level. Specifically, expected direct cost is based on regression model for the entire length of stay (LOS) of the inpatient encounters and not segmented based on particular procedural treatment, clinical trial or therapy; thus, direct cost index, which is a ratio of observed to expected cost (O/E ratio), may include other costs outside of CMV treatment such as complications, comorbidities, and other high risk factors.
Due to the serious side effects from the available anti-CMV agents 8,10, PET was introduced in the 1980s for the treatment of CMV infection in allo-HCT recipients and has been effective in decreasing the morbidity and mortality in this population 19–21. Several previous studies have found that infections and GvHD were the cost drivers after HCT, as these usually result in increased length of stay or re-hospitalization rates.14,22–26 CMV serostatus of the donor or recipient before HCT was not found to predict costs after HCT, but a trend for lower costs in cases with CMV-seronegative donor or recipient has been seen.14,23,25,27 In the early 1990s, CMV infection was identified as a significant cost driver; CMV-associated mortality was high due to many factors associated with the transplantation, early diagnosis, and therapy of CMV infection.28 Recent U.S. studies found that CMV infection incurs additional costs.13,27 More specifically, a recent study showed that the direct cost of CMV infections in allo-HCT recipeints was around $24,892 per transplant episode but excluding overhead costs.27 Our study further explores the reasons behind these additional costs, including the cost of currently available anti-CMV medications and its associated toxicities.
Limited data is available on the comparison of cost-effectiveness between PET and prophylaxis for allo-HCT recipients.28,29 Studies in lung transplant recipients showed that PET with ganciclovir instead of prophylaxis is safer, more effective and less costly with savings around $2,569 per patient.30 New drugs and agents for therapy or prevention of CMV infections are in late phases of development.31–36 Recently, Letermovir, a new anti-CMV drug with novel mechanism of action was approved in November 2017 for prevention of CMV infection in CMV seropositive adult allo-HCT recipients.37 Potentially, the use of a safe and effective drug for prophylaxis to decrease the incidence of CMV infections, and avert PET may reduce the clinical and economic impact of CMV infections, and drug toxicities associated with PET but still need to be determined in future studies. Costs and outcomes data from our study may be utilized for future cost-effectiveness studies when comparing newer anti-CMV compounds or strategies for management of CMV infections.
No published data is available on costs associated with CMV end-organ disease in HCT recipients except a recent study of allo-HCT recipients with CMV reactivation and with or without CMV end organ disease reported no additional increase in cost.27 In our study, CMV end-organ disease occurred in only 4 patients and mainly affected the GI tract. Because of the small sample size, we were not able to extract meaningful cost data for management of CMV disease.
Major disparities in the cost and outcomes of CMV infections in allo-HCT recipients across the 19 cancer centers in the U.S. were seen with a mean direct cost of $42,327 ranging from $18,949 to $82,098. One study has examined the CMV-associated costs from five solid organ transplant centers. Our findings are in accordance with this study where the total hospital charges were around $1,431,793 with an average length of stay of 10.9 days per patient and an average CMV-associated hospital cost of around $21,771. In addition, the authors observed that patients with CMV infections were charged about $10,000 more than patients with no CMV infections during the 1-year follow-up.38
Cost data for our study was collected through the Vizient database. Vizient forms the nation’s largest member-driven healthcare improvement company combining the strengths of several entities, like Veterans Health Administration and others, aiming to provide transparent patient data to guide institutions’ performance improvement.15 Currently, there are approximately 112 university medical centers and 250 of their affiliated hospitals in the Vizient network. Previously, the lack of national cost data was an impediment for cost-effectiveness studies. With the availability of the Vizient database, several studies are employing this resource to generate accurate cost-effectiveness data related to diagnostic, procedural and financial data.15 On the other hand, Vizient database lacks risk adjusted direct cost on patients treated on an outpatient basis, thus, the physician, drugs, and outpatient clinic costs are not included in this study as the Vizient database primarily consists of inpatient discharge data.
Our study has some limitations. First, costs were measured from the payer perspective, as a result, the full societal cost analysis was not conducted as measurement of indirect cost. Second, the study was limited to only one cancer center with a sample size of 100, in regards to the cost associated with admission for and with CMV as well as drug toxicities. For external validity, granular economic and clinical data from different cancer centers are needed and a CMV multicenter consortium study is underway to validate our findings. Additionally, as stated above, data on patients with CMV infections who were treated on an outpatient basis were excluded from this study. Moreover, a possible selection bias may have occurred as our institution is a large referral cancer hospital where patients could be sicker and almost half of the patients with CMV infections received foscarnet for PET instead of ganciclovir or valganciclovir, which may have resulted in higher costs compared to other cancer centers. Since CMV infection and HCT were identified using ICD-9 diagnosis codes, under-ascertainment of both these diagnoses is likely. There could also have been misreporting or misclassification of ICD-9 codes for CMV infection and HCT by the coding specialists and physicians, which may have caused underestimation or overestimation of CMV-associated costs and clinical burden across the 19 cancer centers. Finally, the generalizability of the Vizient database could be another limitation as small number of studies utilized this method.39–41
To our knowledge, this is the first study that shows the cost and outcomes of CMV infections requiring PET in HCT recipients using a large healthcare database as well as the economic and clinical burden of this infection across a large sample of major cancer centers in the United States. Our findings underscore the significant impact of CMV reactivation and PET in terms of economic and clinical burden in allo-HCT recipients. Whether a prophylactic strategy with an effective and well-tolerated agent decreases the clinical and economic burden in allo-HCT when compared to PET, needs to be determined in future studies. Finally, a multicenter study including different cancer centers is imperative for validation of these findings.
Acknowledgments.
We thank Sunita Patterson of the Department of Scientific Publications, MD Anderson Cancer Center, for copyediting the manuscript.
Financial support. This work was supported in part by a research grant from Merck. The project was supported by the NIH/NCI under award number P30CA016672 and used the Clinical Trials Support Resource
Footnotes
Conflicts of interest. J.S. is an employee of Merck. R. F. C. has served as consultant/advisor to and received research grants from Merck, Chimerix, Clinigen, Oxford Immunotec, and Shire. All other authors report no potential conflicts.
References
- 1.Boeckh M Ljungman P How we treat cytomegalovirus in hematopoietic cell transplant recipients. Blood. 2009;113(23):5711–9. [DOI] [PMC free article] [PubMed] [Google Scholar]
- 2.Lin R Liu Q Diagnosis and treatment of viral diseases in recipients of allogeneic hematopoietic stem cell transplantation. J Hematol Oncol. 2013;6(94. [DOI] [PMC free article] [PubMed] [Google Scholar]
- 3.Ljungman P, Boeckh M, Hirsch HH, et al. Definitions of cytomegalovirus infection and disease in transplant patients for use in clinical trials. Clin Infect Dis. 2017;64(1):87–91. [DOI] [PubMed] [Google Scholar]
- 4.Nakamae H, Kirby KA, Sandmaier BM, et al. Effect of conditioning regimen intensity on cmv infection in allogeneic hematopoietic cell transplantation. Biol Blood Marrow Transplant. 2009;15(6):694–703. [DOI] [PMC free article] [PubMed] [Google Scholar]
- 5.Teira P, Battiwalla M, Ramanathan M, et al. Early cytomegalovirus reactivation remains associated with increased transplant-related mortality in the current era: A cibmtr analysis. Blood. 2016;127(20):2427–38. [DOI] [PMC free article] [PubMed] [Google Scholar]
- 6.Goodrich JM, Mori M, Gleaves CA, et al. Early treatment with ganciclovir to prevent cytomegalovirus disease after allogeneic bone-marrow transplantation. N Engl J Med. 1991;325(23):1601–1607. [DOI] [PubMed] [Google Scholar]
- 7.Pollack M, Heugel J, Xie H, et al. An international comparison of current strategies to prevent herpesvirus and fungal infections in hematopoietic cell transplant recipients. Biol Blood Marrow Transplant. 2011;17(5):664–73. [DOI] [PMC free article] [PubMed] [Google Scholar]
- 8.Boeckh M, Murphy WJ, Peggs KS. Recent advances in cytomegalovirus: An update on pharmacologic and cellular therapies. Biol Blood Marrow Transplant. 2015;21(1):24–9. [DOI] [PubMed] [Google Scholar]
- 9.Bregante S, Bertilson S, Tedone E, et al. Foscarnet prophylaxis of cytomegalovirus infections in patients undergoing allogeneic bone marrow transplantation (bmt): A dose-finding study. Bone Marrow Transplant. 2000;26(1):23–9. [DOI] [PubMed] [Google Scholar]
- 10.Salzberger B, Bowden RA, Hackman RC, Davis C, Boeckh M. Neutropenia in allogeneic marrow transplant recipients receiving ganciclovir for prevention of cytomegalovirus disease: Risk factors and outcome. Blood. 1997;90(6):2502–8. [PubMed] [Google Scholar]
- 11.Boeckh M, Gooley TA, Myerson D, et al. Cytomegalovirus pp65 antigenemia-guided early treatment with ganciclovir versus ganciclovir at engraftment after allogeneic marrow transplantation: A randomized double-blind study. Blood. 1996;88(10):4063–71. [PubMed] [Google Scholar]
- 12.Yanada M, Yamamoto K, Emi N, et al. Cytomegalovirus antigenemia and outcome of patients treated with pre-emptive ganciclovir: Retrospective analysis of 241 consecutive patients undergoing allogeneic hematopoietic stem cell transplantation. Bone Marrow Transplant. 2003;32(8):801–7. [DOI] [PubMed] [Google Scholar]
- 13.Jain NA, Lu K, Ito S, et al. The clinical and financial burden of pre-emptive management of cytomegalovirus disease after allogeneic stem cell transplantation-implications for preventative treatment approaches. Cytotherapy. 2014;16(7):927–33. [DOI] [PMC free article] [PubMed] [Google Scholar]
- 14.Robin C, Hemery F, Dindorf C, et al. Economic burden of preemptive treatment of cmv infection after allogeneic stem cell transplantation: A retrospective study of 208 consecutive patients. BMC Infect Dis. 2017;17(1):747. [DOI] [PMC free article] [PubMed] [Google Scholar]
- 15.Vizient-Incorportation. Https://www.Vizientinc.Com/ accessed from 2015 to 2018.
- 16.Nesher L, Shah DP, Ariza-Heredia EJ, et al. Utility of the enzyme-linked immunospot interferon-gamma-release assay to predict the risk of cytomegalovirus infection in hematopoietic cell transplant recipients. J Infect Dis. 2016;213(11):1701–7. [DOI] [PMC free article] [PubMed] [Google Scholar]
- 17.El Haddad L, Ariza-Heredia E, Shah DP, et al. The ability of a cytomegalovirus elispot assay to predict outcome of low-level cmv reactivation in hematopoietic cell transplant recipients. J Infect Dis. 2018;jiy592–jiy592. [DOI] [PMC free article] [PubMed] [Google Scholar]
- 18.Bellomo R, Kellum JA, Ronco C. Defining and classifying acute renal failure: From advocacy to consensus and validation of the rifle criteria. Intensive Care Med. 2007;33(3):409–13. [DOI] [PubMed] [Google Scholar]
- 19.Boeckh M, Bowden RA, Gooley T, Myerson D, Corey L. Successful modification of a pp65 antigenemia-based early treatment strategy for prevention of cytomegalovirus disease in allogeneic marrow transplant recipients. Blood. 1999;93(5):1781–2. [PubMed] [Google Scholar]
- 20.Einsele H, Ehninger G, Hebart H, et al. Polymerase chain reaction monitoring reduces the incidence of cytomegalovirus disease and the duration and side effects of antiviral therapy after bone marrow transplantation. Blood. 1995;86(7):2815–20. [PubMed] [Google Scholar]
- 21.Ljungman P, Engelhard D, Link H, et al. Treatment of interstitial pneumonitis due to cytomegalovirus with ganciclovir and intravenous immune globulin: Experience of european bone marrow transplant group. Clin Infect Dis. 1992;14(4):831–5. [DOI] [PubMed] [Google Scholar]
- 22.Esperou H, Brunot A, Roudot-Thoraval F, et al. Predicting the costs of allogeneic sibling stem-cell transplantation: Results from a prospective, multicenter, french study. Transplantation. 2004;77(12):1854–8. [DOI] [PubMed] [Google Scholar]
- 23.Khera N, Emmert A, Storer BE, et al. Costs of allogeneic hematopoietic cell transplantation using reduced intensity conditioning regimens. Oncologist. 2014;19(6):639–44. [DOI] [PMC free article] [PubMed] [Google Scholar]
- 24.Lee SJ, Klar N, Weeks JC, Antin JH. Predicting costs of stem-cell transplantation. J Clin Oncol. 2000;18(1):64–71. [DOI] [PubMed] [Google Scholar]
- 25.Saito AM, Cutler C, Zahrieh D, et al. Costs of allogeneic hematopoietic cell transplantation with high-dose regimens. Biol Blood Marrow Transplant. 2008;14(2):197–207. [DOI] [PMC free article] [PubMed] [Google Scholar]
- 26.van Agthoven M, Groot MT, Verdonck LF, et al. Cost analysis of hla-identical sibling and voluntary unrelated allogeneic bone marrow and peripheral blood stem cell transplantation in adults with acute myelocytic leukaemia or acute lymphoblastic leukaemia. Bone Marrow Transplant. 2002;30(4):243–51. [DOI] [PubMed] [Google Scholar]
- 27.Webb BJ, Harrington R, Schwartz J, et al. The clinical and economic impact of cytomegalovirus infection in recipients of hematopoietic stem cell transplantation. Transpl Infect Dis. 2018;e12961. [DOI] [PubMed] [Google Scholar]
- 28.Griffiths RI, Bass EB, Powe NR, et al. Factors influencing third party payer costs for allogeneic bmt. Bone Marrow Transplant. 1993;12(1):43–8. [PubMed] [Google Scholar]
- 29.Mandanas RA, Saez RA, Selby GB, Confer DL. Cytomegalovirus surveillance and prevention in allogeneic bone marrow transplantation: Examination of a preemptive plan of ganciclovir therapy. Am J Hematol. 1996;51(2):104–11. [DOI] [PubMed] [Google Scholar]
- 30.Kelly J, Hurley D, Raghu G. Comparison of the efficacy and cost effectiveness of pre-emptive therapy as directed by cmv antigenemia and prophylaxis with ganciclovir in lung transplant recipients. J Heart Lung Transplant. 2000;19(4):355–9. [DOI] [PubMed] [Google Scholar]
- 31.Kharfan-Dabaja MA, Boeckh M, Wilck MB, et al. A novel therapeutic cytomegalovirus DNA vaccine in allogeneic haemopoietic stem-cell transplantation: A randomised, double-blind, placebo-controlled, phase 2 trial. Lancet Infect Dis. 2012;12(4):290–9. [DOI] [PubMed] [Google Scholar]
- 32.Marty FM, Ljungman P, Papanicolaou GA, et al. Maribavir prophylaxis for prevention of cytomegalovirus disease in recipients of allogeneic stem-cell transplants: A phase 3, double-blind, placebo-controlled, randomised trial. Lancet Infect Dis. 2011;11(4):284–92. [DOI] [PubMed] [Google Scholar]
- 33.Marty FM, Winston DJ, Rowley SD, et al. Cmx001 to prevent cytomegalovirus disease in hematopoietic-cell transplantation. N Engl J Med. 2013;369(13):1227–36. [DOI] [PubMed] [Google Scholar]
- 34.Nakamura R, La Rosa C, Longmate J, et al. Viraemia, immunogenicity, and survival outcomes of cytomegalovirus chimeric epitope vaccine supplemented with pf03512676 (cmvpepvax) in allogeneic haemopoietic stem-cell transplantation: Randomised phase 1b trial. Lancet Haematol. 2016;3(2):e87–98. [DOI] [PMC free article] [PubMed] [Google Scholar]
- 35.Sellar RS Peggs KS. Therapeutic strategies for cytomegalovirus infection in haematopoietic transplant recipients: A focused update. Expert Opin Biol Ther. 2014;14(8):1121–6. [DOI] [PubMed] [Google Scholar]
- 36.Einsele H, Roosnek E, Rufer N, et al. Infusion of cytomegalovirus (cmv)-specific t cells for the treatment of cmv infection not responding to antiviral chemotherapy. Blood. 2002;99(11):3916–22. [DOI] [PubMed] [Google Scholar]
- 37.Chemaly RF, Ullmann AJ, Stoelben S, et al. Letermovir for cytomegalovirus prophylaxis in hematopoietic-cell transplantation. N Engl J Med. 2014;370(19):1781–9. [DOI] [PubMed] [Google Scholar]
- 38.Henderson R, Carlin D, Kohlhase K, Leader S. Multicenter us study of hospital resource utilization associated with cytomegalovirus-related readmission of renal and heart transplant patients. Transpl Infect Dis. 2001;3 Suppl 2(57–9. [DOI] [PubMed] [Google Scholar]
- 39.Tobert CM, Mott SL, Nepple KG. Malnutrition diagnosis during adult inpatient hospitalizations: Analysis of a multi-institutional collaborative database of academic medical centers. J Acad Nutr Diet. 2018;118(1):125–131. [DOI] [PubMed] [Google Scholar]
- 40.Armijo P, Pratap A, Wang Y, Shostrom V, Oleynikov D. Robotic ventral hernia repair is not superior to laparoscopic: A national database review. Surg Endosc. 2018;32(4):1834–1839. [DOI] [PubMed] [Google Scholar]
- 41.Manzano JG, Park A, Lin H, Liu S, Halm J. Demonstrating value: Association of cost and quality outcomes with implementation of a value-driven oncology-hospitalist inpatient collaboration for patients with lung cancer. BMJ Open Qual. 2019;8(1):e000381. [DOI] [PMC free article] [PubMed] [Google Scholar]