

Summary
The Polycomb repressive complex 2 (PRC2) catalyzes H3K27 methylation across the genome, which impacts transcriptional regulation and is critical for establishment of cell identity. Because of its essential function during development and in cancer, understanding the delineation of genome-wide H3K27 methylation patterns has been the focus of intense investigation. PRC2 methylation activity is abundant and dispersed throughout the genome, but highest activity is specifically directed to a subset of target sites that are stably occupied by the complex and highly enriched for H3K27me3. Here, we show, by systematically knocking out single and multiple non-core subunits of the PRC2 complex in mouse embryonic stem cells, that they each contribute to directing PRC2 activity to target sites. Furthermore, combined knockout of six non-core subunits reveals that, while dispensable for global H3K27 methylation levels, the non-core PRC2 subunits are collectively required for focusing H3K27me3 activity to specific sites in the genome.
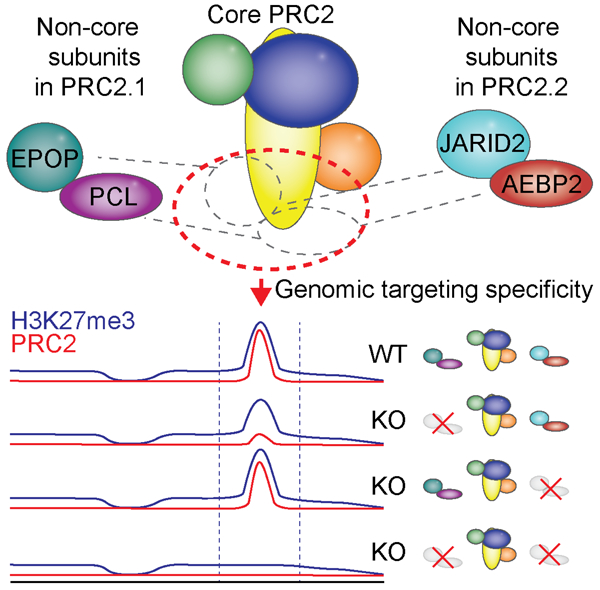
Graphical abstract
eTOC Blurb
The histone methyltransferase activity of PRC2 is widespread across the genome but is particularly focused at specific target regions to produce abundant local trimethylation (H3K27me3) at many silent genes. A genetic dissection demonstrates that a set of substoichiometric PRC2 subunits are collectively required for enabling target site specificity and critical for maintenance of gene repression.
Introduction
The Polycomb repressive complex 2 (PRC2) methylates lysine 27 on histone H3 (H3K27) and is responsible for deposition of H3K27 mono- (H3K27me1), di- (H3K27me2), and tri-methylation (H3K27me3), which are abundant modifications distributed across the genome in cell-type specific patterns (Bracken et al., 2006; Cao et al., 2002; Ferrari et al., 2014; Hojfeldt et al., 2018; Kuzmichev et al., 2002; Muller et al., 2002). These histone modifications, in particular H3K27me3, are widely thought to play roles in regulating gene expression and are required for proper organismal development (Schuettengruber et al., 2017). Several cancers develop as a consequence of driver mutations in PRC2 or its H3K27 substrate, which alter the H3K27 methylation levels and patterns (Laugesen et al., 2016).
The PRC2 complex contains three core subunits, EZH1 or EZH2, SUZ12 and EED, all of which are essential for methyltransferase activity, as well as the subunit RBBP4 or its paralog RBBP7 (Cao et al., 2002; Cao and Zhang, 2004; Hojfeldt et al., 2018; Kuzmichev et al., 2002; Montgomery et al., 2005; Muller et al., 2002; Pasini et al., 2004). In addition, proteomic interaction studies have identified that a set of non-core subunits, which have sub-stoichiometric association with core members, segregate into two distinct PRC2 subtypes (Hauri et al., 2016). PRC2.1 includes EPOP (Beringer et al., 2016; Liefke et al., 2016) or PALI (Alekseyenko et al., 2014; Conway et al., 2018) paired with a PCL paralog (PCL1, PCL2 or PCL3), and PRC2.2 includes JARID2 and AEBP2 (Hauri et al., 2016). The non-core subunits of PRC2 are also essential for normal development (Brien et al., 2012; Conway et al., 2018; Grijzenhout et al., 2016; Li et al., 2017; Liefke and Shi, 2015; Pasini et al., 2010), and while their specific roles in the complex are not clear, studies have shown that they can contribute to both genome localization and regulation of PRC2 catalytic activity (Choi et al., 2017; Cooper et al., 2016; Li et al., 2017; Margueron and Reinberg, 2011; Oksuz et al., 2018; Perino et al., 2018; Youmans et al., 2018).
The methylation activities of the PRC2 complex are widespread across the genome with more than 80% of all histone H3 proteins methylated on H3K27 (Jung et al., 2010; Peters et al., 2003). However, specific regions in the genome, which are stably occupied by the complex, experience the highest methylation kinetics and become marked by high levels of H3K27me3 (Hojfeldt et al., 2018; Ku et al., 2008; Tanay et al., 2007). These “peak” regions of PRC2 binding and H3K27me3 abundance correlate strongly with gene repression and provide a barrier against gene activation (Coleman and Struhl, 2017; Laprell et al., 2017). Therefore, it is of great interest to understand how PRC2 activities are directed preferentially to its target sites.
The target sites of PRC2 are CpG-dense regions, of which most have been classified as CpG islands (CGIs). PRC2 binds these regions by default, when they are not DNA-methylated and not transcribed (Jermann et al., 2014; Ku et al., 2008; Lynch et al., 2012; Mendenhall et al., 2010; Riising et al., 2014; Tanay et al., 2007; Wachter et al., 2014). These regions lack recurring sequence motifs and can be recapitulated by synthetic, non-evolved sequences, which indicates that sequence-specific transcription factors are not the primary recruiters of PRC2 activity (Jermann et al., 2014; Wachter et al., 2014). The functionally related Polycomb repressive complex 1 (PRC1) associates with the same regions of the genome as PRC2, and the two complexes may reciprocally reinforce each other’s binding (Blackledge et al., 2015; Boyer et al., 2006; Bracken et al., 2006). Regardless of which features of CGIs, including co-occupying complexes and histone marks, provide the template for PRC2 binding, the subunits and interaction surfaces within the PRC2 complex required for this recognition remain unclear.
Structural details for the PRC2 complex have been elucidated to a significant extent for the core subunits as well as for fragments of the non-core subunits (Figure 1A) (Chen et al., 2018; Ciferri et al., 2012; Jiao and Liu, 2015; Justin et al., 2016; Kasinath et al., 2018). The catalytic activity of PRC2 can be separated from the genome-localizing activity by splitting SUZ12 into two halves (Figure 1B). The C-terminal VEFS domain of SUZ12 is sufficient to form a minimal catalytic complex with EED and EZH1/2 that produces normal cellular levels of H3K27 methylation globally but in a pattern that is widely dispersed and lacks target site-directed H3K27me3 (Hojfeldt et al., 2018). In contrast, the N-terminal ΔVEFS portion of SUZ12, which lacks interaction with EZH1/2 and EED and ability to support any H3K27 methylation, localizes to the specific genomic target regions of PRC2 (Hojfeldt et al., 2018). Thus, the N-terminal part of SUZ12 is responsible for directing PRC2 to its peak binding regions, and this binding may well rely on non-core subunits. Recently, depletion of the non-core subunit PCL2 alone (Li et al., 2017; Perino et al., 2018), or in combination with JARID2 (Oksuz et al., 2018) or AEBP2 (Youmans et al., 2018), has been shown to have significant but incomplete consequences for PRC2 target efficiency. Thus, previous data have not demonstrated, if the non-core PRC2 subunits are required for or even contribute to target specificity, or if some or all of them primarily impact the efficiency of targeted PRC2 activity.
Figure 1: Individual non-core PRC2 subunits are dispensable for target site specificity.

A) Structure of PRC2 based on superimposition of two partial crystal structures, PDB ID: 5WAI (Chen et al., 2018) and PDB ID: 5LS6 (Vaswani et al., 2016) onto Cryo-EM structure, PDB ID: 6C23 (Kasinath et al., 2018). SUZ12 (yellow), EED (green), EZH2 (blue) with fragments of AEBP2 (red) and JARID2 (turquoise). PRC2.1 subunits are not part of this structure.
B) Top left: Structure of SUZ12 (yellow) from Figure 1A. Top middle: Structure of SUZ12 colored to highlight individual domains. Top right: Schematic drawing of SUZ12 with colored domains. Blue and pink shades indicate parts of SUZ12 required for catalytic activity (VEFS) or target localization (ΔVEFS). Bottom: Schematic drawing of domain architecture of SUZ12 with indication of boundaries (amino acid numbers) for the fragments used in this study. Dashed lines indicate structurally unresolved regions.
C) Western blot for PRC2 subunits of cell extracts (input) and anti-Flag immunoprecipitated material (Flag-IP) from the indicated cell lines (wildtype mESC (WT) or Suz12 KO mESC (KO) with ectopic expression of indicated Flag-tagged SUZ12 constructs).
D) Western blot for PRC2 subunits and H3K27 methylation, probing extracts prepared from the indicated knockout cell lines.
E) H3K27me3 and SUZ12 ChIP-seq signals for the indicated cell lines in a representative genomic region including the PRC2 target gene Prdm12. ChIP-seq signals are sequence-depth normalized (reads per kbp per million mapped reads (RPKM)). ChIP-seq signals in two other representative genomic regions are shown in Supplementary Figure 1. Mean signals in regions centered on SUZ12 peaks are shown in Figure S1D–E.
F) ChIP-qPCR signals for H3K27me3 (blue, left y-axis scale), SUZ12 (red), and IgG control (gray) (right y-axis scale) in WT, Suz12 KO and Pcl1–3 KO cell lines at PRC2 target sites (CGI promoters of Prdm12 and Fgf15) and control regions (intragenic Fubp3 and CGI-promotor of Fgf4) present in tracks shown in Figure 1E and Supplementary Figure 1. The transcriptional status and presence of overlapping CGI is indicated for each probed region. Data values come from a single biological (n = 1) experiment with two technical replicate values shown.
G) Mean SUZ12 (top) and H3K27me3 (bottom) ChIP-seq signals (RPKM) for WT, Suz12 KO and Pcl1–3 KO cell lines in regions centered on 7,796 SUZ12 peak regions identified in WT mESCs.
Here, we have carried out a comprehensive analysis of the role of six non-core subunits of PRC2 that bind to the N-terminal, localizing fragment of SUZ12. By generating single and combinatorial knockout (KO) mouse embryonic stem cell (mESC) lines, we show that each of the non-core subunits contribute to target-specific activity and are collectively required. The PCL2 subunit provides the strongest contribution to target site binding but is unable to bind independently of core PRC2, which does not support its proposed role as an autonomous recruiter of PRC2 (Li et al., 2017; Perino et al., 2018). Furthermore, we show that a bulk part of cellular H3K27me3 exists in a pattern of low-level, dispersed H3K27me3 that is unperturbed by disruption of PRC2 target-localizing mechanisms. Taken together, these results show that the six non-core subunits of PRC2 in association with the N-terminal part of SUZ12 are required for directing PRC2 to its target sites.
Results
Individual non-core PRC2 subunits are dispensable for target site specificity
In order to identify which non-core PRC2 subunits interact with the N-terminal SUZ12ΔVEFS, and thus are candidates to participate in or mediate PRC2 recruitment to target sites, we expressed Flag-tagged SUZ12 fragments in Suz12 KO mESCs. Immunoprecipitation of the VEFS and ΔVEFS fragments of SUZ12 showed that the VEFS domain interacts with the core subunits EZH2 and EED, while ΔVEFS interacts with the non-core PRC2 subunits (Figure 1C). This is in agreement with recent structural and biochemical studies (Chen et al., 2018; Kasinath et al., 2018). As observed for core subunits EZH2 and EED (Hojfeldt et al., 2018; Pasini et al., 2004), three of the non-core subunits, AEBP2, EPOP and PCL2, are destabilized in Suz12 KO cells, showing that they are likely dependent on complex association for proper folding (Figure 1D). To understand the role of each of the non-core subunits for the recruitment of PRC2, we knocked out the genes encoding each of the subunits, PCL2 (the primary PCL homolog in mESCs), EPOP, JARID2, or AEBP2. Since knockout of each factor did not change the expression levels of the other PRC2 subunits, we can directly measure the contribution of each non-core subunit to PRC2 recruitment (Figure 1D). As shown in Figure 1D, none of the non-core subunits are required for maintaining normal global H3K27 methylation levels, and only Pcl2 KO led to a decrease in SUZ12 binding to target sites and mildly affected deposition of H3K27me3 in these target regions (Figure 1E, Figure S1).
Recently, it has been proposed that the PCL proteins, through direct DNA binding, are responsible for all PRC2 recruitment to target sites, and that the remaining PRC2 binding and localized H3K27me3 observed in Pcl2 KO mESCs is facilitated by PCL homologs 1 and 3 (Li et al., 2017; Perino et al., 2018). To address this, we generated Pcl1–3 triple KO mESCs. The analysis of these cells showed little if any additive effects compared to Pcl2 KO alone (Figure 1E, Figure S1). Thus, while the PCL proteins contribute to detectable binding of PRC2 to target regions, they are not essential and have only moderate effects on H3K27 methylation at the target sites (Figure 1E–G, Figure S1).
PCL2 binding to PRC2 target sites is dependent on SUZ12
The PCL proteins bind SUZ12 via its C2 domain (Chen et al., 2018), which appears as an independently folded domain with a proximal entry and exit site into the domain and without significant interaction with other parts of the core complex (Figure 1B) (Chen et al., 2018). This prompted us to attempt a dissection of the domain to probe its role in PRC2 recruitment. Both the C2 domain and SUZ12ΔC2 behaved as well-expressed fragments in Suz12 KO mESCs, and we used co-immunoprecipitation to identify their respective interaction partners. The C2 domain was sufficient to bind PCL2 in vivo, while the other PRC2.1 subunit, EPOP, bound to SUZ12ΔC2. The PRC2.2 subunits, JARID2 and AEBP2, did not bind efficiently to either fragment, but some detectable weak binding was observed with SUZ12ΔC2 (Figure 2A). To address if the C2 domain of SUZ12 is sufficient to bind to PRC2 target regions, we performed genome-wide ChIP-seq experiments using chromatin prepared from FLAG-tagged C2- and SUZ12ΔC2-expressing mESCs, respectively. Neither the C2 domain nor the SUZ12ΔC2 bound efficiently at PRC2 target sites, although a weak binding was detected for the C2 domain (Figure 2B–C and S2A). SUZ12ΔC2 supported full global H3K27me3 level (Figure 2D), which is in agreement with previous results showing that the VEFS domain is sufficient for full catalytic activity in vivo (Hojfeldt et al., 2018). Interestingly, H3K27me3 was still significantly enriched at PRC2 target sites in the SUZ12ΔC2-expressing mESCs (Figure 2E–F and S2A) despite no detectable binding observed of this SUZ12 fragment (Figure 2B–C). Thus, significant directed PRC2 activity remains in the SUZ12ΔC2-expressing mESCs despite the loss of PCL interaction and weak binding of the PRC2.2 subunits, JARID2 and AEBP2.
Figure 2: PCL2 binding to PRC2 target sites is dependent on SUZ12.

A) Western blot for PRC2 subunits of cell extracts (input) and anti-Flag immunoprecipitated material (Flag-IP) from the indicated cell lines (wildtype mESC (WT) or Suz12 KO mESC (KO) with ectopic expression of Flag-tagged SUZ12 fragments). Fragment boundaries are shown in Figure 1B.
B) Flag ChIP-seq signals (RPKM) from indicated cell lines expressing Flag-tagged SUZ12 constructs within a representative genomic region that includes the PRC2 target gene Prdm12. ChIP-seq signals in other representative genomic regions are shown in Supplementary Figure 2A.
C) Mean Flag ChIP-seq signals (RPKM) for WT mESC (no Flag) or Suz12 KO mESC with ectopic expression of Flag-tagged SUZ12 constructs in regions centered on 7,798 SUZ12 peak regions identified in WT mESCs.
D) Western blot for H3K27me3 (with H4 as a loading control) in extracts from the indicated cell lines.
E) H3K27me3 ChIP-seq (RPKM) signals within a representative genomic region from indicated cell lines. ChIP-seq signals in other representative genomic regions are shown in Supplementary Figure 2A.
F) Mean H3K27me3 ChIP-seq signals (RPKM) for WT mESC or Suz12 KO mESC with ectopic expression of Flag-tagged SUZ12 constructs in regions centered on 7,796 SUZ12 peak regions identified in WT mESCs.
G) PCL2 ChIP-seq signals (RPKM) from indicated cell lines within a representative genomic region that includes the PRC2 target gene Prdm12. ChIP-seq signal in other representative genomic regions are shown in Supplementary Figure 2B.
H) Mean PCL2 ChIP-seq signals (RPKM) from indicated cell lines in 7,796 SUZ12 peak regions identified in WT mESCs.
It has been proposed that the PCL proteins can bind preferentially at CGIs via CpG-dinucleotide recognition by their EH domain (Li et al., 2017) or through recognition of distinct DNA shapes (Perino et al., 2018), and further that this binding is the origin of their support of PRC2 target binding. To investigate the interaction between PCL proteins and Polycomb target genes in vivo, we mapped the genome-wide binding of PCL2 in mESCs. In agreement with published data (Li et al., 2017), PCL2 showed a strong overlap with SUZ12 binding sites, but was lost in Suz12 KO cells (Figure 2G–H and S2B). However, since loss of SUZ12 strongly affected PCL2 protein stability (Figure 1D), it is difficult to assess the binding ability of PCL2 in the absence of SUZ12. Importantly, the expression of the SUZ12 C2 domain in Suz12 KO cells led to the stabilization of PCL2 with intact nuclear presence (Figure S2C), but this did not lead to significant binding of PCL2 at PRC2 target sites (Figure 2G–H). Therefore, in contrast to what has been suggested, PCL2 cannot bind to Polycomb-regulated genes by itself in vivo, but depends on SUZ12 for its binding.
PRC2.1 and PRC2.2 bind overlapping genomic sites independently
Proteomic interaction studies have revealed that the PRC2 non-core subunits segregate into two separate complexes (Hauri et al., 2016). The genomic binding patterns for subunits from each subcomplex are overlapping and suggest that PRC2.1 and PRC2.2 generally share the majority of their binding sites (Beringer et al., 2016; Li et al., 2010; Liefke et al., 2016). A potential interdependency between the two subcomplexes have not yet been fully explored, although knockout of the PRC2.1 subunit EPOP was shown not to affect binding of PRC2.2 subunit JARID2 (Beringer et al., 2016). We have specifically explored if Pcl2 knockout, which has a significant impact on SUZ12 binding, affects JARID2 binding. We confirmed the overlapping genomic distribution of PCL2 (a PRC2.1 subunit) and JARID2 (a PRC2.2 subunit) at sites, which also overlap SUZ12 binding (Figure 3). Knockout of Pcl1–3 led to a reduction in SUZ12 binding, without significant reduction in JARID2 binding (Figure 3B and S3A). Conversely, Jarid2 KO had no detectable effect on PCL2 binding or SUZ12 binding (Figure 3B and S3A). By peak calling analyses, we found a large number of PCL2 binding sites that were not called as SUZ12 or JARID2 peaks. However, these PCL2 binding sites contained detectable binding of SUZ12 and JARID2, and PCL2 binding was lost at these sites in Suz12 KO cells (Figure S3B). Based on these results, we suggest that the differential number of called peaks is primarily a result of differential signal-to-noise in the ChIP experiments influenced by different antibodies, antigen visibility, and cross-linking efficiencies for the three proteins. We therefore conclude that PRC2.1 and PRC2.2 overlap is a general feature, and that each complex binds the target sites independently of the other. We investigated if certain regions are differentially dependent on JARID2 or PCL2, by comparing H3K27me3 signal of the respective knockout cell lines. Irrespective of H3K27me3 signal, regions with a relative higher ratio of JARID2 to PCL2 showed a slightly stronger loss in H3K27me3 signal upon Jarid2 KO, and, conversely, the PCL2 relative-enriched regions showed the largest effect of a Pcl2 KO (Figure S3C). Thus, differential regional contributions of PRC2.1 and PRC2.2 exist but are not very pronounced.
Figure 3: PRC2.1 and PRC2.2 binding sites overlap.

A) SUZ12, H3K27me3, PCL2 and JARID2 ChIP-seq signals (RPKM) from the indicated cell lines within a representative genomic region that includes the PRC2 target gene Prdm12.
B) Heatmaps of SUZ12, PCL2 and JARID2 ChIP-seq signals (RPKM) from the indicated cell lines, sorted according to peak-calling statistical strength (FDR) for the 7,796 identified SUZ12-positive peaks. Horizontal axis shows a 20,000 bp window centered on SUZ12 peaks.
PRC2 non-core subunits are collectively required for directing H3K27me3 at target regions
Given that PRC2.1 and PRC2.2 bind target sites independently of each other, the non-core subunits either provide redundant modes of PRC2 recruitment or are simply not required for localization of the core complex. To probe their requirement for PRC2 recruitment, we performed combinatorial knockout of the non-core subunits. Knockout of non-core subunits, even all four types together, had no significant effect on global H3K27me3 levels (Figure 4A). This is in agreement with our published results showing that PRC2 does not need the ΔVEFS portion of SUZ12, which interacts with the non-core subunits and ensures association with target regions, to maintain normal levels of H3K27me3 (Højfeldt et al, 2018). Combined knockout of Pcl1–3 and Epop (removing the PRC2.1 subunits) significantly affected SUZ12 binding, but had a modest effect on H3K27me3 deposition (Figure 4B–D), similar to the effects of Pcl1–3 KO (Figure 1E–F). Removal of the PRC2.2 subunits through combined knockout of Aebp2 and Jarid2 had little effect on either SUZ12 binding or H3K27me3 pattern, as was observed for their individual knockouts (Figure 1E–F and 4B–D). Knockout of Jarid2 and Pcl1–3, decreased SUZ12 binding to near background levels (Figure 4B–D). H3K27me3 at target sites was also affected, but a significant site-specific pattern remained. Additional knockout of Aebp2 affected H3K27me3 slightly further, while the combined knockout of all six non-core subunits brought the H3K27me3 signal on PRC2 target regions to near background levels, with little if any pattern remaining (Figure 4B–D, Figure S4A–B). Concurrent with the progressive loss of H3K27me3 in the different combinations of subunit knockouts, H3K27me2 enrichment at two PRC2 target sites was increased (Figure S4C). Thus, PRC2 activity is still present but is insufficient for conversion of H3K27me2 to H3K27me3. The loss of PRC2 binding and deposition of H3K27me3 also reduced the occupancy of the Polycomb repressive complex 1 (PRC1) core-subunit, RING1B (Figure S4D), consistent with proposed models of H3K27me3-dependent recruitment of CBX-containing, canonical PRC1 complexes (Cao et al., 2002; Scelfo et al., 2019) constituting a significant fraction of PRC1 at target sites (Fursova et al., 2019). Taken together, our results show that the non-core subunits are collectively required for directing tri-methylation activity to PRC2 target regions.
Figure 4: PRC2 non-core subunits are collectively required for PRC2 binding.

A) Top: Reference legend for cell lines used in Figure 4. Bottom: Western blot for PRC2 subunits and H3K27 methylation, probing extracts of the indicated knockout cell lines.
B) ChIP-qPCR signals (% of input) for H3K27me3 (blue, left y-axis scale), SUZ12 (red), and IgG control (gray) (right y-axis scale) in the indicated cell lines at PRC2 target sites (CGI promoters of Prdm12 and Fgf15) and control regions (intragenic Fubp3 and CGI-promotor of Fgf4) present in tracks in Figure 4C and Supplementary Figure 4. The transcriptional status and presence of overlapping CGI is indicated for each probed region. The ChIP-qPCR values come from a single biological (n = 1) experiment with two technical replicate values shown.
C) H3K27me3 and SUZ12 ChIP-seq signals (RPKM) from indicated cell lines within a representative genomic region that includes the PRC2 target gene Prdm12. ChIP-seq signals from a replicate experiment and for two other representative genomic regions are shown in Supplementary Figure 4.
D) Mean H3K27me3 (left) and SUZ12 (right) ChIP-seq signals (RPKM) for indicated cell lines in regions centered on 7,796 SUZ12 peak regions identified in WT mESCs.
Dispersed and recruitment-dependent populations of H3K27me3 regions
H3K27me3 at PRC2 target regions is lost in cells expressing a minimal catalytic PRC2 complex consisting of the SUZ12 VEFS domain, EED and EZH2 (Hojfeldt et al., 2018). Similarly, we have found here that cells with knockout of all non-core subunits, retain normal global levels of H3K27me3. To provide an overview of the distribution of all the H3K27me3 in mESCs, we quantified H3K27me3 ChIP-seq reads obtained in WT cells within 5kbp regions spanning the entire genome. A rank-ordered plot of these regions shows a sharp increase in read density for the top 5% of regions and most SUZ12 peaks overlap with these regions (Figure 5A). Despite the top regions having distinctly higher H3K27me3 density, a large fraction of the H3K27me3 reads are distributed throughout the genome. The middle 50% of ranked 5kbp regions, for example, contain 40% of H3K27me3 reads, but only 7% of the detectable SUZ12 peaks. The difference in H3K27me3 read density from the lowest to middle ordered regions does not reflect a ChIP or mapping bias, as the read density in negative control samples, H3K27me3 ChIP in H3K27me3-devoid Suz12 KO cells, are distributed evenly across the ordered regions (Figure S5A).
Figure 5: Dispersed and recruitment-dependent populations of H3K27me3 regions.

A) Plot of average H3K27me3 signal (RPKM) within 5kbp regions spanning the entire genome. Regions are ordered based on increasing H3K27me3 density in WT cells. The ordered regions are divided into percentile groups (alternating gray and white). The bottom (Bot5) and top (Top5) percentile regions are marked, as well as the middle 50 percentiles (Mid50). Above graphs, each region is annotated with the percentage of total SUZ12 peak overlaps that belong to the region, and percentage of total H3K27me3 reads (with Bot5 used to approximate non-specific background reads and set to zero) within the region. Mean values of two replicate experiments (n = 2) are used.
B) Box plot of H3K27me3 read densities (RPKM) for the Bot5, Mid50 and Top5 regions defined in panel A for the indicated cell lines (color coded). Boxes extend from first to third quartile with a band marking the median. Whiskers extend to values up to 1.5 interquartile distances from box, and all additional values outside of this range are marked with circles. Mean values of two replicate experiments (n = 2) are used.
C) H3K27me3 and SUZ12 ChIP-seq signals (RPKM) from indicated cell lines within a representative 1Mbp genomic region that include different types of H3K27me3 regions marked above tracks. Genomic coordinates and genes that lie within the shown region are marked below tracks.
Box plots showing read densities for various non-core subunit KO mESCs in the top and bottom five percentiles (Top5 and Bot5) of regions as well as the middle 50 (Mid50) percentile regions reveal that non-core subunits only affect read densities in the regions with highest H3K27me3 read density, while regions with lower levels of dispersed H3K27me3 are unaffected or slightly increased (Figure 5B and S5B). For mESCs with knockout of all non-core subunits (Pcl1–3 + Epop + Jarid2 + Aebp2 KOs), the H3K27me3 density in Top5 regions has fallen to a level that matches the dispersed level of Mid50 regions, and the redistribution closely matches that of Suz12 KO cells expressing the VEFS domain of SUZ12 (Figure 5B). The different types of H3K27me3 regions can be visualized in ChIP-seq tracks of a representative 1Mbp region (Figure 5C): The HoxA gene cluster and a short region at the JazF1 promoter are occupied by SUZ12 in WT cells and have high H3K27me3, which is lost progressively as non-core subunits are knocked out. Regions on either side of the Hibadh gene, reveal a low level of H3K27me3 that is distinguishably higher than background level (e.g. inside the Hibadh gene), and this dispersed H3K27me3 remains unchanged in all non-core subunit knockout cells. ChIP-qPCR analyses validate the presence of regions with: 1) high-level and recruitment-dependent H3K27me3; 2) regions with mid-level H3K27me3, which does not associate with SUZ12 binding and is not reduced in non-core subunit knockout cell lines; 3) regions with background levels of H3K27me3 (Figures 4B and S5C). Our analyses demonstrate that the N-terminal part of SUZ12, in association with the non-core subunits of PRC2, serves to ‘focus’ PRC2 binding and activity to specific CpG-rich regions of the genome to provide these target regions with high level of H3K27me3. They also show that the bulk of total H3K27me3-positive histones lies outside of these target regions dispersed at a low level in most regions and with no detectable binding of PRC2.
Each of the non-core PRC2 subunits contributes to target-specific H3K27me3
So far, our analyses have shown that knockout of the genes encoding individual non-core subunits had limited (PCL1–3) or almost no (EPOP, JARID2, AEBP2) detectable effect on H3K27me3 deposition at PRC2 target regions (Figure 1), whereas knocking out all six non-core subunits led to a dramatic reduction (Figure 4 and Figure 5). These results do not reveal the contribution of each of the non-core subunits in the absence of the others, however. To test this, we made four different knockout combinations that left each non-core subunit, respectively, as the only remaining member to interact with core PRC2 (Figure 6A). Consistent with a significant effect of knocking out Pcl1–3, the presence of PCL1–3 facilitated detectable SUZ12 binding at target sites (Figure 6B–C and S6A). PCL2 interacts with SUZ12 through its reversed chromodomain (Ballare et al., 2012). We found that this domain and its interaction with SUZ12 is not sufficient to rescue target site binding for SUZ12 (Figure S6B–F) confirming the critical role of its other domains for this function (Casanova et al., 2011; Choi et al., 2017; Li et al., 2017; Perino et al., 2018). Although partial SUZ12 binding was detected in Pcl1–3 KO cells (Figure 1E–G), which was shown to be dependent on JARID2 (Figure 4C), JARID2 was insufficient to facilitate this SUZ12 binding as the only remaining auxiliary subunit (Figure 6B–D and S6A). While we did not observe an increase of SUZ12 binding with any single non-core subunit other than the PCL proteins, they were all sufficient to provide a partial degree of target-directed H3K27me3 deposition (Figure 6B–D and S6A). We found that each non-core subunit generally directed trimethylation activity to a shared set of regions (Figure S7A–B), but with some degree of regional preferences identified by cluster analysis (Figure S7C–E). More strikingly, the PCL2-directed H3K27me3 deposition was restricted to the SUZ12 peak region while H3K27me3, directed by the other three subunits, was deposited preferentially in the flanking regions. This is consistent with the distribution of H3K27me3 across peak regions observed for other combinatorial knockout cell lines (Figure 1G and 4D) and is not explained by differences in local occupancy of JARID2 or PCL2 (Figure 3B and S7G). These results show that each of the non-core PRC2 subunits can individually contribute to the target-specific H3K27 trimethylation of Polycomb targets.
Figure 6: Each of the non-core PRC2 subunits contributes to target specific H3K27me3.

A) Western blot for PRC2 subunits and H3K27 methylation of extracts from indicated mESC lines, which are knockout for all except the indicated subunit(s).
B) H3K27me3 and SUZ12 ChIP-seq signals (RPKM) from indicated cell lines within a representative genomic region that includes the PRC2 target gene Prdm12. Genomic coordinates for the region and genes that lie within are indicated below the graph.
C) ChIP-qPCR signals (% of input) generated with H3K27me3 (blue, left y-axis scale), SUZ12 (red), and IgG control (gray) (right y-axis scale) antibodies for indicated cell lines at PRC2 target sites (CGI promoters of Prdm12 and Fgf15) and control regions (intragenic Fubp3 and CGI-promotor of Fgf4) present in tracks in Figure 6B. The transcriptional status and presence of overlapping CGI is indicated for each probed region. Data values come from a single biological (n = 1) experiment with two technical replicate values shown.
D) Box plot of H3K27me3 read densities (RPKM) for the Bot5, Mid50 and Top5 regions identified in Figure 5A for the indicated mESC lines, which are knockout for all except indicated subunit(s) (color coded). Boxes extend from first to third quartile with a band marking the median. Whiskers extend to values up to 1.5 interquartile distances from box, and all additional values outside of this range are marked with circles.
Loss of PRC2 target site-specific H3K27me3 causes derepression of many PRC2 target genes
Knockout of Ezh1 and Ezh2, which causes complete loss of PRC2 catalytic activity, leads to derepression of a large number of genes in mESCs (Hojfeldt et al., 2018). We investigated the gene expression changes of Suz12 knockout mESCs, in which both SUZ12 binding and H3K27 methylation is abrogated, and found differential expression of 1,602 genes out of which the majority (1,322 = 83%) are derepressed and enriched (955 out of 1,322) for PRC2 target genes (genes with SUZ12 ChIP-seq peak in promotor region, TSS +/− 2500 bp) (Figure 7A–B). Knockout of Pcl1–3, the combined knockout of PRC2.1 subunits Pcl1–3 and Epop, or PRC2.2 subunits Jarid2 and Aebp2 caused derepression of only 23, 22 and 4 PRC2 target genes, respectively. Significantly more PRC2 target genes were derepressed in cells with combined Pcl1–3 and Jarid2 knockout (129 target genes) or combined Pcl1–3, Jarid2 and Aebp2 knockout (103 target genes) (Figure 7B), in which SUZ12 binding was nearly lost and H3K27me3 was significantly reduced at PRC2 target sites (Figure 4B–D and 5B–C). Knockout of all non-core subunits (Pcl1–3 + Epop + Jarid2 + Aebp2 KOs) led to derepresson of 429 PRC2 target genes, out of which 246 are shared with Suz12 KO cells (Figure 7B–C). Thus, a large fraction of the gene expression changes that occur in cells completely depleted of PRC2 and H3K27 methylation (me1, me2 and me3) are shared with cells, where just the H3K27me3 within PRC2-bound target sites is lost.
Figure 7: Loss of PRC2 target site-specific H3K27me3 causes derepression of many PRC2 target genes.

A) Overlap between genes that are differentially expressed in Suz12 knockout versus WT cells (DEseq2, fold change > 1.5, padj < 0.1), protein coding genes of the Gencode version M21 gene annotation and PRC2 target genes defined by presence of SUZ12 ChIP-seq peak within 2500bp of TSS.
B) Bar graph of the number of differentially expressed genes that are upregulated (top) or downregulated (bottom) for each of the indicated cell lines compared to WT cells (DEseq2, fold change > 1.5, padj < 0.1). The number of genes, which are also PRC2 target genes are marked with blue in the bar graph and written above bar in parenthesis.
C) An Euler-diagram of the overlap between upregulated PRC2 target genes in indicated cell lines.
Discussion
The most prominent feature of the H3K27me3 distribution pattern deposited by PRC2 is the existence of regions with very high methylation levels that are also the only regions where the PRC2 complex itself is detected with high occupancy (Ku et al., 2008). Here, we have shown that six non-core PRC2 subunits, which interact with the N-terminal part of SUZ12 that is necessary for target localization, are collectively required for PRC2 activity at target regions. Demonstration of this requirement has previously remained elusive, because each subunit provides a level of redundancy to PRC2 targeting.
Individual and overlapping roles of non-core subunits
We have found that each of the non-core PRC2 subunits independently provided target specificity to PRC2. Each subunit was able to, together with core PRC2, direct selective deposition of H3K27me3 at native PRC2 target regions, although none of them were sufficient to support full methylation efficiency of the target regions. The PCL2 subunit provided the highest methylation level, and was the only individual subunit that led to detectable binding of PRC2 at target regions. PRC2.2 with both its subunits also supported detectable binding of PRC2 to target regions, but neither JARID2 nor AEBP2 supported this feature alone.
It is a shared set of target regions to which each non-core subunit specifically directs H3K27me3 deposition, illustrating a significant redundancy among the non-core subunits in their support of target specificity. The strong genomic overlap and ability of PRC2.1 and PRC2.2 to individually support near-normal methylation patterns raise questions concerning the need for two distinct PRC2 complexes expressed in mESCs that can both direct high levels of H3K27me3 to PRC2 target regions. The partial redundancy between the two complexes may be critical to support sufficient PRC2 targeting during development, where expression levels of the different subunits fluctuate, and may also explain the later embryonic lethality reported for mice with non-core subunit knockouts as compared to Suz12, Ezh2, and Eed KO mice (Laugesen and Helin, 2014). It remains to be elucidated whether the two types of PRC2 complexes have non-redundant functions that could underlie critical biological manifestations.
Distinct mechanistic properties of non-core subunits
How the individual non-core proteins confer target specificity to core PRC2 is of great interest. Each of the non-core proteins may provide different interactions with CGIs or co-occurring proteins and marks, such as the suggested CGI preference for PCLs (Li et al., 2017) or the PRC1-deposited H2AK119ub1 mark for JARID2 (Cooper et al., 2016). In contrast to what has been suggested (Li et al., 2017; Perino et al., 2018), our results do not support a model where PCL2 binds independently to CGIs in order to recruit PRC2. It has been suggested that the DNA binding ability of the PCLs does not provide binding specificity, but enhances DNA binding of PRC2 in a non-sequence specific manner (Choi et al., 2017), which is in line with our results showing that PCL2 does not function as an autonomous recruiter but depends on SUZ12 for its binding to PRC2 target regions.
Like JARID2 and AEBP2 alone, EPOP also directed H3K27me3 deposition to target sites without detectable SUZ12 binding. Since PRC2 methylation activity can be directed to target sites without detectably complex binding, we speculate whether it reflects a different interaction proximity to DNA for different modes of target site localization. A more direct association with DNA would increase formaldehyde cross-linking efficiency in the ChIP experiments, which could be a limiting factor for detection of complex occupancy. The PCL proteins have been proposed to bind directly to DNA and stabilize the association of PRC2 with chromatin, and a close DNA association may underlie the detection of SUZ12 binding in mESCs expressing only PCLs and core PRC2. Direct DNA binding may also explain the large number of significant peaks that can be identified in a PCL2 ChIP-seq analysis, compared to the SUZ12 or JARID2 ChIP-seq analyses. In general, it remains to be clarified which of the potential interactions between PRC2 and target site features, provide target specificity or primarily support efficiency.
The four types of non-core subunits present in PRC2.1 and PRC2.2 do not have shared regions of homology, yet they are enriched at the same genomic sites and all confer some degree of target site recognition to the PRC2 complex. It is possible that the engagement of each factor with SUZ12 could influence the structure of SUZ12 to induce a common SUZ12 fold that directly mediates interaction with features at target sites. However, as seen in structural studies, and as we observed in interaction studies with the SUZ12 C2 domain and SUZ12ΔC2, the non-core subunits each have different binding surfaces on SUZ12. Furthermore, we showed that the SUZ12-interacting domain of PCL2 is insufficient for enabling SUZ12 binding at genomic target sites. More detailed dissection of each of the mechanistic properties of the non-core subunits and their interplay with SUZ12 will therefore be necessary to understand their contribution to PRC2 target specificity.
Establishment and functional significance of H3K27me3 outside of PRC2 target regions
By analyzing the distribution of total H3K27me3 throughout the genome, we have found that a large fraction is diffusely associated with regions outside PRC2 target sites. The enrichment of H3K27me3 in the diffusely spread regions is on average four to five-fold lower than in target regions, but these regions of dispersed H3K27me3 are more numerous and contain the bulk of cellular H3K27me3. The slight increase in H3K27me3 in these regions upon H3K27me3 loss from PRC2 target regions can account for the unchanged global levels of H3K27me3 measured in cells with disrupted target localization.
Our data clearly illustrate that H3K27me3 can be catalyzed without detectable binding of PRC2, both in PRC2 target regions (in several subunit KOs) and in regions with dispersed H3K27me3. Whether these interactions with its chromatin substrate are too transient or of a nature escaping efficient cross-link-capture, our findings challenge the notion that long PRC2 residence time is a requirement for the formation of H3K27me3. This is in line with the loss of long-residence interactions upon disruption of localizing capacity of PRC2 without changes to global H3K27me3 and the dispersed H3K27me3 population (Hojfeldt et al., 2018; Youmans et al., 2018).
It will be interesting to understand, if the low H3K27me3 level that is independent of the localizing ability and without stable binding of PRC2 carries a functional significance, and, otherwise, what determines the threshold for functional H3K27me3. Reduction of target site specific H3K27me3 was sufficient to reduce RING1B occupancy and was also sufficient to cause derepression of many PRC2 target genes.
Concluding remarks
Collectively, our results provide novel insight into the cellular distribution of H3K27me3 and raises important questions about the functional role and distinct dependencies of different types of H3K27me3 over the genome. We show that the non-core subunits individually contribute to and are collectively required for directing PRC2 activity to target regions. Future genetic and structural dissection of the non-core subunits will hopefully reveal how they enable SUZ12 to engage with specific target site features and, amid dispersed H3K27me3, locally focus PRC2 activity.
STAR Methods
LEAD CONTACT AND MATERIALS AVAILABILITY
Further information and requests for resources and reagents should be directed to and will be fulfilled by the Lead Contact, Kristian Helin (helink@mskcc.org).
EXPERIMENTAL MODEL AND SUBJECT DETAILS
Mouse embryonic stem cells (mESCs)
129B6F1 mESCs (male genotype, XY) were cultured on gelatin-coated dishes in 2i/LIF-containing medium (1:1 mix of DMEM/F12 and Neurobasal media (Gibco), supplemented with 1x Pen-Strep (Gibco), 2 mM Glutamax (Gibco), 50 μM β-mercaptoethanol (Gibco), 0.1 mM Non-essential amino acids (Gibco), 1 mM Sodium Pyruvate (Gibco), N2+B27 (ThermoFisher), GSK3i (CHIR99021), MEKi (PD0325901) and Leukemia Inhibitory Factor (LIF, produced in the lab). Cells were passaged every 2(−3) days by removal of medium, wash in PBS, dissociation by Accutase (Sigma) with gentle disruption of colonies by pipetting, resuspension in medium and pelleting by centrifugation, followed by resuspension and plating at a density of app. 1 mio cells/10 cm dish.
Drosophila melanogaster S2 cells
Drosophila S2 cells (male genotype) were cultured in M3 media (Sigma), supplemented with 0.5 g/L KHCO3 (Sigma), 1 g/L Yeast Extract (Sigma) and 2.5 g/L Bacto Peptone (BD Biosciences), 1x Pen-Strep (Gibco), 10% FBS (HyClone).
METHOD DETAILS
Establishment of knockout cell lines
Knockout mESC lines were generated by CRISPR-Cas9n targeting in wildtype mESCs (129B6F1 background) and knockout cells were used as parental cells in knockout combinations. Single guide RNAs (sgRNAs) were used to generate knockout by frameshift mutations or a combination of two sgRNAs were used to generate knockout by large deletions. Resulting clones were PCR-screened, western blot verified, and genomic DNA was PCR-amplified and sequenced to verify targeting. Overview of cell lines with indication of sgRNA sequences available in Table S1.
Transgenic expression in mESCs
For rescue experiments, pCAG or piggyBAC vectors encoding Flag-HA-tagged human SUZ12 constructs generated by site-directed mutagenesis (Q5 SDM kit, New England Biolabs) were transfected into mESCs using Lipofectamine 3000 (Thermo Fisher). Stable clones were derived through puromycin-selection (pCAG vector) or blasticidin selection (piggyBAC vector) and expansion of single clones with stable integration of the construct.
Western blotting
Lysates of mESCs were prepared in TOPEX+ buffer (50 mM Tris-HCl pH 7.5, 300 mM NaCl, 0.5% Triton X-100, 1% SDS, 1 mM DTT, 33.33 U/ml Benzonase with Halt Protease Inhibitor cocktail (Roche)) and Western blotting was carried out with the primary antibodies listed in Table S2 and HRP-conjugated secondary antibodies (Vector Laboratories). Bands were visualized using Super Signal West Pico chemiluminiscent ECL substrate (Thermo Scientific) for exposing Amersham hyperfilm ECL films (GE Healthcare), which were developed (Ferrania Imaging Technologies).
Sub-cellular fractionation
mESCs were swelled in Buffer A (10 mM Tris-HCl pH 7.9, 10 mM KCl, 1.5 mM MgCl2 with Halt protease inhibitor cocktail (Roche)) and lysed with 0.2% NP40. Supernatant (cytoplasmic fraction) was collected and washed nuclei were lysed in Buffer C (20 mM Tris-HCl pH 7.9, 420 mM NaCl, 2 mM MgCl2, 0.2 mM EDTA, 0.5 mM DTT, 20% Glycerol, 0.1% NP40). Supernatants (nucleoplasmic fraction) were collected, and pellets (chromatin fraction) washed in Buffer C, lysed in TOPEX+ buffer with sonication (Diagenode Bioruptor). Western blotting was performed on whole cell lysates and cellular fractions from equal cell numbers.
Immunoprecipitation
Whole cell lysates of Suz12 KO mESCs expressing Flag-tagged SUZ12 constructs were prepared in High Salt buffer (300 mM NaCl, 50 mM Tris-HCl pH 7.5, 0.50% Triton X-100 with Halt Protease Inhibitor cocktail (Roche)) and each IP was carried out on 1 mg lysate with anti-Flag M2 beads (Sigma Aldrich) (or protein G beads (GE Healthcare) as a negative control). Precipitated proteins were eluted from the beads by addition of 50 μl 0.5 mg/ml Flag-peptide (sequence: DYKDDDDK).
Chromatin immunoprecipitation (ChIP)
ChIP experiments were carried out according to standard protocols. Chromatin was cross-linked by addition of 1% formaldehyde (Sigma-Aldrich), either in single cell suspension or directly in the dish and DNA sheared to 200–500 bp fragments by sonication (Bioruptor, Diagenode). Each ChIP was carried out using 50–200 μg of chromatin from mESCs with spike-in of 5% Drosophila chromatin (from S2 cells, prepared in the same manner) and 4 μg of the indicated antibodies (Table S2). Primer sequences for qPCR analysis are found in Table S3, and individual values of technical replicates of qPCR data is plotted as percent of input DNA.
Libraries for ChIP-seq analysis were built using NEBNext Ultra II kit (New England Biolabs) according to the manufacturer’s specifications with Ampure XP beads (Beckman) for the size selection step. Libraries were sequenced on Illumina NextSeq 550 (75bp single-end).
Processing and analysis of ChIP-seq data
Reads were processed within the Galaxy environment (Afgan et al., 2016). Reads were trimmed with Trimmomatic (Bolger et al., 2014) using illuminaclip, crop (to 73bp) and sliding window trimming with standard settings. Trimmed reads were mapped to mouse (mm10) or Drosophila (dm3) genomes using Bowtie2 (Langmead and Salzberg, 2012) using (--sensitive) preset settings. Duplicate mouse mapped reads were removed.
Mapped reads were visualized and analyzed with EaSeq (Lerdrup et al., 2016). ChIP-seq tracks and mean signal plots show signal segmented in 400 bins without further smoothening. Heatmaps show signal segmented in 200 bins for regions surrounding ChIP-seq peaks, which were ordered according to FDR value from ChIP-seq peak calling analysis. Peak calling was done with EaSeq’s Adaptive Local Thresholding (Window size 100 bp, merge peaks within 100 bp, FDR < 0.00001, log2-fold difference > 2) based on SUZ12, JARID2 or PCL2 ChIP-seq reads from WT mESCs (129B6F1) with reads from Suz12 KO, Jarid2 KO or Pcl1–3 KO cells (129B6F1), respectively, used as negative controls. This yielded 4,991 JARID2 peaks and 20,003 PCL2 peaks. SUZ12 peaks were called from two replicate ChIP-seq experiments, and a common set of 7,796 SUZ12 peaks were obtained. Scatterplots show values from quantification of H3K27me3 signal within SUZ12 peak regions normalized as reads per million mapped reads per 1 kbp (RPKM). Pseudocoloring on scatterplots is based on quantification of JARID2 and PCL2 ChIP-seq reads in SUZ12 peak regions (RPKM), followed by relative normalization for each to its own average across all peaks. The log2 transformed ratio of the resulting values (for each region: log2((PCL2 RPKM / average PCL2 RPKM) / (JARID2 RPKM / average JARID2 RPKM)) were used.
Box plots contain values from quantification of H3K27me3 reads within non-overlapping 5 kbp regions spanning the mouse genome (generated with bedtools 2.26.0 makewindows (Quinlan and Hall, 2010)) normalized to RPKM. Exclusion of regions (from 545,114 starting regions) from further analysis was based on reads from H3K27me3 ChIP-seq of Suz12 KO cells (non-specific reads). These showed a normal distribution, and regions with zero mapped reads from either H3K27me3 ChIP-seq replicate from Suz12 KO cells and regions with signal greater than 0.78 RPKM (p<0.01) were excluded, leaving 528,029 5kbp regions. For all samples presented in Figure 5, values used for box plots are means of values from two replicate ChIP-seq experiments (n = 2), while samples in Figure 6 (except for control samples, which contain replicate mean values) are from a single ChIP-seq experiment (n = 1). Regions were ranked according to H3K27me3 signal from WT cells and assigned to twenty 5-percentile groups. Box plots were made using ggplot2, and box includes first to third quartile values with a band marking the median. Whiskers extend to values up to 1.5 interquartile distances from box, and all additional values outside of this range are marked with circles.
Processing and analysis of RNA-seq data
Total cellular RNA was isolated from cells and sequencing adapters added using the TrueSeq RNA library prep kit v2 (Illumina) according to the manufacturer’s instructions. Three biological replicates of each sample were used. Library qualities were checked on a Bioanalyzer 2100 and sequenced on Illumina Nextseq (75bp single-end). Reads were processed within the Galaxy environment (Afgan et al., 2016). Reads were aligned to mouse (mm10) genome with STAR (Dobin et al., 2013) with Gencode vM21 gene annotation using default parameters. Aligned reads were counted with HTSeq (Anders et al., 2015) and differential expression analyzed using DESeq2 (Love et al., 2014) using threshold (lfcThreshold=log2(1.5)). PRC2 target genes used in the analysis were identified based on a positive overlap between SUZ12 ChIP-seq peaks and 5,000bp regions centered on transcript start sites in the Gencode vM21 annotation using BEDtools (Quinlan and Hall, 2010).
QUANTIFICATION AND STATISTICAL ANALYSIS
Where relevant, the number of replicate experiments (n) is indicated in the figure legends.
DATA AND CODE AVAILABILITY
Data accessibility
ChIP-seq data have been submitted to the Gene Expression Omnibus (GEO) under accession GSE127804 and to the NCBI Sequence Read Archive (SRA) with BioProject accession number PRJNA525434 and SRA accession number SRP187461.
Supplementary Material
Highlights.
Non-core PRC2 subunits are collectively required for genomic targeting specificity
Each non-core PRC2 subunit contributes to H3K27me3 deposition at PRC2 target sites
Polycomb-like (PCL) proteins depend on SUZ12 for target site binding
Bulk of H3K27me3 in mES cells is dispersed and not dependent on PRC2 localization
Acknowledgements
We thank members of the Helin laboratory for discussions. The work in the Helin laboratory is supported by the Danish Cancer Society (R167-A10877), the Danish National Research Foundation (DNRF82), the Independent Research Fund Denmark (6153–000005; 7016–00067; 8020–00044), The Neye Foundation, the Novo Nordisk Foundation (NNF; NNF16OC0023234), through a center grant from the NNF to the NNF Center for Stem Cell Biology (NNF17CC0027852), and through the Memorial Sloan Kettering Cancer Center Support Grant (NIH P30 CA008748).
Footnotes
Publisher's Disclaimer: This is a PDF file of an unedited manuscript that has been accepted for publication. As a service to our customers we are providing this early version of the manuscript. The manuscript will undergo copyediting, typesetting, and review of the resulting proof before it is published in its final citable form. Please note that during the production process errors may be discovered which could affect the content, and all legal disclaimers that apply to the journal pertain.
Declaration of Interests
The authors declare no competing interests.
References
- Afgan E, Baker D, van den Beek M, Blankenberg D, Bouvier D, Cech M, Chilton J, Clements D, Coraor N, Eberhard C, et al. (2016). The Galaxy platform for accessible, reproducible and collaborative biomedical analyses: 2016 update. Nucleic Acids Res 44, W3–W10. [DOI] [PMC free article] [PubMed] [Google Scholar]
- Alekseyenko AA, Gorchakov AA, Kharchenko PV, and Kuroda MI (2014). Reciprocal interactions of human C10orf12 and C17orf96 with PRC2 revealed by BioTAP-XL cross-linking and affinity purification. Proc Natl Acad Sci U S A 111, 2488–2493. [DOI] [PMC free article] [PubMed] [Google Scholar]
- Anders S, Pyl PT, and Huber W (2015). HTSeq--a Python framework to work with high-throughput sequencing data. Bioinformatics 31, 166–169. [DOI] [PMC free article] [PubMed] [Google Scholar]
- Ballare C, Lange M, Lapinaite A, Martin GM, Morey L, Pascual G, Liefke R, Simon B, Shi Y, Gozani O, et al. (2012). Phf19 links methylated Lys36 of histone H3 to regulation of Polycomb activity. Nat Struct Mol Biol 19, 1257–1265. [DOI] [PMC free article] [PubMed] [Google Scholar]
- Beringer M, Pisano P, Di Carlo V, Blanco E, Chammas P, Vizan P, Gutierrez A, Aranda S, Payer B, Wierer M, et al. (2016). EPOP Functionally Links Elongin and Polycomb in Pluripotent Stem Cells. Mol Cell 64, 645–658. [DOI] [PubMed] [Google Scholar]
- Blackledge NP, Rose NR, and Klose RJ (2015). Targeting Polycomb systems to regulate gene expression: modifications to a complex story. Nat Rev Mol Cell Biol 16, 643–649. [DOI] [PMC free article] [PubMed] [Google Scholar]
- Bolger AM, Lohse M, and Usadel B (2014). Trimmomatic: a flexible trimmer for Illumina sequence data. Bioinformatics 30, 2114–2120. [DOI] [PMC free article] [PubMed] [Google Scholar]
- Boyer LA, Plath K, Zeitlinger J, Brambrink T, Medeiros LA, Lee TI, Levine SS, Wernig M, Tajonar A, Ray MK, et al. (2006). Polycomb complexes repress developmental regulators in murine embryonic stem cells. Nature 441, 349–353. [DOI] [PubMed] [Google Scholar]
- Bracken AP, Dietrich N, Pasini D, Hansen KH, and Helin K (2006). Genome-wide mapping of Polycomb target genes unravels their roles in cell fate transitions. Genes Dev 20, 1123–1136. [DOI] [PMC free article] [PubMed] [Google Scholar]
- Brien GL, Gambero G, O’Connell DJ, Jerman E, Turner SA, Egan CM, Dunne EJ, Jurgens MC, Wynne K, Piao L, et al. (2012). Polycomb PHF19 binds H3K36me3 and recruits PRC2 and demethylase NO66 to embryonic stem cell genes during differentiation. Nat Struct Mol Biol 19, 1273–1281. [DOI] [PubMed] [Google Scholar]
- Cao R, Wang L, Wang H, Xia L, Erdjument-Bromage H, Tempst P, Jones RS, and Zhang Y (2002). Role of histone H3 lysine 27 methylation in Polycomb-group silencing. Science 298, 1039–1043. [DOI] [PubMed] [Google Scholar]
- Cao R, and Zhang Y (2004). SUZ12 is required for both the histone methyltransferase activity and the silencing function of the EED-EZH2 complex. Mol Cell 15, 57–67. [DOI] [PubMed] [Google Scholar]
- Casanova M, Preissner T, Cerase A, Poot R, Yamada D, Li X, Appanah R, Bezstarosti K, Demmers J, Koseki H, et al. (2011). Polycomblike 2 facilitates the recruitment of PRC2 Polycomb group complexes to the inactive X chromosome and to target loci in embryonic stem cells. Development (Cambridge, England) 138, 1471–1482. [DOI] [PMC free article] [PubMed] [Google Scholar]
- Chen S, Jiao L, Shubbar M, Yang X, and Liu X (2018). Unique Structural Platforms of Suz12 Dictate Distinct Classes of PRC2 for Chromatin Binding. Mol Cell 69, 840–852 e845. [DOI] [PMC free article] [PubMed] [Google Scholar]
- Choi J, Bachmann AL, Tauscher K, Benda C, Fierz B, and Muller J (2017). DNA binding by PHF1 prolongs PRC2 residence time on chromatin and thereby promotes H3K27 methylation. Nat Struct Mol Biol 24, 1039–1047. [DOI] [PubMed] [Google Scholar]
- Ciferri C, Lander GC, Maiolica A, Herzog F, Aebersold R, and Nogales E (2012). Molecular architecture of human polycomb repressive complex 2. Elife 1, e00005. [DOI] [PMC free article] [PubMed] [Google Scholar]
- Coleman RT, and Struhl G (2017). Causal role for inheritance of H3K27me3 in maintaining the OFF state of a Drosophila HOX gene. Science 356. [DOI] [PMC free article] [PubMed] [Google Scholar]
- Conway E, Jerman E, Healy E, Ito S, Holoch D, Oliviero G, Deevy O, Glancy E, Fitzpatrick DJ, Mucha M, et al. (2018). A Family of Vertebrate-Specific Polycombs Encoded by the LCOR/LCORL Genes Balance PRC2 Subtype Activities. Mol Cell 70, 408–421 e408. [DOI] [PubMed] [Google Scholar]
- Cooper S, Grijzenhout A, Underwood E, Ancelin K, Zhang T, Nesterova TB, Anil-Kirmizitas B, Bassett A, Kooistra SM, Agger K, et al. (2016). Jarid2 binds monoubiquitylated H2A lysine 119 to mediate crosstalk between Polycomb complexes PRC1 and PRC2. Nat Commun 7, 13661. [DOI] [PMC free article] [PubMed] [Google Scholar]
- Dobin A, Davis CA, Schlesinger F, Drenkow J, Zaleski C, Jha S, Batut P, Chaisson M, and Gingeras TR (2013). STAR: ultrafast universal RNA-seq aligner. Bioinformatics 29, 15–21. [DOI] [PMC free article] [PubMed] [Google Scholar]
- Ferrari KJ, Scelfo A, Jammula S, Cuomo A, Barozzi I, Stutzer A, Fischle W, Bonaldi T, and Pasini D (2014). Polycomb-dependent H3K27me1 and H3K27me2 regulate active transcription and enhancer fidelity. Mol Cell 53, 49–62. [DOI] [PubMed] [Google Scholar]
- Fursova NA, Blackledge NP, Nakayama M, Ito S, Koseki Y, Farcas AM, King HW, Koseki H, and Klose RJ (2019). Synergy between Variant PRC1 Complexes Defines Polycomb-Mediated Gene Repression. Mol Cell 74, 1020–1036 e1028. [DOI] [PMC free article] [PubMed] [Google Scholar]
- Grijzenhout A, Godwin J, Koseki H, Gdula MR, Szumska D, McGouran JF, Bhattacharya S, Kessler BM, Brockdorff N, and Cooper S (2016). Functional analysis of AEBP2, a PRC2 Polycomb protein, reveals a Trithorax phenotype in embryonic development and in ESCs. Development 143, 2716–2723. [DOI] [PMC free article] [PubMed] [Google Scholar]
- Hauri S, Comoglio F, Seimiya M, Gerstung M, Glatter T, Hansen K, Aebersold R, Paro R, Gstaiger M, and Beisel C (2016). A High-Density Map for Navigating the Human Polycomb Complexome. Cell Rep 17, 583–595. [DOI] [PubMed] [Google Scholar]
- Hojfeldt JW, Laugesen A, Willumsen BM, Damhofer H, Hedehus L, Tvardovskiy A, Mohammad F, Jensen ON, and Helin K (2018). Accurate H3K27 methylation can be established de novo by SUZ12-directed PRC2. Nat Struct Mol Biol 25, 225–232. [DOI] [PMC free article] [PubMed] [Google Scholar]
- Jermann P, Hoerner L, Burger L, and Schubeler D (2014). Short sequences can efficiently recruit histone H3 lysine 27 trimethylation in the absence of enhancer activity and DNA methylation. Proc Natl Acad Sci U S A 111, E3415–3421. [DOI] [PMC free article] [PubMed] [Google Scholar]
- Jiao L, and Liu X (2015). Structural basis of histone H3K27 trimethylation by an active polycomb repressive complex 2. Science 350, aac4383. [DOI] [PMC free article] [PubMed] [Google Scholar]
- Jung HR, Pasini D, Helin K, and Jensen ON (2010). Quantitative mass spectrometry of histones H3.2 and H3.3 in Suz12-deficient mouse embryonic stem cells reveals distinct, dynamic post-translational modifications at Lys-27 and Lys-36. Mol Cell Proteomics 9, 838–850. [DOI] [PMC free article] [PubMed] [Google Scholar]
- Justin N, Zhang Y, Tarricone C, Martin SR, Chen S, Underwood E, De Marco V, Haire LF, Walker PA, Reinberg D, et al. (2016). Structural basis of oncogenic histone H3K27M inhibition of human polycomb repressive complex 2. Nat Commun 7, 11316. [DOI] [PMC free article] [PubMed] [Google Scholar]
- Kasinath V, Faini M, Poepsel S, Reif D, Feng XA, Stjepanovic G, Aebersold R, and Nogales E (2018). Structures of human PRC2 with its cofactors AEBP2 and JARID2. Science 359, 940–944. [DOI] [PMC free article] [PubMed] [Google Scholar]
- Ku M, Koche RP, Rheinbay E, Mendenhall EM, Endoh M, Mikkelsen TS, Presser A, Nusbaum C, Xie X, Chi AS, et al. (2008). Genomewide analysis of PRC1 and PRC2 occupancy identifies two classes of bivalent domains. PLoS Genet 4, e1000242. [DOI] [PMC free article] [PubMed] [Google Scholar]
- Kuzmichev A, Nishioka K, Erdjument-Bromage H, Tempst P, and Reinberg D (2002). Histone methyltransferase activity associated with a human multiprotein complex containing the Enhancer of Zeste protein. Genes Dev 16, 2893–2905. [DOI] [PMC free article] [PubMed] [Google Scholar]
- Langmead B, and Salzberg SL (2012). Fast gapped-read alignment with Bowtie 2. Nat Methods 9, 357–359. [DOI] [PMC free article] [PubMed] [Google Scholar]
- Laprell F, Finkl K, and Muller J (2017). Propagation of Polycomb-repressed chromatin requires sequence-specific recruitment to DNA. Science 356, 85–88. [DOI] [PubMed] [Google Scholar]
- Laugesen A, and Helin K (2014). Chromatin repressive complexes in stem cells, development, and cancer. Cell Stem Cell 14, 735–751. [DOI] [PubMed] [Google Scholar]
- Laugesen A, Hojfeldt JW, and Helin K (2016). Role of the Polycomb Repressive Complex 2 (PRC2) in Transcriptional Regulation and Cancer. Cold Spring Harb Perspect Med 6. [DOI] [PMC free article] [PubMed] [Google Scholar]
- Lerdrup M, Johansen JV, Agrawal-Singh S, and Hansen K (2016). An interactive environment for agile analysis and visualization of ChIP-sequencing data. Nat Struct Mol Biol 23, 349–357. [DOI] [PubMed] [Google Scholar]
- Li G, Margueron R, Ku M, Chambon P, Bernstein BE, and Reinberg D (2010). Jarid2 and PRC2, partners in regulating gene expression. Genes Dev 24, 368–380. [DOI] [PMC free article] [PubMed] [Google Scholar]
- Li H, Liefke R, Jiang J, Kurland JV, Tian W, Deng P, Zhang W, He Q, Patel DJ, Bulyk ML, et al. (2017). Polycomb-like proteins link the PRC2 complex to CpG islands. Nature 549, 287–291. [DOI] [PMC free article] [PubMed] [Google Scholar]
- Liefke R, Karwacki-Neisius V, and Shi Y (2016). EPOP Interacts with Elongin BC and USP7 to Modulate the Chromatin Landscape. Mol Cell 64, 659–672. [DOI] [PMC free article] [PubMed] [Google Scholar]
- Liefke R, and Shi Y (2015). The PRC2-associated factor C17orf96 is a novel CpG island regulator in mouse ES cells. Cell Discov 1, 15008. [DOI] [PMC free article] [PubMed] [Google Scholar]
- Love MI, Huber W, and Anders S (2014). Moderated estimation of fold change and dispersion for RNA-seq data with DESeq2. Genome Biol 15, 550. [DOI] [PMC free article] [PubMed] [Google Scholar]
- Lynch MD, Smith AJ, De Gobbi M, Flenley M, Hughes JR, Vernimmen D, Ayyub H, Sharpe JA, Sloane-Stanley JA, Sutherland L, et al. (2012). An interspecies analysis reveals a key role for unmethylated CpG dinucleotides in vertebrate Polycomb complex recruitment. EMBO J 31, 317–329. [DOI] [PMC free article] [PubMed] [Google Scholar]
- Margueron R, and Reinberg D (2011). The Polycomb complex PRC2 and its mark in life. Nature 469, 343–349. [DOI] [PMC free article] [PubMed] [Google Scholar]
- Martin Gonzalez J, Morgani SM, Bone RA, Bonderup K, Abelchian S, Brakebusch C, and Brickman JM (2016). Embryonic Stem Cell Culture Conditions Support Distinct States Associated with Different Developmental Stages and Potency. Stem Cell Reports 7, 177–191. [DOI] [PMC free article] [PubMed] [Google Scholar]
- Mendenhall EM, Koche RP, Truong T, Zhou VW, Issac B, Chi AS, Ku M, and Bernstein BE (2010). GC-rich sequence elements recruit PRC2 in mammalian ES cells. PLoS Genet 6, e1001244. [DOI] [PMC free article] [PubMed] [Google Scholar]
- Montgomery ND, Yee D, Chen A, Kalantry S, Chamberlain SJ, Otte AP, and Magnuson T (2005). The murine polycomb group protein Eed is required for global histone H3 lysine-27 methylation. Curr Biol 15, 942–947. [DOI] [PubMed] [Google Scholar]
- Muller J, Hart CM, Francis NJ, Vargas ML, Sengupta A, Wild B, Miller EL, O’Connor MB, Kingston RE, and Simon JA (2002). Histone methyltransferase activity of a Drosophila Polycomb group repressor complex. Cell 111, 197–208. [DOI] [PubMed] [Google Scholar]
- Oksuz O, Narendra V, Lee CH, Descostes N, LeRoy G, Raviram R, Blumenberg L, Karch K, Rocha PP, Garcia BA, et al. (2018). Capturing the Onset of PRC2-Mediated Repressive Domain Formation. Mol Cell 70, 1149–1162 e1145. [DOI] [PMC free article] [PubMed] [Google Scholar]
- Pasini D, Bracken AP, Jensen MR, Lazzerini Denchi E, and Helin K (2004). Suz12 is essential for mouse development and for EZH2 histone methyltransferase activity. EMBO J 23, 4061–4071. [DOI] [PMC free article] [PubMed] [Google Scholar]
- Pasini D, Cloos PA, Walfridsson J, Olsson L, Bukowski JP, Johansen JV, Bak M, Tommerup N, Rappsilber J, and Helin K (2010). JARID2 regulates binding of the Polycomb repressive complex 2 to target genes in ES cells. Nature 464, 306–310. [DOI] [PubMed] [Google Scholar]
- Perino M, van Mierlo G, Karemaker ID, van Genesen S, Vermeulen M, Marks H, van Heeringen SJ, and Veenstra GJC (2018). MTF2 recruits Polycomb Repressive Complex 2 by helical-shape-selective DNA binding. Nat Genet 50, 1002–1010. [DOI] [PubMed] [Google Scholar]
- Peters AH, Kubicek S, Mechtler K, O’Sullivan RJ, Derijck AA, Perez-Burgos L, Kohlmaier A, Opravil S, Tachibana M, Shinkai Y, et al. (2003). Partitioning and plasticity of repressive histone methylation states in mammalian chromatin. Mol Cell 12, 1577–1589. [DOI] [PubMed] [Google Scholar]
- Quinlan AR, and Hall IM (2010). BEDTools: a flexible suite of utilities for comparing genomic features. Bioinformatics 26, 841–842. [DOI] [PMC free article] [PubMed] [Google Scholar]
- Riising EM, Comet I, Leblanc B, Wu X, Johansen JV, and Helin K (2014). Gene silencing triggers polycomb repressive complex 2 recruitment to CpG islands genome wide. Mol Cell 55, 347–360. [DOI] [PubMed] [Google Scholar]
- Scelfo A, Fernandez-Perez D, Tamburri S, Zanotti M, Lavarone E, Soldi M, Bonaldi T, Ferrari KJ, and Pasini D (2019). Functional Landscape of PCGF Proteins Reveals Both RING1A/B-Dependent-and RING1A/B-Independent-Specific Activities. Mol Cell 74, 1037–1052 e1037. [DOI] [PMC free article] [PubMed] [Google Scholar]
- Schuettengruber B, Bourbon HM, Di Croce L, and Cavalli G (2017). Genome Regulation by Polycomb and Trithorax: 70 Years and Counting. Cell 171, 34–57. [DOI] [PubMed] [Google Scholar]
- Tanay A, O’Donnell AH, Damelin M, and Bestor TH (2007). Hyperconserved CpG domains underlie Polycomb-binding sites. Proc Natl Acad Sci U S A 104, 5521–5526. [DOI] [PMC free article] [PubMed] [Google Scholar]
- Vaswani RG, Gehling VS, Dakin LA, Cook AS, Nasveschuk CG, Duplessis M, Iyer P, Balasubramanian S, Zhao F, Good AC, et al. (2016). Identification of (R)-N-((4-Methoxy-6-methyl-2-oxo-1,2-dihydropyridin-3-yl)methyl)-2-methyl-1-(1-(1 -(2,2,2-trifluoroethyl)piperidin-4-yl)ethyl)-1H-indole-3-carboxamide (CPI-1205), a Potent and Selective Inhibitor of Histone Methyltransferase EZH2, Suitable for Phase I Clinical Trials for B-Cell Lymphomas. J Med Chem 59, 9928–9941. [DOI] [PMC free article] [PubMed] [Google Scholar]
- Wachter E, Quante T, Merusi C, Arczewska A, Stewart F, Webb S, and Bird A (2014). Synthetic CpG islands reveal DNA sequence determinants of chromatin structure. Elife 3, e03397. [DOI] [PMC free article] [PubMed] [Google Scholar]
- Youmans DT, Schmidt JC, and Cech TR (2018). Live-cell imaging reveals the dynamics of PRC2 and recruitment to chromatin by SUZ12-associated subunits. Genes Dev 32, 794–805. [DOI] [PMC free article] [PubMed] [Google Scholar]
Associated Data
This section collects any data citations, data availability statements, or supplementary materials included in this article.
Supplementary Materials
Data Availability Statement
Data accessibility
ChIP-seq data have been submitted to the Gene Expression Omnibus (GEO) under accession GSE127804 and to the NCBI Sequence Read Archive (SRA) with BioProject accession number PRJNA525434 and SRA accession number SRP187461.
ChIP-seq data have been submitted to the Gene Expression Omnibus (GEO) under accession GSE127804 and to the NCBI Sequence Read Archive (SRA) with BioProject accession number PRJNA525434 and SRA accession number SRP187461.