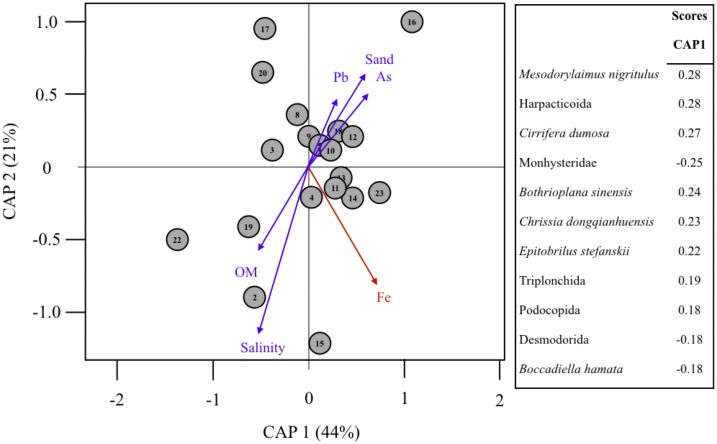
Figure 5. Multivariate analysis of assemblage composition and environmental filtering in the Rio Doce in August 2017.
Canonical analyses of principal coordinates (CAP) ordination of samples according to multivariate distribution of dominant eOTUS (>0.1% total SV reads) in the Rio Doce estuary. The strength and direction of environmental effects (Spearman correlation values with p < 0.5 in red) on biological assemblages is represented by arrows of variable size. Environmental variables were based on Table 1 (Fe, Pb, As, Salinity, TOM and %Sand). Taxa scores indicate OTUs mostly correlated to site differences. Proportion of variance explained by axis 1 and 2 are in parenthesis. Symbol numbers indicate sampling station.

