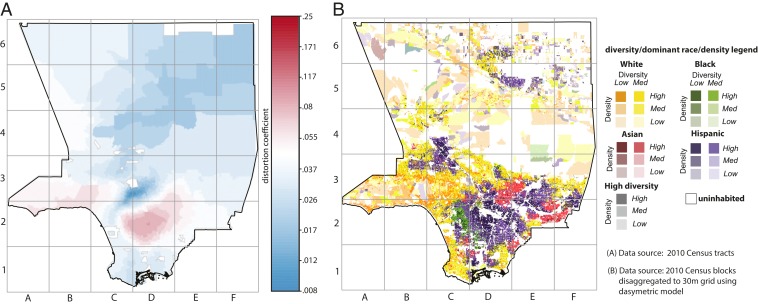
In PNAS, Olteanu et al. (1) introduce a framework for analyzing racial segregation. What distinguishes their method is the high level of mathematical abstraction used to yield a result. We note that Olteanu et al. (1) do not compare the utility of their method to that of existing, more concrete methods (2, 3). In our view, the method based on classifying population units on the basis of racial diversity/dominant race (3) provides more insight to all stakeholders in the problem of racial segregation in a much more accessible fashion.
The Olteanu et al. (1) method employs a street-view perspective of segregation in which inhabitants explore their city starting from their residence and record a difference between the racial composition of the part of the city they have already seen and the composition of the entire city. Combining such records from all inhabitants and processing them through 3 levels of mathematical abstractions, their method results in a map of the distortion coefficient of Los Angeles County (reproduced here in Fig. 1A). This map distinguishes between sizable districts where racial composition differs from that of the entire city (red) and districts where it does not (blue). While interesting, this lacks information that stakeholders expect and need.
Fig. 1.
Communicating racial segregation in Los Angeles County in 2010. (A) Distortion coefficient method (1). (B) Classification method (3). To zoom in for more details see ref. 4. Grid lines on both maps provide locational reference.
The classification method employs a bird’s-eye view perspective of segregation. The result is a map (Fig. 1B) showing specific racial enclaves while also accounting for diversity levels and population density. It provides all of the information present in Fig. 1A and much more. For example, the strong blue feature (where racial composition is similar to the racial composition of the entire Los Angeles County) located in in sectors D3 and C3 of Fig. 1A corresponds to the location D3-C3 in Fig. 1B, which is the region where white, Hispanic, and Asian enclaves are converging. This explains why the composition of this location resembles that of the entire county which consists of a mixture of these 3 races/ethnicities. The map in Fig. 1B directly reflects census data and is immediately understood. A classification map is not just visualization but also a spatial dataset. The pattern observed in the classification map can be quantified using landscape metrics (3).
Comparison of the distortion map with the classification map reveals multiple shortcomings of Olteanu et al.’s (1) method. First, it does not contain information about race/ethnicity of segregated enclaves or their population densities. Second, the distortion coefficient depends on data aggregation from a starting point, the measure relative to the whole city, and integration of the focal distance curve. This leads to data smoothing and loss of spatial details; multiple segregated enclaves are just not seen on the distortion map.
Due to its spatial complexity, the problem of analyzing and visualizing racial patterns attracts interest from multiple disciplines. Although all approaches shed some light on the problem, it is important that they contribute to an actual social aspect of the phenomenon. While we enjoyed reading the Olteanu et al. (1) paper, we do not agree with Olteanu et al.’s (1) conclusions about the value of their method for analysis and visualization of racial segregation.
Footnotes
The authors declare no competing interest.
References
- 1.Olteanu M., Randon-Furling J., Clark W. A. V., Segregation through the multiscalar lens. Proc. Natl. Acad. Sci. U.S.A. 116, 12250–12254 (2019). [DOI] [PMC free article] [PubMed] [Google Scholar]
- 2.Holloway S. R., Wright R., Ellis M., The racially fragmented city? Neighborhood racial segregation and diversity jointly considered. Prof. Geogr. 64, 63–82 (2012). [Google Scholar]
- 3.Dmowska A., Stepinski T., Netzel P., Comprehensive framework for visualizing and analyzing spatio-temporal dynamics of racial diversity in the entire United States. PLoS One 12, e0174993 (2017). [DOI] [PMC free article] [PubMed] [Google Scholar]
- 4.Dmowska A., Stepinski T., Netzel P., SocScape USA: Exploring high resolution demographic grids. http://sil.uc.edu/webapps/socscape_usa. Accessed 19 August 2019.


