Abstract
Estrogen has been implicated in the regulation of growth and immune function in the kidney, which expresses the full-length estrogen receptor-α (ERα66), its ERα splice variants, and estrogen receptor-β (ERβ). Thus, we hypothesized that these splice variants may inhibit the glomerular enlargement that occurs early in type 1 diabetes (T1D). T1D was induced by streptozotocin (STZ) injection in 8- to 12-wk-old female mice lacking ERα66 (ERα66KO) or all ERα variants (αERKO), and their wild-type (WT) littermates. Basal renal ERα36 protein expression was reduced in the ERα66KO model and was downregulated by T1D in WT mice. T1D did not alter ERα46 or ERβ in WT-STZ; however, ERα46 was decreased modestly in ERα66KO mice. Renal hypertrophy was evident in all diabetic mice. F4/80-positive immunostaining was reduced in ERα66KO compared with WT and αERKO mice but was higher in STZ than in Control mice across all genotypes. Glomerular area was greater in WT and αERKO than in ERα66KO mice, with T1D-induced glomerular enlargement apparent in WT-STZ and αERKO-STZ, but not in ERα66KO-STZ mice. Proteinuria and hyperfiltration were evident in ERα66KO-STZ and αERKO-STZ, but not in WT-STZ mice. These data indicate that ERα splice variants may exert an inhibitory influence on glomerular enlargement and macrophage infiltration during T1D; however, effects of splice variants are masked in the presence of the full-length ERα66, suggesting that ERα66 acts in opposition to its splice variants to influence these parameters. In contrast, hyperfiltration and proteinuria in T1D are attenuated via an ERα66-dependent mechanism that is unaffected by splice variant status.
Keywords: estrogen receptors, glomeruli, macrophage, type 1 diabetes
INTRODUCTION
Type 1 diabetes (T1D) is an autoimmune disease that arises from the loss of insulin-producing pancreatic β-cells and results in sustained hyperglycemia. The inability to properly regulate glucose levels in extracellular fluid leads to a variety of macrovascular and microvascular complications of T1D. Approximately one-third of patients with T1D develop persistent macroalbuminuria, and one-half of these individuals develop end-stage renal disease within 15 yr (31).
Although conflicting evidence exists regarding a sex difference in the prevalence of T1D, women of European descent aged 15–40 yr are less likely to develop T1D than men in the same age group (11). There is also no consensus on the issue of whether sex plays a role in the development and progression of diabetic nephropathy. Nevertheless, it is clear that estrogen impacts multiple cellular processes involved in the pathophysiology of diabetic nephropathy (24) and can exert a renoprotective impact in animal models of T1D (7, 21, 23). These effects have been attributed to the classical estrogen receptors, the full-length estrogen receptor-α (ERα66) and estrogen receptor-β (ERβ). The kidney expresses both of these receptors, as well as at least two ERα splice variants (17), thus making it likely that a complex array of estrogen-dependent signaling events impacts renal function in health and disease.
The ERα splice variants ERα46 and ERα36 (9, 36) are amino terminus-truncated versions of ERα66, lacking the first transactivation domain. The remaining protein sequences of ERα66 and ERα46 are identical. ERα36 also has a C-terminus that is unique from that of ERα46 and ERα66 and lacks the second transactivation domain. Several differences in how the splice variants can interact with DNA or with estrogens have been identified (28), and the splice variants may be more likely than the full-length ERα66 to be localized to the membrane (36). Our previous work revealed expression of the ERα splice variants at multiple sites within the kidney (17); however, no studies to date have investigated the potential contribution of the ERα splice variants to the renal consequences of T1D.
Glomerular enlargement is one of the earliest detectible renal structural changes evident in experimental models of T1D. Prior studies in our laboratory revealed that female mice lacking ERα66 do not exhibit T1D-induced glomerular enlargement (21) unless they have been ovariectomized. These observations suggest that an estrogen-dependent mechanism prevents glomerular enlargement in the absence of ERα66 and indicate a renal influence of estrogen during T1D that is independent of its actions through ERα66. The present study explored the hypothesis that this phenomenon reflects an inhibitory impact of ERα splice variants on glomerular enlargement and other renal consequences of T1D.
METHODS
All experiments were conducted in accordance with the Guide for the Care and Use of Laboratory Animals and with approval of the Institutional Animal Care and Use Committee of the University of Nebraska Medical Center. Mice were housed five per cage in a 12:12-h light-dark cycle environment with ad libitum access to water and standard mouse chow.
Mice lacking either ERα66 (ERα66KO) or all known ERα proteins (αERKO; lacking ERα66, ERα46, and ERα36) were a kind gift from Kenneth S. Korach, National Institute of Environmental Health Sciences. The ERα66KO mice were created through insertion of a neomycin phosphotransferase (Neo) cassette in exon 2 of the gene encoding ERα (Esr1), preventing expression of the full-length ERα66 while permitting expression of the ERα splice variants through an alternate start site downstream of exon 2 (22). The αERKO mice were created through use of Cre-Lox technology to delete exon 3 of Esr1 (14). Both colonies were bred on the C57BL/6 background. Because male and female ERα66KO and αERKO are infertile, heterozygotes were bred onsite to establish two separate colonies.
DNA Isolation and Genotyping
Mice were ear-punched at weaning, and tissue was incubated overnight at 55°C in Johnson’s lysis buffer and proteinase K (Qiagen, Valencia, CA), following a previously described protocol to isolate DNA (26). The DNA from the ear punches was used for determining genotype in both colonies. The primers for the ERα66KO were: Neo Cassette: > TGAATGAACTGCAGGACGAG, Neo Cassette: < AATATCACGGGTAGCCAACG, Exon 2: > CTACGGCCAGTCGGGCAT, and Exon 2: < AGACCTGTAGAAGGCGGGAG.
A master mix was prepared and added to DNA in 0.2-ml tubes. PCR was performed on a Rotor-Gene 3000 Real-Time Thermal Cycler (Corbett Life Sciences, NSW, Australia) with the following cycles: preheat at 94°C for 1 min, (melt at 92°C for 40 s, anneal at 60°C for 30 s, extend at 72°C for 90 s) × 35 cycles, and then prolonged extension at 72°C for 5 min. The PCR product was loaded onto a 1% agarose gel and electrophoresed with ethidium bromide for 1 h at 110 V. This process yielded a 241-bp band for the wild-type (WT) allele and a 515-bp band for the ERα66KO.
The following primers for the global αERKO colony were purchased from Sigma-Aldrich (St. Louis, MO): Exon 3: > CTGTAGGCTTTGTCTCGCTTT and Exon 3: < CAACCAAGGAGAACAGAGAGACTTA.
A master mix containing Taq polymerase (Phenix Research, Candler, NC) was diluted in PCR water, mixed with 100 pmol/μl primers, and aliquoted into tubes, and DNA was added. The PCR was run in a Rotor-Gene with the following cycles: preheat at 94°C for 3 min, (melt at 94°C for 30 s, anneal at 57°C for 30 s, extend at 68°C for 90 s) × 40 cycles and then prolonged extension at 72°C for 7 min. The PCR product was loaded onto a 1.5% agarose gel and electrophoresed with ethidium bromide for 1 h at 110 V. This process yielded a 741-bp band for the WT allele and a 223-bp band for the knockout.
Induction of T1D
Female mice between 8 and 12 wk of age were separated into experimental groups based on genotype and were injected intraperitoneally (ip) either with 150 mg/kg streptozotocin (STZ; Sigma-Aldrich) to induce T1D or with citrate buffer as a vehicle control (Control). Body weight and blood glucose concentration (Bayer Contour meter; Fisher Scientific, Pittsburgh, PA) were monitored for 2 days after injection and weekly thereafter for the ensuing 6 wk. In the diabetic groups, a second injection of STZ was administered if the mouse was not hyperglycemic after 2 days. Blood was obtained in the nonfasted state by tail vein bleed. Glomerular filtration rate (GFR) measurement and tissue harvesting were performed 6 wk after injection of STZ or vehicle.
Tissue Harvesting
Mice were anesthetized with ip ketamine (100 mg/kg)-xylazine (10 mg/kg), and blood was obtained from the carotid artery. Both kidneys were perfused with heparinized saline. The right kidney was removed, weighed, and bisected longitudinally. One-half of the kidney was fixed in 10% neutral buffered formalin overnight and embedded in paraffin for sectioning. The renal cortex from the left kidney was snap-frozen in liquid nitrogen and stored at −80°C until protein analysis by Western blotting. The mouse was euthanized by exsanguination, and death was ensured by pneumothorax.
Morphometric and Immunohistochemical Analyses
Glomerular area.
Paraffin-embedded kidneys were sectioned at 4-µm thickness. The sections were mounted on glass slides and stained with periodic acid Schiff (PAS) to delineate the basement membrane. Kidney sections were photographed using a Nikon camera mounted on a Zeiss Axioskop microscope. Fifteen consecutive glomeruli were imaged in each section for measurement of glomerular area, using ImageJ software. The glomerulus was defined as the minimal convex polygon surrounding the capillary tuft (19).
Immunohistochemistry.
Sections (4 μm) were cut from paraffin-embedded kidneys, positioned on glass slides, cleared with xylene overnight, and rehydrated in decreasing concentrations of ethanol. Endogenous horseradish peroxidase activity was blocked with 0.3% H2O2 in methanol. After antigen retrieval in sodium citrate buffer, sections were blocked in 10% goat serum with 2% BSA at room temperature. Slides were incubated overnight at 4°C with rat anti-F4/80 antibody (1:50; AbD Serotec, Raleigh, NC). Sections were then incubated with goat anti-rat IgG-HRP (1:200, AbD Serotec) antibody for 1 h at room temperature, followed by diaminobenzidine staining (Invitrogen|Life Technologies, Grand Island, NY). Finally, slides were counterstained with Mayer’s hematoxylin and dehydrated in increasing concentrations of ethanol, followed by xylene, and mounted with Permount (Fisher Scientific).
Quantification of F4/80 immunostaining.
A Nikon Eclipse 50i microscope was used to obtain six nonoverlapping fields of view for each kidney cortex that were randomly selected from blinded kidney sections. Images were taken at ×40 magnification at full light intensity. An antireflex contrast filter was used to capture images. Medullas were excluded from analysis. Images were saved as JPEG files and analyzed using ImageJ. Image thresholds were set at a red color and HSB color space. Hue and brightness were adjusted to highlight only positively stained areas, and saturation was held constant at a range of 0–255. Images were then converted to binary images, effectively making positively stained areas black and unstained areas white for analysis. To reduce background noise, a median filter was applied to subtract out positive areas encompassing ≤2 pixels. The area fraction was then measured from the positively stained areas obtained from the whole field of view.
Western Blot
Renal cortical tissue was minced and lysed in radioimmunoprecipitation assay buffer with Halt protease and phosphatase inhibitor cocktail (Thermo Fisher Scientific, Waltham, MA). Protein concentration was determined using the Coomassie Plus Protein Assay (Bradford assay, Thermo Scientific), with absorbance of samples read on a μQuant (Bio-Tek Instruments, Winooski, VT) microplate reader at 595 nm. Protein was boiled in 6× sample buffer (Boston Bioproducts, Ashland, MA), and 33 μg of protein was loaded onto a 10% Tris·HCl gel (Bio-Rad, Hercules, CA). The gel was transferred to a PVDF membrane (Bio-Rad) and blocked for 1 h at room temperature in Odyssey blocking buffer (LI-COR Biosciences, Lincoln, NE). For ER detection, membranes were incubated with rabbit primary antibodies [anti-ERα (1:1,000 MC-20; Santa Cruz Biotechnology, Santa Cruz, CA) or anti-ERβ (1:500; H150, Santa Cruz Biotechnology), and mouse anti-β-actin (1:1,000, 3700; Cell Signaling, Beverly, MA)] in blocking buffer overnight at 4°C. Assessment of mitogen-activated protein kinase [MAPK; extracellular signal-regulated kinase-1/2 (ERK1/2)] activation employed rabbit anti-phospho-p44/42 MAPK (Thr202/Tyr204, 1:2,000, 4370, Cell Signaling) and mouse anti-p44/42 MAPK (1:2,000, 9107, Cell Signaling). Blots were washed in PBS with Tween 20 and then incubated in secondary antibodies [IRDye 800CW-conjugated goat anti-rabbit IgG (1:10,000, 611-131-122; Rockland, Gilbertsville, PA) and Alexa Fluor 680 goat anti-mouse IgG (1:10,000, A21058, Invitrogen|Life Technologies)] for 1 h at room temperature. Blots were visualized with the Odyssey Infrared Imaging System (LI-COR Biosciences).
Metabolic Cage Studies
In a separate group of control and STZ mice of each genotype, mice were housed individually in metabolic cages beginning 6 wk after injection of STZ or vehicle. After a 2-day acclimation period, water consumption and urine volume were measured over the ensuing 24 h. Urine samples were centrifuged (1,000 g for 5 min) to remove sediment and frozen until assay for protein concentration (Coomassie Plus Protein, Thermo Scientific). Mice were returned to standard housing for 2 days before measurement of glomerular filtration rate (GFR).
GFR
GFR was measured in the conscious state based on plasma decay of a GFR marker following a single bolus injection (29, 33). FITC-Sinistrin (Mannheim Pharma & Diagnostics, Mannheim, Germany) was injected retroorbitally (3.74 μl of a 5% solution/g body wt) under brief isoflurane anesthesia. Blood samples of less than 20 μl were obtained from the cheek pouch with a 3-mm Goldenrod lancet (Medipoint, Mineola, NY) at 3, 7, 10, 15, 25, 55, and 75 min after FITC-Sinistrin injection. Blood was centrifuged at 10,000 g for 7 min to separate plasma, which was diluted (1:10) in HEPES buffer to maintain proper pH (7.4). Fluorescence (475 nm excitation, 530 emission) of the plasma samples was quantified using a TECAN (Research Triangle Park, NC) microplate reader. GFR was calculated using a two-compartment model of two-phase exponential decay with GraphPad Prism software, as previously described (29, 33).
Statistics
Differences among groups were calculated using two-way ANOVA followed by multiple comparison analysis using the Holm-Sidak method (SigmaPlot 11.0; Systat Software, San Jose, CA). In some instances, data transformations were applied to satisfy the ANOVA assumptions of homogenous variance and normal distribution. P values < 0.05 were considered as indicating statistical significance. Data are reported as means ± SE (n = number of mice).
RESULTS
ERα Splice Variant and ERβ Protein Levels
ERα36 was highly expressed in the renal cortex of WT mice (Fig. 1A) and was downregulated by ~35% in WT-STZ mice. ERα36 protein levels were suppressed markedly in the renal cortex of ERα66KO mice, and T1D evoked a small (when expressed as %WT-Control) but statistically significant increase in ERα36 protein levels in this genotype. Thus, T1D attenuated ERα36 protein levels only in the presence of unimpeded ERα66 expression. In contrast, expression of ERα46 in the renal cortex was ~35% lower in ERα66KO-Control than in WT-Control mice and was unchanged by T1D in either genotype (Fig. 1A). Thus, T1D did not impact ERα46 protein levels regardless of ERα66 expression. ERβ protein levels were similar in WT- and ERα66KO-Control mice, and were not influenced by STZ-induced T1D in either genotype (Fig. 1B).
Fig. 1.
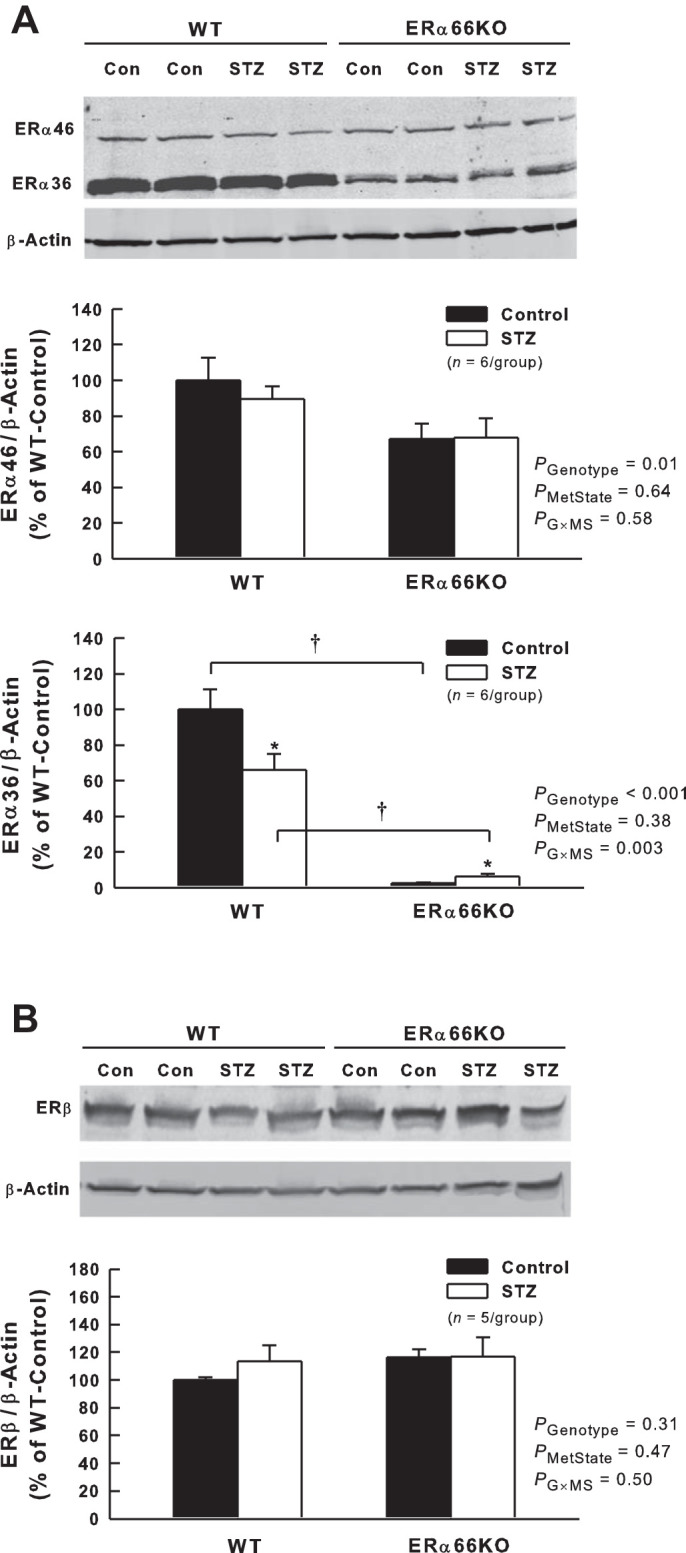
Effects of type 1 diabetes (T1D) and loss of estrogen receptor (ER)α66 on ERα splice variant and ERβ protein expression in renal cortex. A: representative Western blot and quantification of ERα46 and ERα36 protein levels. B: representative Western blot and quantification of ERβ protein levels. P values shown are main effects determined by 2-way ANOVA. Note: ERα36 data required transformation (loge) to satisfy ANOVA assumptions. *P < 0.05 vs. Control (Con) of same genotype; †P < 0.05, comparing the same metabolic state in different genotypes.
Blood Glucose, Body Weight, and Kidney Weight
Blood glucose levels in each group of mice during the 6-wk experimental period are shown in Fig. 2A. The control groups did not differ significantly with regard to blood glucose levels, averaging ~125 mg/dl throughout the study. Nearly 50% of the WT mice injected with STZ required a second injection 2 days later to develop hyperglycemia compared with 11% of ERα66KO and 20% of αERKO mice. After hyperglycemia was evident, blood glucose concentration in both ERα66KO- and αERKO-STZ mice exceeded that observed in WT-STZ mice through the remainder of the study, with αERKO-STZ differing from ERα66KO-STZ mice only at week 1.
Fig. 2.
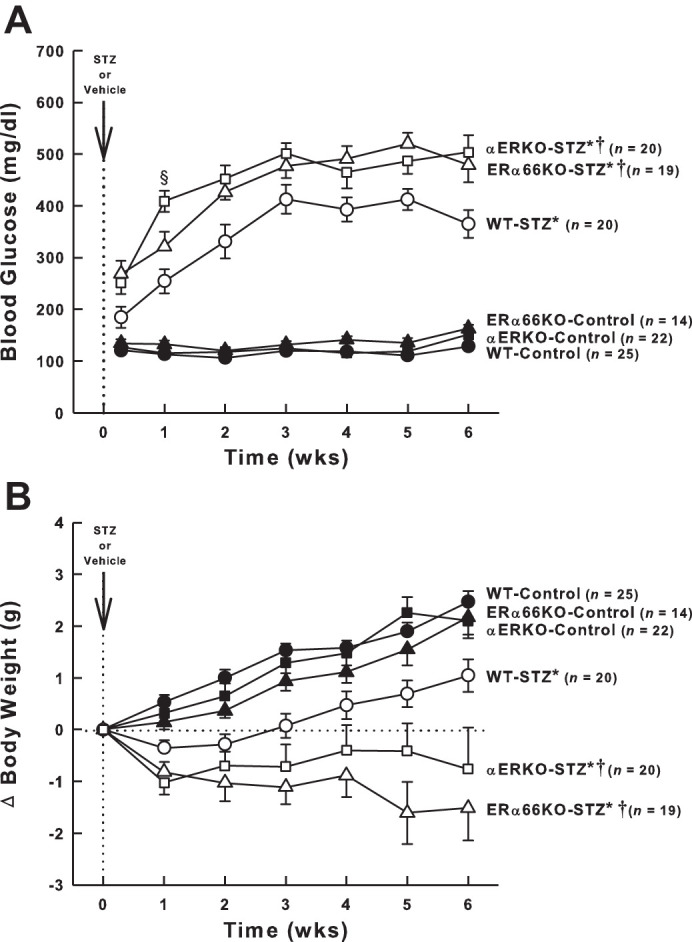
Effects of T1D and ER genotype on blood glucose concentration and body weight. A: time course of blood glucose levels in each group of mice. B: change in body weight over the 6-wk period after the injection of streptozotocin (STZ) or vehicle. For both panels, P values for main effects determined by repeated-measures ANOVA are PGroup < 0.001, PTime < 0.001, and PG × T < 0.001. *P < 0.05 vs. Control (of same genotype); †P < 0.05 vs. WT-STZ; §P < 0.05 vs. ERα66KO-STZ. Total number of animals included in each group are shown (n values), not accounting for occasional missing data points over the 6-wk of study.
Prior to STZ or vehicle injection, body weight varied among the groups, with WT mice (18.0 ± 0.2 g, n = 45) weighing significantly less than ERα66KO mice (20.3 ± 0.3 g, n = 33, P < 0.001) and αERKO mice (20.4 ± 0.4 g, n = 42, P < 0.001). The change in body weight evident over the ensuing 6-wk period in each animal group was subjected to two-way repeated-measures ANOVA, revealing a significant interaction between time and animal group. Control animals of all three genotypes gained weight over the 6-wk duration of the experiment (Fig. 2B). WT-STZ mice displayed blunted weight gain compared with the WT-Controls, while ERα66KO- and αERKO-STZ mice exhibited stable or declining weight over the 6-wk course of the study.
As shown in Fig. 3, T1D induced renal hypertrophy that was evident across genotypes as a greater kidney weight-to-body weight ratio in STZ mice than in control mice. A significant main effect of genotype was also apparent, with kidney weight-to-body weight ratio in ERα66KO mice exceeding that of WT mice. However, ANOVA failed to reveal a significant interaction between genotype and metabolic state, indicating that ER status is not a major determinant of renal hypertrophy in T1D.
Fig. 3.
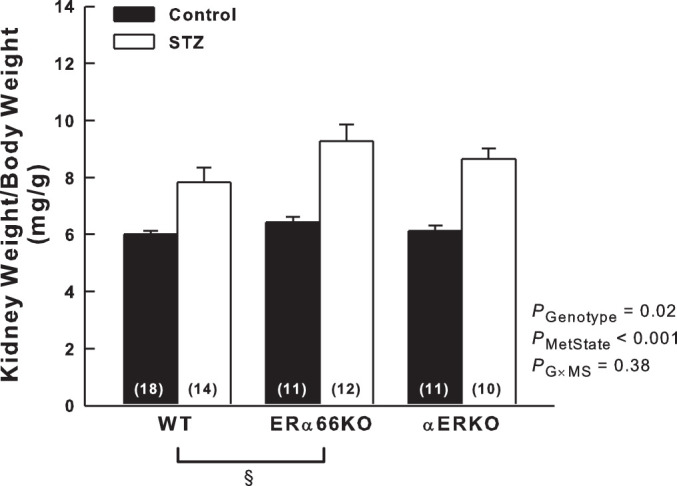
Effects of T1D and ER genotype on kidney weight. Kidney weight-to-body weight ratio was measured 6 wk after injection of STZ or vehicle. P values shown are main effects determined by 2-way ANOVA. Note: these data required reciprocal transfomation to satisfy ANOVA assumptions. §P < 0.05 across genotypes (n values shown within bars).
Glomerular Area
Figure 4 shows representative images of PAS-stained glomeruli and summarized glomerular area data. Both genotype and metabolic state were significant determinants of glomerular area. Average values for glomerular area in WT and αERKO mice exceeded those of ERα66KO mice, largely due to the glomerular enlargement evident in WT-STZ and αERKO-STZ mice. Glomerular area in these groups averaged ~500 µm2 greater than in control mice of the same genotype (both P < 0.05). In contrast, ERα66KO-Control and -STZ mice displayed virtually identical values for glomerular area. However, ANOVA did not detect a significant interaction between ER genotype and metabolic state with regard to glomerular area, likely because the analysis was underpowered for this comparison (power of the performed test with α = 0.050 was 0.125).
Fig. 4.
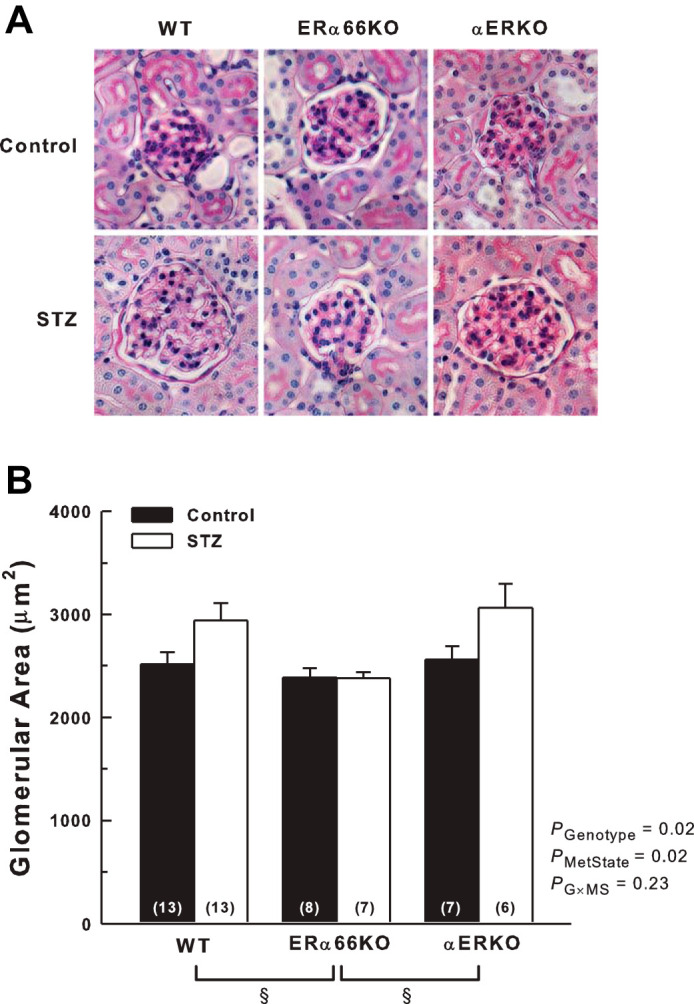
Effects of T1D and ER genotype on glomerular area. A: representative images of glomeruli from Control and STZ animals in PAS-stained kidney sections. B: quantification of glomerular area. P values shown are main effects determined by 2-way ANOVA. §P < 0.05 across genotypes (n values shown within bars).
Urinary Protein Excretion and GFR
Six weeks after injection of STZ, polydipsia and polyuria were evident in all genotypes compared with control animals; however, neither 24-h water intake nor urine production by STZ-treated mice differed significantly among the ER genotypes (data not shown). Urinary protein excretion did not differ among ER genotypes in the control mice (Fig. 5A). In contrast, significant proteinuria was evident in the ERα66KO-STZ and αERKO-STZ mice, but not in WT-STZ animals. Protein excretion by ERα66KO-STZ mice was more than double that of WT-STZ mice (P < 0.001). Protein excretion by αERKO-STZ mice was intermediate in magnitude between STZ mice of the other genotypes, being significantly lower than ERα66KO-STZ (P = 0.04). The interaction between genotype and metabolic state revealed by ANOVA indicates that ER status is a determinant of the impact of T1D on urinary protein excretion.
Fig. 5.
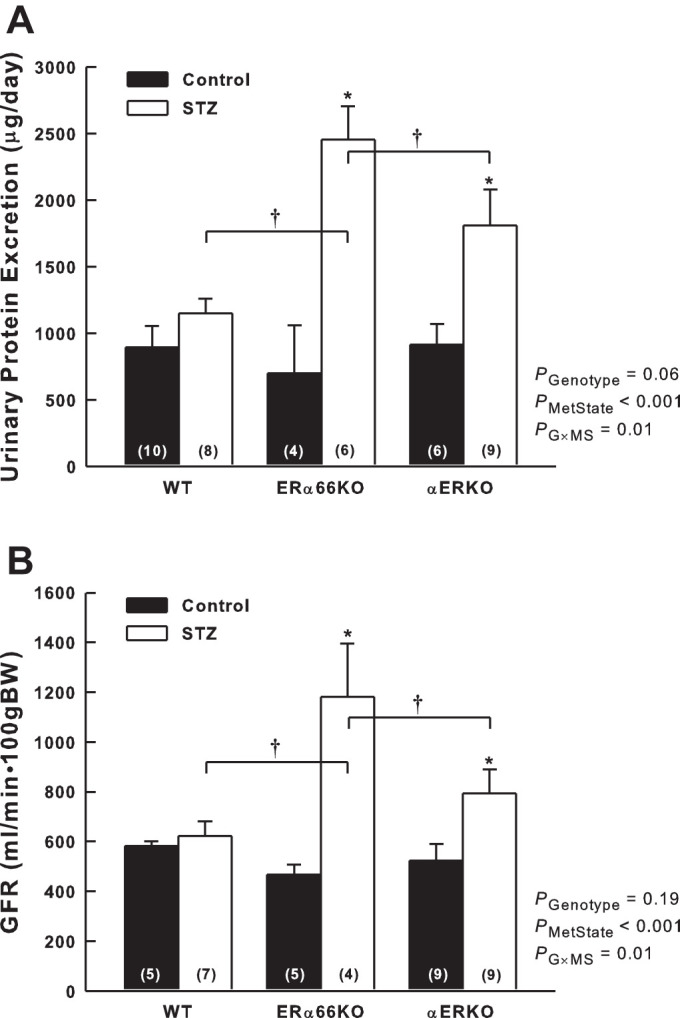
Effects of T1D and ER genotype on urinary protein excretion and glomerular filtration rate (GFR). A: protein excretion determined based on 24-h urine collection from mice housed in metabolic cages. B: GFR measured in the conscious state using the FITC-Sinistrin method. P values shown are main effects determined by 2-way ANOVA. Note: GFR data required transformation (square root) to satisfy ANOVA assumptions.*P < 0.05 vs. Control of same genotype; †P < 0.05 comparing the same metabolic state in different genotypes (n values shown within bars).
A similar pattern was evident with regard to GFR, which did not differ among the control groups but was significantly greater in ERα66KO-STZ and αERKO-STZ groups than in control mice with the same ER genotypes (Fig. 5B). WT-STZ and WT-Control mice exhibited similar values for GFR. ERα66KO-STZ mice exhibited significantly higher GFR than WT-STZ (P = 0.004) or αERKO-STZ mice (P = 0.04); however, GFR in αERKO-STZ mice did not differ significantly from that of WT-STZ (P = 0.16). Because ANOVA indicated a significant interaction between ER genotype and metabolic state, in terms of both protein excretion and GFR, ER status appears to be a contributing factor influencing glomerular function during T1D.
Interstitial Macrophage Accumulation
As shown in Fig. 6, both genotype and metabolic state impacted F4/80 immunostaining (a marker of mature macrophages) in the renal cortex. F4/80 immunostaining was greater in STZ mice than in control mice across all ER genotypes. Values obtained in ERα66KO mice were significantly lower than in WT and αERKO mice, reflecting the main effect of ER genotype on F4/80 immunostaining independent of metabolic state. However, ANOVA failed to reveal a significant interaction between genotype and metabolic state, indicating that ER status is not a major determinant of T1D-induced renal cortical macrophage accumulation.
Fig. 6.
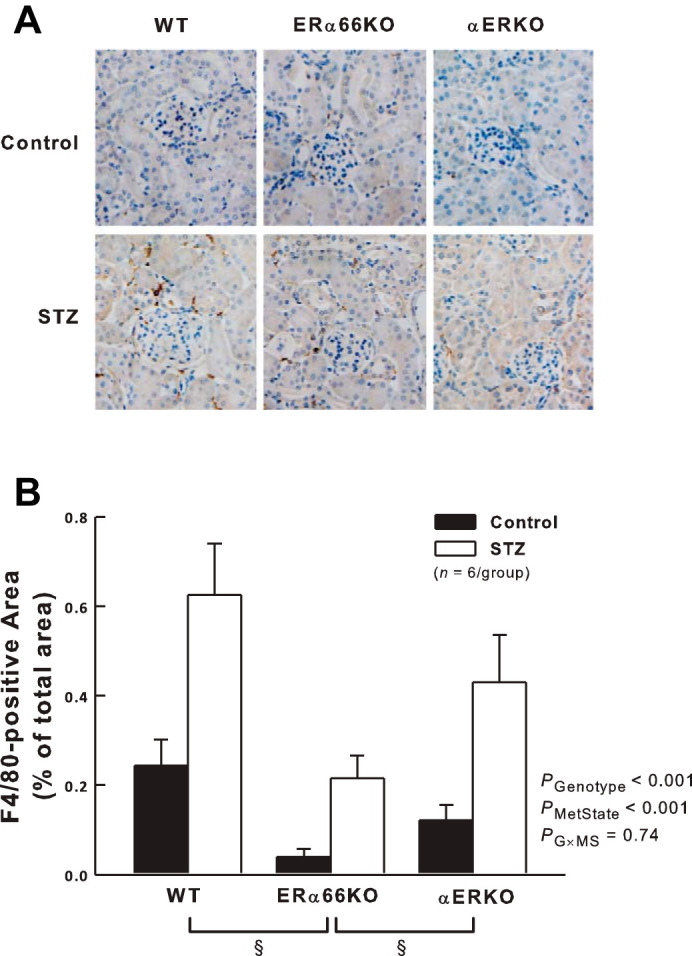
Effects of T1D and ER genotype on renal cortical interstitial macrophage infiltration. A: representative renal immunohistochemistry showing F4/80-positive macrophages in dark brown. B: quantification of F4/80-positive cells in kidneys from each group of mice. P values shown are main effects determined by 2-way ANOVA, after transformation (square root) to satisfy ANOVA assumptions. *P < 0.05 vs. Control of same genotype. §P < 0.05 across genotypes.
MAPK Activation
ERK1/2 phosphorylation (relative to total ERK levels) was assessed by Western blotting as an indicator of MAPK activation. As shown in Fig. 7, renal cortical phospho-ERK1/2 levels were significantly higher in STZ mice than in control mice across all genotypes, reflecting the main effect of metabolic state on this parameter. Genotype did not significantly impact phospho-ERK1/2 levels in these animals and, hence, appears not to be a determinant of T1D-induced MAPK activation in the renal cortex.
Fig. 7.
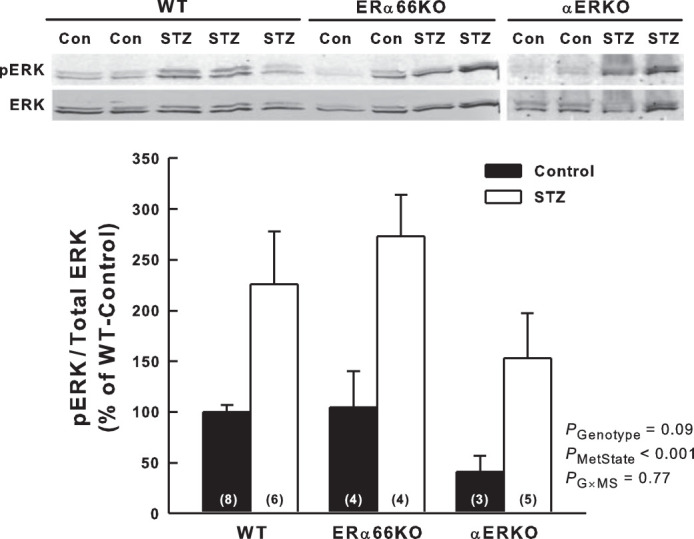
Effects of T1D and estrogen receptor genotype on mitogen-activated protein kinase (MAPK) activation in the renal cortex. A: representative Western blots for extracellular signal-regulated kinase-1/2 (ERK) and phosphorylated ERK1/2 (pERK) in the renal cortex. B: quantification of Western blot data as pERK relative-to-total ERK in the renal cortex and illustrated as %WT-Control. P values shown are main effects determined by 2-way ANOVA (n values shown within bars).
DISCUSSION
The major findings of this study reveal differential influences of the full-length ERα66 and its splice variants during the early stage of T1D-induced renal disease in female mice. Hyperfiltration and proteinuria in T1D are attenuated via an ERα66-dependent mechanism that is unaffected by splice variant status. ERα splice variants may exert some inhibitory influence on glomerular size and inflammation. These inhibitory signals are masked in the presence of the full-length ERα66, suggesting that the receptors act in opposition to each other. These observations indicate a complex interplay between estrogen receptors capable of modulating renal structure and function during T1D.
A major obstacle to understanding the specific roles of ERα and its splice variants in health and disease is the paucity of experimental tools capable of differentiating their influence in the intact organism. A novel aspect of the present study was the use of genetic mouse models lacking either the full-length receptor (ERα66KO) or all forms of this receptor including its splice variants (αERKO). Both ERα66KO and αERKO genotypes lack the full-length receptor, while the splice variants (ERα36 and ERα46) are expressed in ERα66KO but absent in αERKO. Hence, we reasoned that phenomena exhibited by both genotypes reflect lack of the full-length receptor, whereas responses evident only in ERα66KO mice reflect the impact of splice variants expressed in these animals but lacking in αERKO mice. Finally, phenomena evident only in αERKO mice were considered to reflect the lack of splice variants. This interpretive strategy was exploited in evaluating the role of ERα and its splice variants in the renal changes accompanying STZ-induced T1D in female mice.
Characterization of ERα66KO and αERKO Mice and the Phenotypic Impact of T1D
The ERα66KO model resulted in a marked decrease in renal cortical ERα36 protein expression in the basal state, indicating that expression of the full-length receptor exerts a positive impact, either directly or indirectly, on ERα36 expression in the kidney. This phenomenon is not global, as there is no correlation between ERα36 and ERα66 expression in breast cancer cells, and different promoters seem to regulate expression of these receptors (32). Despite downregulation of ERα36 in the ERα66KO, elevated estradiol levels in these mice (5) may still produce a significant equivalent functional effect via this splice variant.
In light of the structural and functional impact of ERα66 and its splice variants evident during T1D in the present study, it is important to consider whether T1D alters renal expression of these proteins, as well as the possibility that ERα66KO might evoke a compensatory change in expression of its splice variants. In WT mice, STZ-induced T1D did not significantly alter renal cortical levels of ERα66 or ERβ, but there was an ~35% reduction in ERα36 levels. Downregulation of this protein, and the resulting effect on ERα36-mediated signaling, may impact susceptibility to the renal consequences of T1D. Because ERα36 acts, in part, to suppress the transactivation activities of ERα66 (36), the T1D-induced decrease in ERα36 protein may facilitate ERα66-dependent signaling.
Alternatively, ERα46 may be responsible for altering the response to T1D. Renal cortical ERα46 protein expression is unaltered in T1D and is only modestly decreased in ERα66KO. Cellular localization of the receptor within the kidney has not been established because of the lack of an antibody that can distinguish ERα46 from either ERα66 or ERα36 in immunostaining studies. T1D did not alter the protein levels of ERβ in female mice regardless of ERα genotype. Establishing the individual outcome of signaling of each of these receptors was beyond the scope of this project.
Both ERα36 and ERα46 suppress the transactivation activities of ERα66 (9, 36), and ERα36 also suppresses transactivation of ERβ (36). Thus, these splice variants are capable of inhibiting genomic estrogen signaling. Both splice variants are also implicated in membrane-associated estrogen signaling, including nongenomic effects such as estrogen-induced endothelial NO production (8, 27) or MAPK/ERK activation (18, 36). Although MAPK signaling is implicated in the renal pathophysiological events accompanying T1D (34), results of the present study suggest that T1D-induced ERK1/2 phosphorylation arises independently of ERα genotype. Hence, the results failed to provide strong evidence for a role of ERα or its splice variants in MAPK/ERK activation in Control or STZ mice.
Increased body weight and blood glucose levels, as well as impaired glucose tolerance, are evident in ovariectomized mice (3). These observations, together with the obesity, metabolic syndrome, and defects in bone maturation evident in humans of both sexes with aromatase deficiency (6), suggest an important role for estrogen in glucose homeostasis and regulation of body weight. Le May et al. (20) reported that blood glucose concentration is higher in both male and female ERα66KO-STZ compared with WT-STZ mice, in support of evidence that ERα66 protects pancreatic β-cells from STZ-induced apoptosis. The results of the present study reveal that loss of ERα66 in female mice exacerbates the T1D-induced elevation of blood glucose. Moreover, a second STZ injection was often necessary to achieve hyperglycemia in WT mice.
The impact of estrogen on body weight maintenance involves not only regulation of glucose homeostasis but also food consumption, energy expenditure, fat deposition, and hepatic gluconeogenesis and glycogenolysis (1, 10, 25). ERβ-null mice maintain normal weight, implicating ERα-dependent pathways in body weight maintenance (4). The estrogen-sensitive mechanisms of weight maintenance involve ERα in a variety of neuronal populations within the hypothalamus, a major brain center for regulation of energy homeostasis and food intake (reviewed in Ref. 10). Our observation that female ERα66KO- and αERKO-Control mice were ~10% heavier than their WT littermates at the start of the experiment supports the role of ERα66 in maintaining normal weight, in accord with previous reports that deficiency of either aromatase or ERα66 in mice results in obesity (4). Over the 6-wk course of the study, ERα genotype did not influence the weight gain evident in control mice; however, the absence of ERα66 resulted in a significant decrease in body weight during the diabetic state.
Impact of ER Genotype on Renal Structure and Function in T1D
Both the ERα66KO and αERKO mice were generated on a C57BL/6 genetic background, and C57BL/6 mice are resistant to nephropathy (2, 13). Although it was difficult to induce T1D in the WT mice, they exhibited early signs of nephropathy, including glomerular enlargement, macrophage infiltration, and renal hypertrophy.
The renal hypertrophy of T1D appears to arise through a mechanism that is primarily ERα independent, as it was apparent in all mice regardless of ER genotype. In addition to renal hypertrophy, one of the earliest renal structural alterations in models of T1D is an increase in glomerular area. The glomerular enlargement reflects primarily mesangial expansion involving cell cycle arrest at the G1/S checkpoint leading to mesangial cell hypertrophy, as well as accumulation of extracellular matrix components such as collagens and fibronectin (35). Estradiol stimulates matrix metalloproteinase-2 activity in cultured mesangial cells (12), which should suppress matrix accumulation and glomerular enlargement. This phenomenon has been suggested to confer a protective effect of female sex on renal disease progression (12). Indeed, our previous work revealed that female mice lacking the full-length ERα66 do not exhibit glomerular enlargement 2 wk after onset of T1D (21). The results of the present study extend that observation to the 6-wk time point, when ERα66KO-STZ mice have glomerular area similar to thatof ERα66KO controls. If this phenomenon simply reflected lack of a proenlargement impact of ERα66, it would have also been evident in animals lacking both the full-length receptor and its splice variants (αERKO-STZ). Similarly, this is unlikely to reflect differences in blood glucose levels, because both WT- and αERKO-STZ mice exhibited glomerular enlargement despite differences in hyperglycemia. Because T1D-induced glomerular enlargement was manifested in αERKO-STZ animals, but not in ERα66KO-STZ mice [in this report and in our previous study (21)], ERα splice variants may provide some protection against glomerular enlargement; however, because the ANOVA did not reach statistical significance for interactions between genotype and metabolic state, the data are inconclusive in this regard.
Estradiol treatment reduces albumin excretion in ovariectomized rats with STZ-induced T1D (30). Moreover, estradiol treatment of male mice reverses albuminuria and hyperfiltration, as well as renal pathological changes, in a transgenic model of severe T1D (16). Our observations extend those reports by implicating specific involvement of the full-length ERα66 in suppressing hyperfiltration and proteinuria in female mice with T1D. This phenomenon is evidenced by the presence of hyperfiltration and proteinuria in both αERKO- and ERα66KO-STZ mice (both of which lack ERα66), but not in WT-STZ mice. These T1D-induced phenomena were apparent regardless of ER splice variant status, although the hyperfiltration and proteinuria were of greater magnitude in ERα66KO-STZ than in αERKO-STZ mice. Hence, the mechanism through which ERα66 protects against hyperfiltration and albuminuria in female mice with T1D remains unknown.
Inflammation is a key contributor to diabetic nephropathy, with renal macrophage accumulation ultimately contributing to development of fibrosis through processes involving secretion of proinflammatory and profibrotic molecules such as tumor necrosis factor-α, matrix metalloproteinases, and transforming growth facor-β (15). The increase in F4/80-positive cells observed in kidneys of STZ mice confirms accumulation of mature macrophages in our model of T1D. Although there was no interaction between genotype and metabolic state in our study, ERα66KO mice showed fewer macrophages than either WT or αERKO mice, suggesting that splice variants may play a role in renal cortical inflammation in this model.
In summary, the present study explored ER-mediated events postulated to contribute to the renal structural and functional changes associated with diabetic nephropathy. Loss of ERα66 signaling, regardless of splice variant status, exaggerated STZ-induced hyperglycemia and rendered the animals prone to T1D-induced hyperfiltration and proteinuria. These observations implicate the full-length ERα66 in protecting female mice from diabetic hyperfiltration and proteinuria. ERα splice variants exerted effects that decreased glomerular area and interstitial macrophage infiltration in the renal cortex, although these effects were masked in the presence of ERα66. Further studies are necessary to clarify the impact of ERα66 and its splice variants on T1D-induced glomerular enlargement as well as to delineate the signaling pathways involved in ER-dependent events associated with T1D. A more thorough understanding of the components of estrogen signaling in the kidney and how they interact may make it possible to therapeutically target the renoprotective ERs while minimizing negative side effects.
GRANTS
This work was funded by nonrestricted funds from the University of Nebraska Medical Center (UNMC). D. Irsik was supported by a research assistantship from the UNMC Department of Cellular and Integrative Physiology.
DISCLOSURES
No conflicts of interest, financial or otherwise, are declared by the authors.
AUTHOR CONTRIBUTIONS
D.L.I., P.K.C., and P.H.L. conceived and designed research; D.L.I. and R.W.F. performed experiments; D.L.I., M.J.R.-A., E.M.C., and R.W.F. analyzed data; D.L.I., H.L.B., P.K.C., and P.H.L. interpreted results of experiments; D.L.I., H.L.B., and P.K.C. prepared figures; D.L.I. drafted manuscript; D.L.I., M.J.R.-A., E.M.C., R.W.F., H.L.B., P.K.C., and P.H.L. approved final version of manuscript; H.L.B., P.K.C., and P.H.L. edited and revised manuscript.
ACKNOWLEDGMENTS
We gratefully acknowledge the valuable insight provided by Dr. Karen A. Gould, as well as Dr. Kendra Schmid’s assistance with statistical analyses and interpretation. Dr. Jurgen Schnermann kindly provided a protocol for the calculation of GFR with FITC-Sinistrin.
Present address for D. Irsik: Department of Neuroscience and Regenerative Medicine, Medical College of Georgia, Augusta University, Augusta, GA 30912.
REFERENCES
- 1.Ahmed-Sorour H, Bailey CJ. Role of ovarian hormones in the long-term control of glucose homeostasis. Interaction with insulin, glucagon and epinephrine. Horm Res 13: 396–403, 1980. doi: 10.1159/000179307. [DOI] [PubMed] [Google Scholar]
- 2.Breyer MD, Böttinger E, Brosius FC III, Coffman TM, Harris RC, Heilig CW, Sharma K; AMDCC . Mouse models of diabetic nephropathy. J Am Soc Nephrol 16: 27–45, 2005. doi: 10.1681/ASN.2004080648. [DOI] [PubMed] [Google Scholar]
- 3.Bryzgalova G, Gao H, Ahren B, Zierath JR, Galuska D, Steiler TL, Dahlman-Wright K, Nilsson S, Gustafsson JÅ, Efendic S, Khan A. Evidence that oestrogen receptor-α plays an important role in the regulation of glucose homeostasis in mice: insulin sensitivity in the liver. Diabetologia 49: 588–597, 2006. doi: 10.1007/s00125-005-0105-3. [DOI] [PubMed] [Google Scholar]
- 4.Couse JF, Korach KS. Estrogen receptor null mice: what have we learned and where will they lead us? Endocr Rev 20: 358–417, 1999. doi: 10.1210/edrv.20.3.0370. [DOI] [PubMed] [Google Scholar]
- 5.Couse JF, Yates MM, Walker VR, Korach KS. Characterization of the hypothalamic-pituitary-gonadal axis in estrogen receptor (ER) null mice reveals hypergonadism and endocrine sex reversal in females lacking ERα but not ERβ. Mol Endocrinol 17: 1039–1053, 2003. doi: 10.1210/me.2002-0398. [DOI] [PubMed] [Google Scholar]
- 6.Czajka-Oraniec I, Simpson ER. Aromatase research and its clinical significance. Endokrynol Pol 61: 126–134, 2010. [PubMed] [Google Scholar]
- 7.Dixon A, Maric C. 17β-Estradiol attenuates diabetic kidney disease by regulating extracellular matrix and transforming growth factor-β protein expression and signaling. Am J Physiol Renal Physiol 293: F1678–F1690, 2007. doi: 10.1152/ajprenal.00079.2007. [DOI] [PMC free article] [PubMed] [Google Scholar]
- 8.Figtree GA, McDonald D, Watkins H, Channon KM. Truncated estrogen receptor α 46-kDa isoform in human endothelial cells: relationship to acute activation of nitric oxide synthase. Circulation 107: 120–126, 2003. doi: 10.1161/01.CIR.0000043805.11780.F5. [DOI] [PubMed] [Google Scholar]
- 9.Flouriot G, Brand H, Denger S, Metivier R, Kos M, Reid G, Sonntag-Buck V, Gannon F. Identification of a new isoform of the human estrogen receptor-alpha (hER-α) that is encoded by distinct transcripts and that is able to repress hER-α activation function 1. EMBO J 19: 4688–4700, 2000. doi: 10.1093/emboj/19.17.4688. [DOI] [PMC free article] [PubMed] [Google Scholar]
- 10.Frank A, Brown LM, Clegg DJ. The role of hypothalamic estrogen receptors in metabolic regulation. Front Neuroendocrinol 35: 550–557, 2014. doi: 10.1016/j.yfrne.2014.05.002. [DOI] [PMC free article] [PubMed] [Google Scholar]
- 11.Gale EAM, Gillespie KM. Diabetes and gender. Diabetologia 44: 3–15, 2001. doi: 10.1007/s001250051573. [DOI] [PubMed] [Google Scholar]
- 12.Guccione M, Silbiger S, Lei J, Neugarten J. Estradiol upregulates mesangial cell MMP-2 activity via the transcription factor AP-2. Am J Physiol Renal Physiol 282: F164–F169, 2002. doi: 10.1152/ajprenal.0318.2000. [DOI] [PubMed] [Google Scholar]
- 13.Gurley SB, Clare SE, Snow KP, Hu A, Meyer TW, Coffman TM. Impact of genetic background on nephropathy in diabetic mice. Am J Physiol Renal Physiol 290: F214–F222, 2006. doi: 10.1152/ajprenal.00204.2005. [DOI] [PubMed] [Google Scholar]
- 14.Hewitt SC, Kissling GE, Fieselman KE, Jayes FL, Gerrish KE, Korach KS. Biological and biochemical consequences of global deletion of exon 3 from the ERα gene. FASEB J 24: 4660–4667, 2010. doi: 10.1096/fj.10-163428. [DOI] [PMC free article] [PubMed] [Google Scholar]
- 15.Hickey FB, Martin F. Diabetic kidney disease and immune modulation. Curr Opin Pharmacol 13: 602–612, 2013. doi: 10.1016/j.coph.2013.05.002. [DOI] [PubMed] [Google Scholar]
- 16.Inada A, Inada O, Fujii NL, Nagafuchi S, Katsuta H, Yasunami Y, Matsubara T, Arai H, Fukatsu A, Nabeshima YI. Adjusting the 17β-estradiol-to-androgen ratio ameliorates diabetic nephropathy. J Am Soc Nephrol 27: 3035–3050, 2016. doi: 10.1681/ASN.2015070741. [DOI] [PMC free article] [PubMed] [Google Scholar]
- 17.Irsik DL, Carmines PK, Lane PH. Classical estrogen receptors and ERα splice variants in the mouse. PLoS One 8: e70926, 2013. doi: 10.1371/journal.pone.0070926. [DOI] [PMC free article] [PubMed] [Google Scholar]
- 18.Kang L, Zhang X, Xie Y, Tu Y, Wang D, Liu Z, Wang ZY. Involvement of estrogen receptor variant ER-α36, not GPR30, in nongenomic estrogen signaling. Mol Endocrinol 24: 709–721, 2010. doi: 10.1210/me.2009-0317. [DOI] [PMC free article] [PubMed] [Google Scholar]
- 19.Lane PH. Determination of mean glomerular volume in nephrectomy specimens. Lab Invest 72: 765–770, 1995. [PubMed] [Google Scholar]
- 20.Le May C, Chu K, Hu M, Ortega CS, Simpson ER, Korach KS, Tsai MJ, Mauvais-Jarvis F. Estrogens protect pancreatic β-cells from apoptosis and prevent insulin-deficient diabetes mellitus in mice. Proc Natl Acad Sci USA 103: 9232–9237, 2006. doi: 10.1073/pnas.0602956103. [DOI] [PMC free article] [PubMed] [Google Scholar]
- 21.Lovegrove AS, Sun J, Gould KA, Lubahn DB, Korach KS, Lane PH. Estrogen receptor-α-mediated events promote sex-specific diabetic glomerular hypertrophy. Am J Physiol Renal Physiol 287: F586–F591, 2004. doi: 10.1152/ajprenal.00414.2003. [DOI] [PubMed] [Google Scholar]
- 22.Lubahn DB, Moyer JS, Golding TS, Couse JF, Korach KS, Smithies O. Alteration of reproductive function but not prenatal sexual development after insertional disruption of the mouse estrogen receptor gene. Proc Natl Acad Sci USA 90: 11162–11166, 1993. doi: 10.1073/pnas.90.23.11162. [DOI] [PMC free article] [PubMed] [Google Scholar]
- 23.Mankhey RW, Wells CC, Bhatti F, Maric C. 17β-Estradiol supplementation reduces tubulointerstitial fibrosis by increasing MMP activity in the diabetic kidney. Am J Physiol Regul Integr Comp Physiol 292: R769–R777, 2007. doi: 10.1152/ajpregu.00375.2006. [DOI] [PubMed] [Google Scholar]
- 24.Maric C, Sullivan S. Estrogens and the diabetic kidney. Gend Med 5, Suppl A: S103–S113, 2008. doi: 10.1016/j.genm.2008.03.010. [DOI] [PMC free article] [PubMed] [Google Scholar]
- 25.Matute ML, Kalkhoff RK. Sex steroid influence on hepatic gluconeogenesis and glucogen formation. Endocrinology 92: 762–768, 1973. doi: 10.1210/endo-92-3-762. [DOI] [PubMed] [Google Scholar]
- 26.Miller SA, Dykes DD, Polesky HF. A simple salting out procedure for extracting DNA from human nucleated cells. Nucleic Acids Res 16: 1215, 1988. doi: 10.1093/nar/16.3.1215. [DOI] [PMC free article] [PubMed] [Google Scholar]
- 27.Pendaries C, Darblade B, Rochaix P, Krust A, Chambon P, Korach KS, Bayard F, Arnal JF. The AF-1 activation-function of ERα may be dispensable to mediate the effect of estradiol on endothelial NO production in mice. Proc Natl Acad Sci USA 99: 2205–2210, 2002. doi: 10.1073/pnas.042688499. [DOI] [PMC free article] [PubMed] [Google Scholar]
- 28.Penot G, Le Péron C, Mérot Y, Grimaud-Fanouillère E, Ferrière F, Boujrad N, Kah O, Saligaut C, Ducouret B, Métivier R, Flouriot G. The human estrogen receptor-α isoform hERα46 antagonizes the proliferative influence of hERα66 in MCF7 breast cancer cells. Endocrinology 146: 5474–5484, 2005. doi: 10.1210/en.2005-0866. [DOI] [PubMed] [Google Scholar]
- 29.Qi Z, Breyer MD. Measurement of glomerular filtration rate in conscious mice. Methods Mol Biol 466: 61–72, 2009. doi: 10.1007/978-1-59745-352-3_5. [DOI] [PubMed] [Google Scholar]
- 30.Riazi S, Maric C, Ecelbarger CA. 17-β Estradiol attenuates streptozotocin-induced diabetes and regulates the expression of renal sodium transporters. Kidney Int 69: 471–480, 2006. doi: 10.1038/sj.ki.5000140. [DOI] [PubMed] [Google Scholar]
- 31.Rosolowsky ET, Skupien J, Smiles AM, Niewczas M, Roshan B, Stanton R, Eckfeldt JH, Warram JH, Krolewski AS. Risk for ESRD in type 1 diabetes remains high despite renoprotection. J Am Soc Nephrol 22: 545–553, 2011. doi: 10.1681/ASN.2010040354. [DOI] [PMC free article] [PubMed] [Google Scholar]
- 32.Shi L, Dong B, Li Z, Lu Y, Ouyang T, Li J, Wang T, Fan Z, Fan T, Lin B, Wang Z, Xie Y. Expression of ER-α36, a novel variant of estrogen receptor α, and resistance to tamoxifen treatment in breast cancer. J Clin Oncol 27: 3423–3429, 2009. doi: 10.1200/JCO.2008.17.2254. [DOI] [PMC free article] [PubMed] [Google Scholar]
- 33.Sturgeon C, Sam AD II, Law WR. Rapid determination of glomerular filtration rate by single-bolus inulin: a comparison of estimation analyses. J Appl Physiol (1985) 84: 2154–2162, 1998. doi: 10.1152/jappl.1998.84.6.2154. [DOI] [PubMed] [Google Scholar]
- 34.Tang SC, Leung JC, Lai KN. Diabetic tubulopathy: an emerging entity. Contrib Nephrol 170: 124–134, 2011. doi: 10.1159/000325647. [DOI] [PubMed] [Google Scholar]
- 35.Vallon V, Komers R. Pathophysiology of the diabetic kidney. Compr Physiol 1: 1175–1232, 2011. doi: 10.1002/cphy.c100049. [DOI] [PMC free article] [PubMed] [Google Scholar]
- 36.Wang Z, Zhang X, Shen P, Loggie BW, Chang Y, Deuel TF. A variant of estrogen receptor-α, hER-α36: transduction of estrogen- and antiestrogen-dependent membrane-initiated mitogenic signaling. Proc Natl Acad Sci USA 103: 9063–9068, 2006. doi: 10.1073/pnas.0603339103. [DOI] [PMC free article] [PubMed] [Google Scholar]


